 Open Access Article
Creative Commons Attribution 3.0 Unported Licence
Study of the influence of the formation protocol on the SEI layer formed at the graphite electrode surface of a non-aqueous potassium-ion hybrid supercapacitor (KIC) through STEM and XPS analyses
Marie-Eve
Yvenat
 *a,
Benoit
Chavillon
a,
Eric
Mayousse
a,
Eric
De Vito
a,
Adrien
Boulineau
a,
Fabien
Perdu
 a and
Philippe
Azaïs
b
aUniv. Grenoble Alpes, CEA, LITEN, Grenoble F-38000, France. E-mail: marie-eve.yvenat@cea.fr
bUniv. Grenoble Alpes, CEA, DPE, Grenoble F-38000, France
First published on 4th August 2023
Abstract
The non-aqueous potassium-ion hybrid supercapacitor (KIC) represents a strategic material-free and low-cost technology with increased safety and higher energy densities compared to conventional supercapacitors. It has been shown previously that the stability and reproducibility of cycling results are very different depending on the formation protocol applied to KIC cells. The formation protocol is known to be a key manufacturing step of Li-ion batteries to create a stable and compact solid electrolyte interphase (SEI) on the negative electrode surface. This study is therefore focused on the role played by the formation protocol in the SEI layer nature within KIC technology. First, the combination of STEM images and XPS analysis allowed us to analyze the appearance and composition of the SEI after two distinct formation protocols. Then, a follow-up of the composition of the SEI by XPS analysis enabled the study of the relationship between the stability of the SEI, especially regarding the potassium fluoride (KF) content, and the electrochemical performance. We concluded that the constant voltage formation leads to the creation of a homogeneous and continuous SEI with a low KF content. Moreover, a correlation between the evolution of the KF content in the SEI and the evolution of cycling performance was observed.
1. Introduction
In the framework of sustainable energy production and development, electrical energy storage (EES) is a key factor to achieve this goal. At the vanguard of energy storage are electrochemical storage based systems, such as batteries and electrochemical capacitors. For some years, a fine combination of batteries and electrical double-layer capacitors (EDLCs) has been emerging as a way to offset the specific issues of both technologies and represent a new direction for future EES devices to reach high energy and power densities.1,2 The type of design combining a metal-ion battery-type electrode and a capacitor-type electrode with distinct storage mechanisms is referred to as hybrid supercapacitors.Like the deployment of Li-ion batteries, the use of lithium was initially chosen for hybrid capacitors.3 However, the idea of replacing lithium with other alkaline elements is gradually emerging;4 specifically research on potassium-ion batteries and supercapacitors has been emerging and increasing in recent years.5,6 The non-aqueous potassium-ion hybrid supercapacitor (KIC) presented here consists of an activated carbon positive electrode and a graphite negative electrode working in an acetonitrile based non-aqueous electrolyte and a potassium salt. Acetonitrile has a high dielectric constant and high solvating power but a lower viscosity than carbonates. These properties are attractive for high-power applications, which are very demanding in terms of ionic transport, such as supercapacitors and hybrid capacitors. Moreover, the use of acetonitrile allows the reduction of the costs of KIC technology compared to LICs. This KIC system involves the use of cheap and readily available materials and the substitution of any strategic materials such as copper and lithium and therefore represents a low-cost technology with increased safety and promising performance.
The first KIC prototypes7 allow higher energy densities than those of conventional supercapacitors to be obtained. However the non-reproducibility and the instability of the results are major issues for the development of this technology. To overcome these points, the influence of the formation protocol on cycling performance was studied. Thanks to these results, a proper formation protocol for the KIC system, which offers good energy density (14 W h kgelectrochemical core−1) with excellent stability at a fast charging rate, was developed.8 Since the alkali ion insertion in graphite involves the formation of a thin solid electrolyte interphase (SEI) during the first charge, the composition of this layer is crucial for optimum electrochemical performances.9 The study of the aging mechanisms of potassium-based systems, and in particular the formation of a SEI, is still at a preliminary stage and remains based on Li-ion and Na-ion literature so far. Allgayer et al.10 performed a detailed XPS analysis on graphite electrodes cycled either in a lithium or potassium half-cell, which provides a rather complete XPS database of commercial K-based reference compounds. In order to aid the assignment of potassium species in the SEI formed in K-graphite samples, reference measurements were conducted on selected characteristic SEI compounds (e.g., KF and KPF6) or closely related compounds (e.g., CH3COOK). The organic character of the SEI and its significant thickness seem to be an obstacle to the prolonged life of K-ion systems. The higher solubilities of organic products lead to recurrent SEI dissolution/reformation reactions, which do not allow a stable passivation layer to be obtained.11 In the case of Li-ion batteries, the composite nature of the SEI provides a protective function avoiding continuous degradation.12 The significant and stable LiF content plays an important role in this protection process in particular. The SEI in a K-ion battery (KIB) also exhibits a layered structure with organic and inorganic species.13 However, it seems necessary to achieve an SEI containing more KF14 to improve the performance of K-ion batteries. The design of more stable interphases is therefore a key point in the development of K-based systems. The SEI originates from the degradation of the solvent and the salt of the electrolyte and is therefore governed by the reactivity and the composition of the electrolyte. The first studies on the SEI formed in the KIB provide information on the mechanisms of formation and the chemical nature of the SEI in carbonate based electrolytes.15 However, the electrolyte used in the KIC system present here consists of acetonitrile for which the SEI formation remains unclear.16,17
We present here a detailed study based on scanning transmission electron microscopy and X-ray photoemission spectroscopy (XPS) coupled with electrochemical measurements. This study emphasizes the role played by the formation protocol in the SEI layer nature and in the electrochemical performance of KICs.
2. Materials and methods
2.1. Electrode preparation
The negative graphite-based electrode is prepared by the aqueous route with a dry extract of 38% by mixing natural graphite, SFG6 graphite (IMERYS Graphite & Carbon), Super P Li (IMERYS Graphite & Carbon) as a conductive filler and sodium carboxymethylcellulose CMC (Ashland, 7HXF grade) and styrene–butadiene SBR (BASF 2427) as polymer binders with a ratio of 75.5![[thin space (1/6-em)]](https://www.rsc.org/images/entities/char_2009.gif) :
:![[thin space (1/6-em)]](https://www.rsc.org/images/entities/char_2009.gif) 11.5
11.5![[thin space (1/6-em)]](https://www.rsc.org/images/entities/char_2009.gif) :
:![[thin space (1/6-em)]](https://www.rsc.org/images/entities/char_2009.gif) 10
10![[thin space (1/6-em)]](https://www.rsc.org/images/entities/char_2009.gif) :
:![[thin space (1/6-em)]](https://www.rsc.org/images/entities/char_2009.gif) 1
1![[thin space (1/6-em)]](https://www.rsc.org/images/entities/char_2009.gif) :
:![[thin space (1/6-em)]](https://www.rsc.org/images/entities/char_2009.gif) 2 wt%, until a homogenized consistency was obtained. The mixture is then coated onto a 30 μm-thick etched aluminium current collector to have a mass loading of 4 mg cm−2. Finally, the single side coated electrode is calendered to obtain a porosity of 38%.
2 wt%, until a homogenized consistency was obtained. The mixture is then coated onto a 30 μm-thick etched aluminium current collector to have a mass loading of 4 mg cm−2. Finally, the single side coated electrode is calendered to obtain a porosity of 38%.
On the positive side, an activated carbon (AC) double layer coated electrode on an aluminium collector was purchased from Samwha Capacitor Group and used as received. The mass loading of this electrode is 5.2 mg cm−2 and its porosity is 66% – due to high activated carbon porosity. This electrode is also used as both the positive and negative electrode in symmetrical systems.
As detailed in the literature,18 the capacity of a hybrid supercapacitor must be limited by the capacitive electrode, i.e. the positive electrode in our case, which depends directly on the operating potential range. It is therefore essential to use a suitable negative electrode with a flat potential profile. Knowing the capacitance of the electrode in farads and considering an operation of a symmetrical supercapacitor cell over a voltage range of 0–2.7 V, the capacity of the activated carbon electrode in this system is evaluated at 35 mA h g−1. Taking into account the fraction of active material and the mass loading of the positive electrode, a surface capacity of 0.17 mA h cm−2 is obtained. For the negative electrode whose fraction of active material is 87%, taking into account the mass loading and the theoretical formation capacity of the compound KC8 at 279 mA h g−1 (ref. 19) a surface capacity of 0.97 mA h cm−2 is obtained. The negative electrode is therefore largely oversized compared to the positive electrode. As mentioned above, this sizing is carried out so that a dilute graphite intercalation compound (GIC) is obtained (typically KC8x with x > 5) in order to strongly limit the volume expansion and ensure good cycleability for the whole device. This balancing can still be studied to be improved but it currently allows the operation of the system. The cell capacity is 0.16 mA h cm−2 (cell surface: 12.25 cm2).
2.2. Cell preparation and electrochemical measurements
Hybrid potassium-ion capacitors were characterized electrochemically at the single layer pouch cell scale. Positive and negative electrodes were dried at 55 °C and punched into a square shape of 35 mm × 35 mm to obtain a geometric surface area of 12.25 cm2. Hybrid graphite/AC systems were assembled using a 25 μm thick polypropylene film as the separator and a flexible aluminium-plastic package. The employed electrolyte is 0.8 M potassium hexafluorophosphate (KPF6) dissolved in anhydrous acetonitrile (AN). After the electrolyte was injected into the cell package operated in a glove box, the package was hermetically sealed under vacuum.No pre-treatment or pre-potassiation of the graphite electrode was performed prior to the electrochemical measurements. The electrolyte is the only source of K+ cations so each cell is activated with 450 μL of electrolyte with an excess over a total pore volume greater than 200% to ensure potassium supply and conduction of ions.
All the electrochemical measurements were conducted by using an Arbin battery testing system at room temperature and ambient pressure. The standard ageing protocol is applied to the cells that consists of cycling at 16 mA cm−2 (100C, with C being the cell capacity) without any pause over thousands of cycles. Prior to this, two formation protocols are applied to the cells which will be described later in the paper.
2.3. Characterization techniques
To study the passivation layer (SEI) created on the surface of the negative electrode of the KIC system, two characterization techniques were combined. Scanning transmission electron microscopy was used to study the structure of the SEI and X-ray photoelectron spectrometry (XPS) to determine the composition of the SEI.On one hand, the samples for XPS analysis were fixed to the sample holder using double side tape. They were then transferred from the glove box to the XPS analysis spectrometer using an airtight vessel. On the other hand, the part of the electrode for STEM analysis was scraped to obtain a powder. This powder was ground to break up any agglomerates before being deposited on a copper grid with a carbon structure. The sample was then transferred to the STEM analysis chamber using an airtight vessel.
3. Results and discussion
3.1. Formation protocol and electrochemical performance
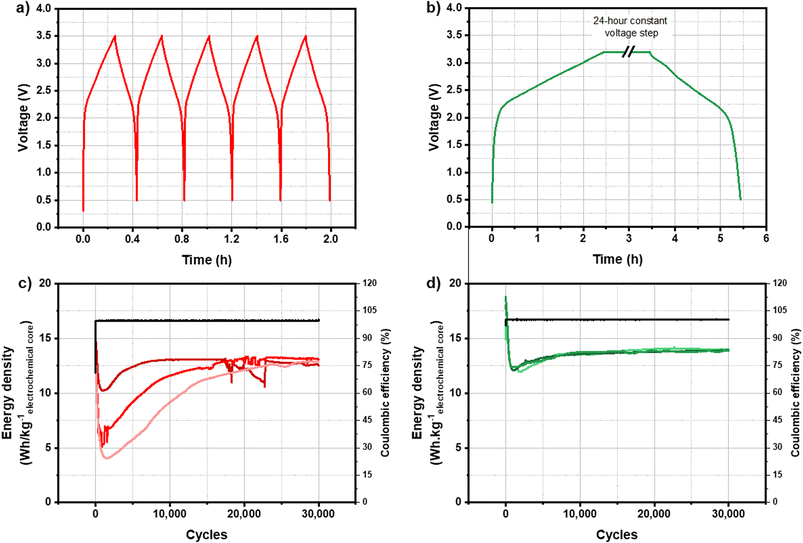
The main issue for the development of KIC technology was the non-reproducibility and the instability of cycling performance. The formation protocol is one of the most important steps in the manufacturing process of Li-ion batteries since it allows the creation of a stable and compact SEI on the surface of the negative electrode. The first study was therefore focused on the influence of the formation protocol on cycling performance. It has been shown previously that the stability and reproducibility of cycling results are very different depending on the formation protocol applied to KIC cells.Two formation protocols giving rise to very different cycling performance have been identified to be the subject of this paper to determine their influence on the SEI layer nature. Fig. 1 presents the voltage as a function of time during constant current formation (Fig. 1a) and during constant voltage formation (Fig. 1c) for one KIC cell as well as the cycling performance following each of these formations (Fig. 1b and d) for a batch of three cells.
The constant current formation protocol, called CC formation, consists of five successive galvanostatic charge/discharge cycles at 0.82 mA cm−2 (5C, with C being the capacity of the cell) at room temperature. The constant voltage formation protocol, called CV formation, consists of a charge at 0.08 mA cm−2 up to 3.2 V, a 24 hour constant voltage step at 3.2 V and a discharge at 0.08 mA cm−2 up to 0.5 V at room temperature. Degassing of the cell is then carried out before cycling to evacuate the gases generated during the formation of the cell.
During both formations, two distinct behaviors are observed. First, a rapid increase in voltage is observed between 0.5 and 2.2 V. A triangular profile is then observed between 2.2 and 3.5 V. Both charge storage phenomena occurring at negative and positive electrodes of a KIC cell explain the shape of the curves. The rapid increase in voltage is related to the potential drop of the negative graphite electrode. The change in slope takes place when this electrode reaches a pseudo-plateau; the typical profile of a capacitive behavior of the positive activated carbon electrode is then observed.
Cycling performance after CC formation is characterized by a gradual decrease over the first thousand cycles from 15 W h kgelectrochemical core−1 down to 4, 6 or 10 W h kgelectrochemical core−1 depending on the cells. An increase in energy densities is then observed until the performance of the three cells stabilizes at around 12.8 W h kgelectrochemical core−1 after more than 20![[thin space (1/6-em)]](https://www.rsc.org/images/entities/char_2009.gif) 000 cycles. Moreover, the results are not reproducible since three different behaviours are observed for identical cells. After CV formation, the energy density of the cells increases from 14.5 to 16.7 W h kgelectrochemical core−1 and then decreases sharply down to 12 W h kgelectrochemical core−1. After a slight increase, performance stabilized at 14 W h kgelectrochemical core−1. Moreover, the results are stable and reproducible on the batch of three cells.
000 cycles. Moreover, the results are not reproducible since three different behaviours are observed for identical cells. After CV formation, the energy density of the cells increases from 14.5 to 16.7 W h kgelectrochemical core−1 and then decreases sharply down to 12 W h kgelectrochemical core−1. After a slight increase, performance stabilized at 14 W h kgelectrochemical core−1. Moreover, the results are stable and reproducible on the batch of three cells.
Cycling performance after CC formation is therefore non-reproducible and unstable, whereas those after CV formation are stable and reproducible with energy densities up to 14 W h kgelectrochemical core−1. To understand these differences in cycling performance depending on the formation protocol applied, a study of degradation phenomena within KIC cells has been carried out. As shown in a previous study, the use of a reference electrode within KIC cells demonstrated that the negative graphite electrode operates at a potential close to the electrolyte decomposition limit during the formation step.8 In addition, the positive electrode is a commercial electrode used in EDLC. We therefore focused our attention on the characterization of the negative electrode, and more particularly on the passivation layer formed on its surface.
3.2. SEI appearance
First, STEM analyses were performed to determine the appearance of the passivation layer. Fig. 2 presents the EELS (electron energy-loss spectroscopy) images and the potassium mapping of a graphite powder after CC formation (a and b) and after CV formation (c and d).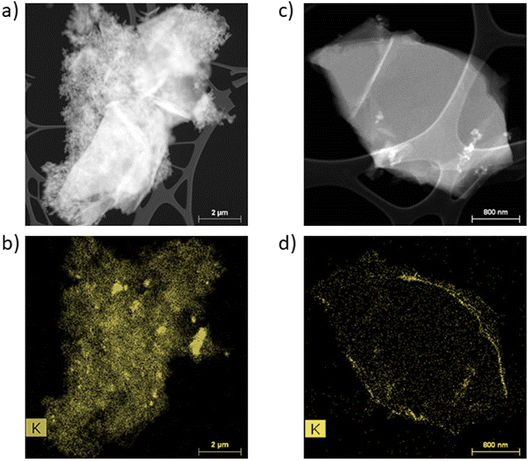 | ||
| Fig. 2 STEM-EELS analyses of graphite powder and potassium mapping after CC formation (a and b) and after CV formation (c and d). | ||
In Fig. 2a and c, it is possible to distinguish the graphite particles of several micrometers from the conductive additive particles in the order of a hundred nanometers. The potassium mapping after CC formation (Fig. 2b) shows the presence of potassium over the entire particle's surface. In addition, agglomerates are observed and the SEI seems to be rather localized on the Super P. The potassium mapping after CV formation shows a thin layer of potassium on the surface of the particle.
These STEM analyses show a discontinuous and inhomogeneous SEI after CC formation, whereas a homogeneous and continuous SEI is formed after CV formation.
3.3. SEI composition after formation
Thanks to STEM images, the appearance of the SEI could be observed. To know the composition of this passivation layer, XPS analyses were then carried out. First, survey spectra were recorded for a pristine graphite electrode, a graphite electrode after CC formation and one after CV formation in order to check the overall surface chemistry of the electrode. The spectra obtained are presented in Fig. 3.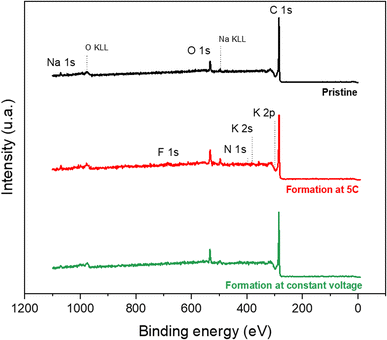 | ||
| Fig. 3 XPS survey spectra of a pristine graphite electrode (in black) and a graphite electrode after CC formation (in red) and after CV formation (in green). | ||
For the pristine electrode, the contributions of the C 1s, O 1s and Na 1s peaks are observed, which correspond to the constituent elements of the electrode (graphite, Na-CMC, and SBR). For the electrodes after formation, the appearance of weak contributions of the F 1s, N 1s, K 2s and K 2p peaks is observed. These contributions highlight the reaction between the electrolyte (acetonitrile and KPF6) and the graphite electrode. The fact that the spectrum is only slightly modified after formation indicates that the SEI layer is thin (probably less than 5 nm); however, it does exist.
In order to compare the composition of the SEI after both formations, high energy resolution spectra have been recorded and are presented below. We made the choice to condition the attribution of the peaks observed on the basis of the first studies of the SEI in K-ion systems10,20,21 and also by taking inspiration from what is generally observed in the case of Li-ion batteries.15
Fig. 4 presents high energy resolution spectra of the C 1s, K 2p, F 1s, P 2p and O 1s orbitals obtained for a graphite electrode after CC formation and after CV formation, respectively.
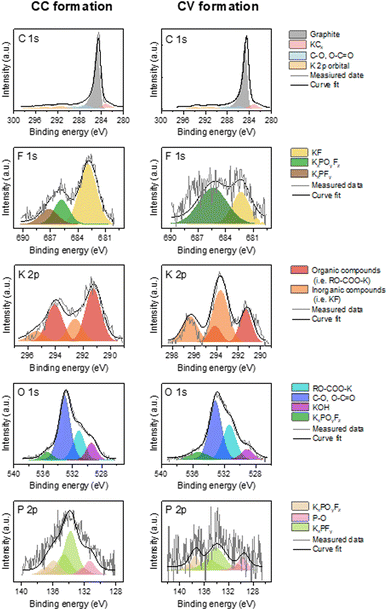 | ||
| Fig. 4 High-resolution C 1s K 2p, F 1s, K 2p, O 1s and P 2p XPS spectra obtained on the graphite electrode surface after CC formation and CV formation. | ||
The spectrum of the C 1s orbital has one intense peak and three weaker peaks. Moreover, since the spectra of the C 1s and K 2p orbitals overlapped, two additional weak peaks are observed. The spectrum of the C 1s orbital presents a low energy peak (282.5 eV) corresponding to intercalated potassium in graphite (KCx),13 a very intense asymmetric peak centered at 284.5 eV characteristic of graphite and a conductive additive present in the negative electrode. The analyses are carried out in the discharged state, so it should no longer have intercalated potassium. However, the observation of this low energy peak may indicate the presence of K+ ions trapped within the graphite. Moreover, the low intensity peaks between 285 and 290 eV are contributions indicating the presence of carbon atoms bonded to oxygen atoms related to the use of CMC. Weak peaks at higher binding energies (>290 eV) are attributed to K 2p3/2 and K 2p1/2 that highlight the decomposition of the KPF6 salt at the graphite electrode surface.22
The spectrum of the K 2p orbital presents two doublets with a main peak at 291 eV for the first one and at 292.5 eV for the other one. Both doublets can be attributed to carbon-free compounds, called “inorganic” compounds on the one hand and, carbon-containing compounds, called “organic” compounds on the other hand.23 Inorganic compounds include salt degradation products, mainly potassium fluoride (KF). The organic compounds include the degradation products obtained from the reaction between potassium and the other components of the system, (in particular the binder and the electrolyte solvent) such as RO-COO-K10 and also the residual KCx intercalation compounds.
The F 1s spectrum shows an intense peak at 683 eV and two weaker peaks at 685.5 and 687.5 eV. The low energy contribution is attributed to KF, as specified above, while the other two higher energy peaks are related to the presence of the KPF6 salt or KxPOyFz derived compounds.24
The spectrum of the P 2p orbital presents three doublets with main peaks at 131, 133, and 136 eV respectively. The two higher energy doublets are related to the presence of KPF6 salt or KxPOyFz derived compounds25 as observed in the F 1s orbital spectrum. The last lower energy contribution for the P 2p orbital could be attributed to polyphosphates.26 The origin of this compound in our system remains to be determined, though it could be related to the reaction of the electrolyte salt with the CMC of the electrode.
The spectrum of the O 1s orbital shows four peaks at 529, 531, 533 and 555.5 eV, respectively. The first is attributed to the inorganic compound KOH and the second (at 530.9 eV) to a K-based organic compound.21 The higher energy peaks are attributed on the one hand to the CMC used as the electrode binder, and on the other hand to the compounds derived from the electrolyte salt.
The contributions are similar after each formation. The main difference is the low intensity of the F 1s and P 2p spectra after CV formation. The contribution associated with KF is notably much less intense. Moreover, the spectrum of the K 2p orbital presents a larger inorganic contribution than the organic one after CC formation, while the opposite is observed after CV formation.
To evaluate the main components of the SEI, an elemental quantification allowing the relative proportions of the chemical elements detected to be known was carried out. The results obtained for a pristine electrode, one after CC training and one after CV training, are presented in Table 1.
| Step | Element | |||||
|---|---|---|---|---|---|---|
| C | O | Na | K | F | P | |
| Pristine | 92.2% | 6.7% | 1.1% | n/a | n/a | n/a |
| CC formation | 87.9% | 7.2% | 1.2% | 2.2% | 1.2% | 0.3% |
| CV formation | 92.7% | 5.0% | 1.1% | 0.6% | 0.5% | 0.1% |
The pristine graphite electrode contains mainly carbon, which is in agreement with the 87% of active materials present in the electrode. Sodium and oxygen are obtained from the binders (Na-CMC and SBR). After each formation, the basic elements of the electrode (C, O, and Na) account for more than 95% of the detected elements which confirms that the SEI formed is quite thin. Potassium, fluorine and phosphorus are the other elements detected. The SEI formed on the surface of the graphite electrode after each formation is therefore mainly composed of the degradation products of the electrolyte salt. This elementary quantification does not highlight any differences between the SEIs after each formation.
In the spectra, the main differences are observed in the F 1s and K 2p spectra, in particular for the contribution linked to the F–K bond. Moreover, as detailed in ref. 23, a higher content of KF leads to a significant increase in the resistance of the SEI while a low quantity of the same compound favors a stable behavior during cycling. Therefore, particular attention has been paid to the KF content of the SEI after each formation on KIC cells. The percentage of KF, based on the quantification of the spectrum of the F 1s orbital, is shown in Table 2.
| Formation | KF content |
|---|---|
| CC formation | 61.9% |
| CV formation | 33.5% |
The KF content of the SEI after CC formation is almost twice as high as that after CV formation.
The main difference in the composition of the SEI after each formation is therefore the KF content. A SEI with a higher KF content can impede good ion conduction and induce lower energy densities. Besides, a lower quantity of KF allows a stable behavior to be obtained during cycling. Following the evolution of the SEI during cycling could therefore help to understand the differences observed according to the formation protocol applied.
3.4. SEI evolution over the cycling test
The characterization carried out on the graphite electrode after the formation protocols led to the conclusion that the main differences depending on the formation protocol applied are the homogeneity and the KF content of the SEI. As described previously, the results are unstable and non-reproducible after CC formation, whereas the reproducibility and stability of performance after CV formation are remarkable. The study of the evolution of the SEI during cycling could then make it possible to explain differences observed in cycling performance.To carry out this ageing study, three characteristic points of cycling performance were defined to carry out the analyses, to which is added the point after the formation protocol whose results were presented previously. Fig. 5 presents the cycling performance for a batch of three cells after each formation protocol where the analysis points are identified.
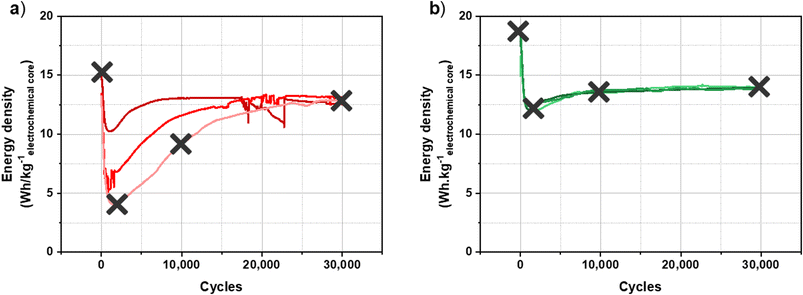 | ||
| Fig. 5 Long-term cycling of a hybrid KIC in 0.8 mol L−1 KPF6 AN at 16 mA cm−2 between 0.5 and 3.5 V at room temperature in the pouch cell configuration after CC formation (a) and after CV formation (b).8 | ||
The XPS analyses are therefore carried out on graphite electrodes after 2000 cycles, 10![[thin space (1/6-em)]](https://www.rsc.org/images/entities/char_2009.gif) 000 cycles and 30
000 cycles and 30![[thin space (1/6-em)]](https://www.rsc.org/images/entities/char_2009.gif) 000 cycles at 16 mA cm−2.
000 cycles at 16 mA cm−2.
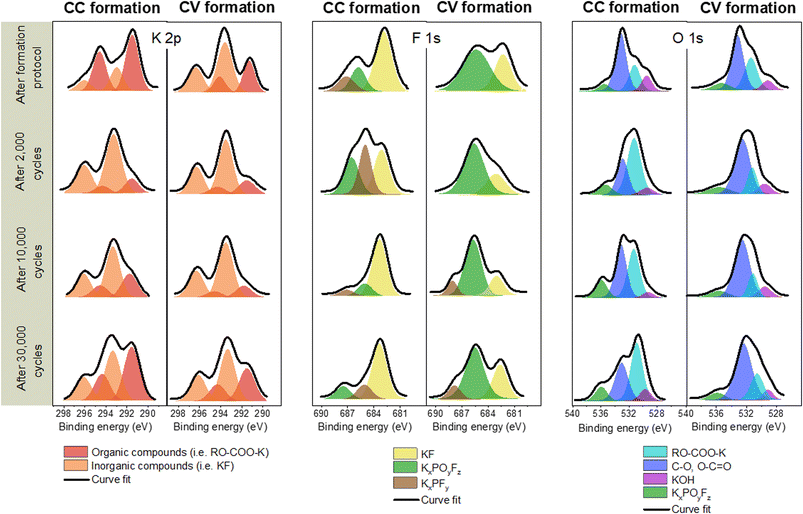
Fig. 6 presents the evolution of the contributions for the K 2p, F 1s and O 1s orbitals at the different cycling points for graphite electrodes that have undergone CC formation and CV formation, respectively.
For the K 2p orbital, a strong doublet associated with inorganic K is observed after CC formation which decreases sharply after 2000 cycles, whereas the opposite behavior is observed for the contribution of organic K. The spectra still evolve after 10![[thin space (1/6-em)]](https://www.rsc.org/images/entities/char_2009.gif) 000 and 30
000 and 30![[thin space (1/6-em)]](https://www.rsc.org/images/entities/char_2009.gif) 000 cycles and the two contributions reach equivalent intensities after this last cycling step. After CV formation, the doublet associated with organic compounds remains intense during cycling. The intensity of the doublet bound to inorganic compounds varies with a decrease after 2000 cycles and then an increase after 30
000 cycles and the two contributions reach equivalent intensities after this last cycling step. After CV formation, the doublet associated with organic compounds remains intense during cycling. The intensity of the doublet bound to inorganic compounds varies with a decrease after 2000 cycles and then an increase after 30![[thin space (1/6-em)]](https://www.rsc.org/images/entities/char_2009.gif) 000 cycles.
000 cycles.
For the F 1s orbital, a decrease in the KF contribution is observed after 2000 cycles while the contributions of the KPF6 salt or the KxPOyFz degradation compounds increase. An intense contribution of KF is observed after 10![[thin space (1/6-em)]](https://www.rsc.org/images/entities/char_2009.gif) 000 cycles, which seems stable thereafter. This evolution therefore is related to the one observed for the doublet associated with inorganic K on the K 2p orbital spectrum. After CV formation, the intensity of the contributions increases after 2000 cycles. Moreover, the evolution of the signal intensity indicates an increase in the fluorine content. In addition, a contribution associated with the electrolyte salt appears after 10
000 cycles, which seems stable thereafter. This evolution therefore is related to the one observed for the doublet associated with inorganic K on the K 2p orbital spectrum. After CV formation, the intensity of the contributions increases after 2000 cycles. Moreover, the evolution of the signal intensity indicates an increase in the fluorine content. In addition, a contribution associated with the electrolyte salt appears after 10![[thin space (1/6-em)]](https://www.rsc.org/images/entities/char_2009.gif) 000 cycles.
000 cycles.
The most significant change observed in the O 1s spectrum is the evolution of the peak attributed to K-based organic compounds (i.e. RO-COO-K). Indeed, after formation, a less intense peak is observed before increasing after 2000 cycles. This contribution then fades after 10![[thin space (1/6-em)]](https://www.rsc.org/images/entities/char_2009.gif) 000 cycles and stabilizes. This evolution is similar to those observed for the doublet associated with K-based organic compounds in the K 2p orbital spectrum. The O 1s contributions remain stable during cycling after CV formation.
000 cycles and stabilizes. This evolution is similar to those observed for the doublet associated with K-based organic compounds in the K 2p orbital spectrum. The O 1s contributions remain stable during cycling after CV formation.
The evolution of the contributions observed for the orbitals K 2p, F 1s and O 1s shows that the SEI after CC formation is rich in inorganic compounds while it is enriched in organic compounds after 2000 cycles. The presence of inorganic compounds increases once again after 10![[thin space (1/6-em)]](https://www.rsc.org/images/entities/char_2009.gif) 000 cycles and a strongly inorganic SEI is detected again after 30
000 cycles and a strongly inorganic SEI is detected again after 30![[thin space (1/6-em)]](https://www.rsc.org/images/entities/char_2009.gif) 000 cycles. The SEI after CC formation is therefore unstable over time. The contributions of each orbital after CV formation are relatively stable at each cycling step. The stability of the SEI after CV formation is therefore improved.
000 cycles. The SEI after CC formation is therefore unstable over time. The contributions of each orbital after CV formation are relatively stable at each cycling step. The stability of the SEI after CV formation is therefore improved.
In the case of K-ion batteries (KIBs), it has been shown that the stability of the SEI formed at the surface of the negative electrode is a key factor for cycling stability.27 The difference in stability of the SEI according to the formation protocol applied could therefore help to explain the very different cycling performances. Moreover, in lithium-ion batteries, lithium fluoride (LiF) is known for its protective function for the electrode within the SEI12 and it has been shown that the KF content has a strong impact on the performance of KIBs,23 as detailed previously.
The KF content of the SEI in the KIC system has therefore been studied in order to determine whether KF could provide a similar protective function as LiF. For this, the percentage of KF is estimated, as previously described, for each cycling step. Fig. 7 shows the evolution of KF content after CC formation and after CV formation.
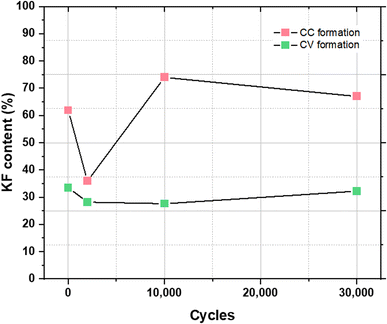 | ||
| Fig. 7 Evolution of KF content in the SEI for each cycling step after CC formation (in red) and after CV formation (in green). | ||
For electrodes that have undergone CC formation, KF content significantly evolves between the formation step and the cycling step for 2000 cycles, going from 62% to 36%. After 10![[thin space (1/6-em)]](https://www.rsc.org/images/entities/char_2009.gif) 000 cycles, the KF content increases to 74% before stabilizing. For electrodes that have undergone CV formation, a decrease in the KF content is first observed after 2000 cycles, going from 33.5 to 28.5%. It then increases slightly to reach 32.2% after 30
000 cycles, the KF content increases to 74% before stabilizing. For electrodes that have undergone CV formation, a decrease in the KF content is first observed after 2000 cycles, going from 33.5 to 28.5%. It then increases slightly to reach 32.2% after 30![[thin space (1/6-em)]](https://www.rsc.org/images/entities/char_2009.gif) 000 cycles. With values between 27.5 and 33.5% during cycling, the KF content is relatively stable.
000 cycles. With values between 27.5 and 33.5% during cycling, the KF content is relatively stable.
After CC formation, KF content is high and variable whereas it’s low and stable after CV formation. As observed previously with STEM images, the SEI covering after CC formation is inhomogeneous. It can then be assumed that the application of a high charging current (16 mA cm−2) in cycling leads to the dissolution of part of the SEI which results in a significant decrease in the KF content. Following this, the graphite electrode would no longer be sufficiently protected and the decomposition of the electrolyte again leads to the formation of KF, which allows the recovery and stabilization of performance. On the other hand, the homogeneity and the stable KF content of the SEI formed after CV formation would protect the electrode from future electrolyte decomposition reactions resulting in a more stable SEI over time.
To assess these assumptions, the relationship between the KF content of the SEI and the cycling performance has been studied. Fig. 8 shows the evolution of KF content for each cycling step and the cycling performance of a KIC cell after CC formation and CV formation, respectively. For the readability of the figure, only the performance of a single cell is presented.
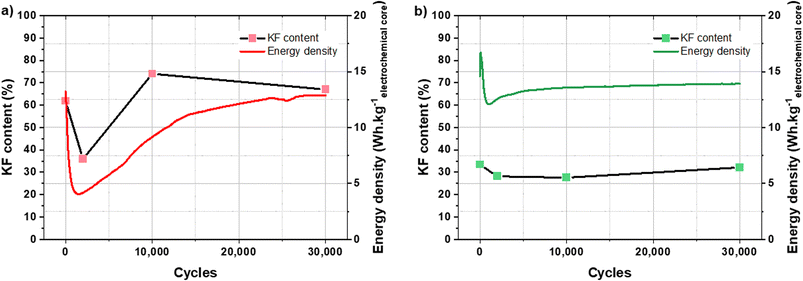 | ||
| Fig. 8 Evolution of KF content in the SEI and energy density of a KIC cell during cycling at 16 mA cm−2 at room temperature after CC formation (a) and after CV formation (b). | ||
After CC formation, the decrease in KF content is associated with the drop in performance during the first thousand cycles. The increase in performance then corresponds to the increase in the KF content. Stabilization is then observed in both cases, KF content and energy density. After CV formation, the energy density of the cell increases at the beginning of cycling and then sharply decreases. The KF content is then relatively stable, as is the cycling performance (after a slight increase).
The evolutions of the KF content of the SEI and the energy densities of the KIC cells during cycling can therefore be correlated after CC formation. Besides, the performance drop over the first thousand cycles after CV formation is not correlated with a significant decrease in the KF content of the SEI. However, the stability of this KF content with an average value of 30% during cycling may explain the stable performance obtained after CV formation. For an equivalent value after CC formation (30% KF in the SEI), very low energy densities were observed (4 W h kgelectrochemical core−1). The KF content of the SEI therefore does not fully explain the cycling performance after CV formation. However, the improvement of the stability of the SEI and that of the performance are clearly correlated.
In conclusion, the follow-up by a thorough XPS analysis has shown that the instability of cycling performance after CC formation is related to an unstable SEI over time with high and variable KF content. Moreover, the formation of a more stable SEI over time can explain the stable and reproducible results obtained after CV formation.
4. Conclusions and perspectives
The objective of this study was to analyse the SEI layer formed at the graphite electrode surface of a non-aqueous potassium-ion hybrid supercapacitor and to understand its relationship with the formation protocol applied and with the resulting cycling performance. Scanning transmission electron microscopy was used in parallel with X-ray photoelectron spectrometry to determine the appearance and composition of the solid electrolyte interface (SEI) after each formation protocol. XPS analysis was then utilized to study the evolution of the SEI during cycling.The CC formation gives rise to the creation of a thin and discontinuous SEI, mainly composed of degradation products of the electrolyte salt, in particular potassium fluoride. The follow-up of the evolution of the SEI during cycling then showed that the SEI is unstable over time with a high and variable KF content. Moreover, the evolution of the potassium fluoride content of the SEI is correlated with the evolution of the energy densities of the KIC cells.
The analyses carried out on the graphite electrode after CV formation allowed us to conclude that the application of such a formation protocol leads to the formation of a thin, homogeneous and more stable SEI. In addition, the SEI layer contains only small quantities of KF. These differences compared to what was observed after CC formation explain the stable and reproducible results obtained in cycling after the formation at constant voltage.
However, unlike CC formation, the KF content does not allow the behavior observed during cycling in the case of CV formation to be fully understood. It would therefore be interesting to study other compounds of the SEI to refine the understanding of the KIC system operation studied in this work. For example, the higher content of degradation compounds derived from the electrolyte salt (KxPOyFz) or the stability of the contributions associated with organic and inorganic potassium-based compounds could be studied. Moreover, it would be interesting to study the diffusion of K+ ions within the SEI formed in this KIC system.
Conflicts of interest
There are no conflicts to declare.Acknowledgements
This work was supported by a joint doctoral fellowship from the French Atomic Energy and Alternative Energy Agency (CEA) and the Direction Générale de l’Armement (DGA).References
- M. R. Lukatskaya, et al., Multidimensional materials and device architectures for future hybrid energy storage, Nat. Commun., 2016, 7, 12647, DOI:10.1038/ncomms12647.
- D. P. Dubal, et al., Hybrid energy storage: the merging of battery and supercapacitor chemistries, Chem. Soc. Rev., 2015, 44, 1777–1790, 10.1039/C4CS00266K.
- C. Han, et al., Recent Progress on Two-Dimensional Carbon Materials for Emerging Post-Lithium (Na+, K+, Zn2+) Hybrid Supercapacitors, Polymers, 2021, 13, 2137, DOI:10.3390/polym13132137.
- J. Yuan, et al., Recent progress in sodium/potassium hybrid capacitors, Chem. Commun., 2020, 56, 13933–13949, 10.1039/D0CC05476C.
- R. Rajagopalan, et al., Advancements and Challenges in Potassium Ion Batteries: A Comprehensive Review, Adv. Funct. Mater., 2020, 30, 1909486, DOI:10.1002/adfm.201909486.
- M. Liu, et al., Emerging Potassium-ion Hybrid Capacitors, ChemSusChem, 2020, 13, 5837–5862, DOI:10.1002/cssc.202000578.
- A. Le Comte, et al., First prototypes of hybrid potassium-ion capacitor (KIC): an innovative, cost-effective energy storage technology for transportation applications, J. Power Sources, 2017, 363, 34–43, DOI:10.1016/j.jpowsour.2017.07.005.
- M.-E. Yvenat, et al., Development of an Adequate Formation Protocol for a Non-Aqueous Potassium-Ion Hybrid Supercapacitor (KIC) through the Study of the Cell Swelling Phenomenon, Batteries, 2022, 8, 135, DOI:10.3390/batteries8100135.
- E. Peled, The Electrochemical Behavior of Alkali and Alkaline Earth Metals in Nonaqueous Battery Systems—The Solid Electrolyte Interphase Model, J. Electrochem. Soc., 1979, 126, 2047, DOI:10.1149/1.2128859.
- F. Allgayer, et al., Comparing the Solid Electrolyte Interphases on Graphite Electrodes in K and Li Half Cells, ACS Appl. Energy Mater., 2022, 5, 1136–1148, DOI:10.1021/acsaem.1c03491.
- Y. Han, et al., Interphases in the electrodes of potassium ion batteries, JPhys Mater., 2022, 5, 022001, DOI:10.1088/2515-7639/ac5dce.
- S. Chhor, Etude et modélisation de l’interface graphite/électrolyte dans les batteries lithium-ion, PhD manuscript, Université de Grenoble, 2014.
- A. J. Naylor, et al., Interfacial Reaction Mechanisms on Graphite Anodes for K-Ion Batteries, ACS Appl. Mater. Interfaces, 2019, 11, 45636–45645, DOI:10.1021/acsami.9b15453.
- Q. L. Liu, A. M. R. Rao, X. H. Han and B. L. Lu, Artificial SEI for Superhigh-Performance K-Graphite Anode, Adv. Sci., 2021, 8, 2003639, DOI:10.1002/advs.202003639.
- P. Verma, et al., A review of the features and analyses of the solid electrolyte interphase in Li-ion batteries, Electrochim. Acta, 2010, 55, 6332–6341, DOI:10.1016/j.electacta.2010.05.072.
- Y. Yamada, et al., Unusual stability of acetonitrile-based superconcentrated electrolytes for fast-charging lithium-ion batteries, J. Am. Chem. Soc., 2014, 136, 5039–5046, DOI:10.1021/ja412807w.
- A. Lahiri, et al., Influence of Polar Organic Solvents in an Ionic Liquid Containing Lithium Bis(fluorosulfonyl)amide: Effect on the Cation–Anion Interaction, Lithium Ion Battery Performance, and Solid Electrolyte Interphase, ACS Appl. Mater. Interfaces, 2016, 8, 34143–34150, DOI:10.1021/acsami.6b12751.
- W. Pell, et al., Peculiarities and requirements of asymmetric capacitor devices based on combination of capacitor and battery-type electrodes, J. Power Sources, 2004, 136, 334–345, DOI:10.1016/j.jpowsour.2004.03.021.
- Y. Li, et al., Intercalation chemistry of graphite: alkali metal ions and beyond, Chem. Soc. Rev., 2019, 48, 4655–4687, 10.1039/C9CS00162J.
- H. Wang, et al., Solid electrolyte interphase (SEI) in potassium ion batteries, Energy Environ. Sci., 2020, 13, 4583–4608, 10.1039/D0EE01638A.
- L. Caracciolo, et al., XPS Analysis of K-based Reference Compounds to Allow Reliable Studies of Solid Electrolyte Interphase in K-ion Batteries, ACS Appl. Energy Mater., 2021, 4, 11693–11699, DOI:10.1021/acsaem.1c02400.
- Z.-G. Wu, et al., Synthesis of a novel tunnel Na0.5K0.1MnO2 composite as a cathode for sodium ion batteries, RSC Adv., 2016, 6, 54404–54409, 10.1039/C6RA09707C.
- S. U. Yoon, et al., Effects of fluoroethylene carbonate-induced solid-electrolyte-interface layers on carbon-based anode materials for potassium ion batteries, Appl. Surf. Sci., 2021, 547, 149193, DOI:10.1016/j.apsusc.2021.149193.
- R. Tatara, et al., The Effect of Electrode-Electrolyte Interface on the Electrochemical Impedance Spectra for Positive Electrode in Li-Ion Battery, J. Electrochem. Soc., 2018, 166, A5090, DOI:10.1149/2.0121903jes.
- H. D. Asfaw, et al., A polymeric cathode-electrolyte interface enhances the performance of MoS2-graphite potassium dual-ion intercalation battery, Cell Rep. Phys. Sci., 2022, 3, 100693, DOI:10.1016/j.xcrp.2021.100693.
- K. Crompton, Delayed Rapid Anode Potential Decrease During Fixed Resistive Load Overdischarge of LiFePO 4/Graphite Lithium-Ion Cells, J. Electrochem. Soc., 2020, 167 DOI:10.1149/1945-7111/ab8730.
- F. Yuan, et al., Key Factor Determining the Cyclic Stability of the Graphite Anode in Potassium-Ion Batteries, ACS Nano, 2022, 16, 12511–12519, DOI:10.1021/acsnano.2c03955.
| This journal is © The Royal Society of Chemistry 2023 |

