Topotactic reduction of oxide nanomaterials: unique structure and electronic properties of reduced TiO2 nanoparticles†
Satoshi
Tominaka
*ab,
Hideki
Yoshikawa
c,
Yoshitaka
Matsushita
d and
Anthony K.
Cheetham
*b
aInternational Center for Materials Nanoarchitectonics (WPI-MANA), National Institute for Materials Science (NIMS), Namiki 1-1, Tsukuba, Ibaraki 305-0044, Japan. E-mail: TOMINAKA.Satoshi@nims.go.jp
bDepartment of Materials Science and Metallurgy, University of Cambridge, Pembroke Street, Cambridge CB2 3QZ, UK. E-mail: akc30@cam.ac.uk
cSurface Chemical Analysis Group, Nano Characterization Unit, Advanced Key Technologies Division, NIMS, Sengen 1-2-1, Tsukuba, Ibaraki 305-0047, Japan
dMaterials Analysis Station, NIMS, Sengen 1-2-1, Tsukuba, Ibaraki 305-0047, Japan
First published on 7th October 2013
Abstract
Reduced titanium oxide nanomaterials are of great scientific and industrial interest. Herein we analyze corundum-like titanium oxide nanomaterials synthesized by topotactic reduction of TiO2 nanoparticles. The structure is probed using X-ray pair distribution functions, and the electronic properties are examined using hard X-ray photoelectron spectroscopy and electron energy loss spectroscopy. Topotactically reduced nanoparticles have a composition, TiO1.83, that is oxygen rich compared with that of (100)-oriented single crystals reduced under the same conditions (TiO1.48); the latter, however, have unique electronic properties compared with typical Ti2O3. The structure of TiO1.83 was found to contain both the unique Ti2O3 and Ti4O7, and the conductivity was lower than the single crystal-derived materials due to interparticle resistance. The findings confirm that topotactic reactions can create nanomaterials having unique structures and properties that cannot be realized in bulk materials.
Introduction
The development of advanced nanomaterials is necessary for achieving breakthroughs in batteries, fuel cells, photovoltaics and other areas. Post-synthetic treatments of nanoparticles offer a useful strategy for enhancing materials' properties, as long as the nanostructures are retained during the processing. The resulting materials, however, may be inhomogeneous because the reactions often proceed under kinetically controlled conditions. Since very little is known about the impact of post-synthetic treatments on microstructure, we address this issue herein by examining the low temperature reduction of TiO2 nanomaterials as a case study.Reduced titanium oxides (e.g., TiO and Ti2O3) are useful in photovoltaics,1,2 fuel cells,3–5 memory media,6 cosmetics etc. on account of their electronic conductivity and visible light absorption. In addition, titanium dioxide has economic advantages, is environmental friendly and chemical stable. Mild reduction treatments of bulk rutile TiO2 results in a bluish, n-type semiconductor, which has a gap state localised at ∼2 eV above the valence band maximum.3,7–9 This is formed by Ti3+ species associated with oxygen deficiency, interstitial Ti species, or OH formation.7 Under stronger reducing conditions, rutile TiO2 forms the homologous series, TinO2n−1 (e.g., Ti5O9 and Ti4O7), which contains ordered oxygen deficient sites as crystallographic shear planes. This reduction proceeds topotactically.‡
In terms of materials' properties, the topotactically synthesized, single crystalline corundum Ti2O3 phase exhibits an excellent electronic conductivity (resistance < 6 μΩ m), even at extremely low temperatures.10 However, when the same treatment is applied to nanoparticles of rutile TiO2, they do not show such good conductivity, even though the product appears to have the same crystal structure (XRD analyses, Fig. S12†). Moreover, the apparent conductivity is not reproducible because it strongly depends on the conditions of the pellets, as is often reported for reduced titanium oxide particles.4 Such discrepancies in physical properties between single crystalline and powder samples are widely recognized, but the underlying cause is not understood. We use X-ray pair distribution functions (PDFs),11,12 which take into account the diffuse scattering as well as Bragg peaks, in order to probe both the crystalline and amorphous phases in topotactically reduced TiO2 nanoparticles. We also use hard X-ray photoelectron spectroscopy (HX-PES) with synchrotron radiation and electron energy loss spectroscopy (EELS) to study the electronic structure.
Results and discussion
Single crystal and nanoparticles samples of rutile TiO2 were reduced at 350 °C, as described in the Methods section. The rice-shaped morphology of the nanoparticles was retained during the reduction treatment, confirmed from the scanning electron microscope images shown in Fig. 1a. The resulting products, referred to as TiOx-SC and TiOx-NP, respectively, were studied by X-ray total scattering and the results were compared with both the nanocrystalline TiO2 starting material and a commercial sample of bulk Ti2O3. TiOx-SC has a 200 nm thick reduced layer on the surface of 0.5 mm thick rutile crystal with a clear boundary between them,10 and the Ti–O ratio of the surface layer was determined to be 0.675 by HX-PES (that of the commercially available Ti2O3 particles is 0.674), confirming the formation of stoichiometric Ti2O3.10 On the other hand, that of TiOx-NP was found to be 0.547 by both thermogravimetric analysis and HX-PES (this is equivalent to TiO1.83). This result suggests that TiOx-NP has a substantial (18%) deficiency of Ti in the corundum structure, unless other phases are present.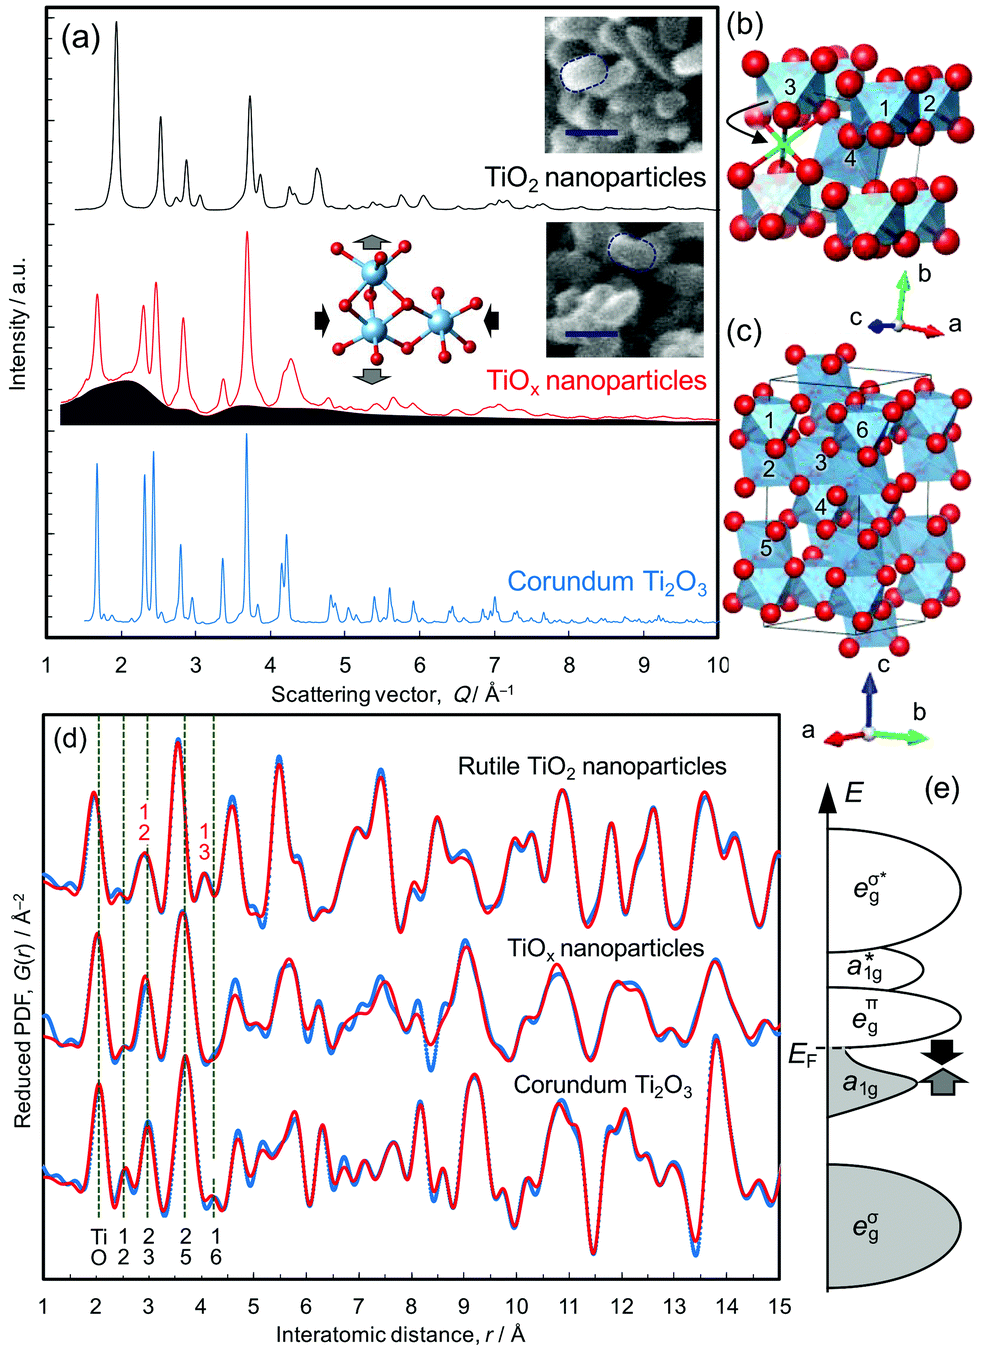 | ||
| Fig. 1 Atomic structure analysis using pair distribution functions (PDFs). Rutile TiO2 nanoparticles, their reduced product (TiOx) and corundum Ti2O3 particles are compared. (a) X-ray total scattering patterns. The blue region represents diffuse scattering intensity from reduced nanoparticles. The inset scanning electron microscope images show that the morphology was retained during the reduction treatment (scale bar: 30 nm). The inset structural image illustrates the lattice strains determined by the analyses. (b) Rutile TiO2 structure. During the reduction, Ti atoms move into vacant sites and form face-sharing TiO6 octahedra (green site). (c) Corundum Ti2O3 structure. (d) X-ray PDFs. The experimental plots (blue dots) up to 30 Å are compared with calculated plots (red lines). The PDF of the TiOx sample was fitted with a mixture of the corundum structure and Ti4O7. The green dotted lines show the representative Ti–Ti distance of corundum Ti2O3. The numbers show Ti atoms defined in panel ‘c’. (e) Schematic energy bands for Ti2O3. eg bands and a nonbonding t2g band, which splits into Ti–Ti bonding a1g bands and a nonbonding eπg band. | ||
The X-ray total scattering patterns (Fig. 1a) show that TiOx-NP exhibits broad diffuse scattering intensity underneath Bragg peaks that are assignable to the corundum structure; this indicates the presence of an amorphous and/or nanocrystalline phase as well as the crystalline corundum phase. Since the PDF of TiOx-NP does not decay beyond the nearest neighbour peaks located within 4 Å (Fig. 1d), the additional phase is not amorphous, but nanocrystalline. In addition, we observe that amorphous phases can be formed by using a higher reduction temperature of >390 °C (Fig. S3†).
This presence of an additional nanocrystalline phase is not unreasonable, considering the fact that the reduction of (100)-oriented TiO2 results in a single-crystalline corundum phase, while the reduction of (110)-oriented TiO2 results in polycrystalline Ti2O3 domains surrounded by Ti4O7.10 This is because the crystallographically equivalent directions of [100]R and [010]R are geometrically non-equivalent in (100)-oriented TiO2, which results in unique crystal orientation relationships of [100]R||[110]C, [010]R||[001]C, and [001]R||[1![[1 with combining macron]](https://www.rsc.org/images/entities/char_0031_0304.gif) 0]C, while (110)-oriented TiO2, whose [100]R and [010]R are geometrically equivalent as well, becomes polycrystalline.10 (An “R” subscript is used for rutile, and “C” is used for corundum). According to the previous investigations,13 nanoparticles kept single crystalline domains, thus we consider that the inhomogeneous contact between TiO2 particles and CaH2 powder formed Ti2O3 nanoparticles and less-reduced nanoparticles as the additional phase, taking also the composition into consideration.
0]C, while (110)-oriented TiO2, whose [100]R and [010]R are geometrically equivalent as well, becomes polycrystalline.10 (An “R” subscript is used for rutile, and “C” is used for corundum). According to the previous investigations,13 nanoparticles kept single crystalline domains, thus we consider that the inhomogeneous contact between TiO2 particles and CaH2 powder formed Ti2O3 nanoparticles and less-reduced nanoparticles as the additional phase, taking also the composition into consideration.
The structures of the TiO2 nanoparticles and the Ti2O3 sample were refined well using the PDFs (Fig. 1d, S6 and S9†), but that of TiOx-NP could not be fitted with Ti2O3 alone (Fig. S13†). For example, the peak assignable to the Ti–Ti distance between face-sharing octahedra in Ti2O3 (∼2.5 Å, Ti1–Ti2 in Fig. 1c) is smaller than those of Ti2O3. The PDF can be fitted reasonably well up to 10 Å with a model based upon a mixture of Ti2O3 and TiO2 (Fig. S13†), but the fit is unacceptable in the longer distance region. Accordingly, the PDF pattern was then analyzed on the basis of a mixture of corundum Ti2O3 plus an oxygen-rich intermediate phase belonging to the homologous series TinO2n−1.10 The best fitting was achieved on the basis of a mixture of Ti2O3 and Ti4O7 (Rw = 23.5%) as shown in Fig. 1d. Considering the composition (TiO1.83, which is richer in oxygen than Ti2O3 and Ti4O7) and the difference between 4 and 9 Å (Fig. 1d), TiOx-NP probably contains a small amount of an oxygen-richer phase as well; for example, the Ti2O3 phase may be Ti deficient as indicated by the Rietveld refinements (cf. Fig. S12†).
The lattice constants of the Ti2O3 phase present in TiOx-NP were determined to be a = 5.09391 Å and c = 13.7947 Å, which is highly compressed in the ab plane and expanded along the c axis (as illustrated in Fig. 1a) compared with a typical Ti2O3 (a = 5.15858 Å, and c = 13.6419 Å, refined by PDF, Fig. S6†). According to the Goodenough model,14 Ti2O3 becomes metallic at high temperatures with an increase in the c/a ratio,15 which closes the semiconductor gap between the a1g band and the eπg band (Fig. 1e). The former band is formed between the face-sharing Ti–Ti dimers along the c axis, and the latter is formed between the edge-sharing octahedra in the ab plane.16–19 The Ti–O bonds of the corundum phase in TiOx-NP are shorter (peak at 2.02 Å) than in Ti2O3 (2.05 Å), as shown in Fig. S18.† This is consistent with the EELS O K-edge (Fig. 2d) in the high energy region (>535 eV): the peaks of TiOx-NP and TiOx-SC are shifted towards higher energies than in Ti2O3, suggesting stronger Ti–O bonding of TiOx-NP and TiOx-SC compared with Ti2O3.20 Thus, the Ti2O3 phase in TiOx-NP is considered to be metallic like the single crystal sample, TiOx-SC. This view is also supported by the identical optical absorption features (Fig. S23†).
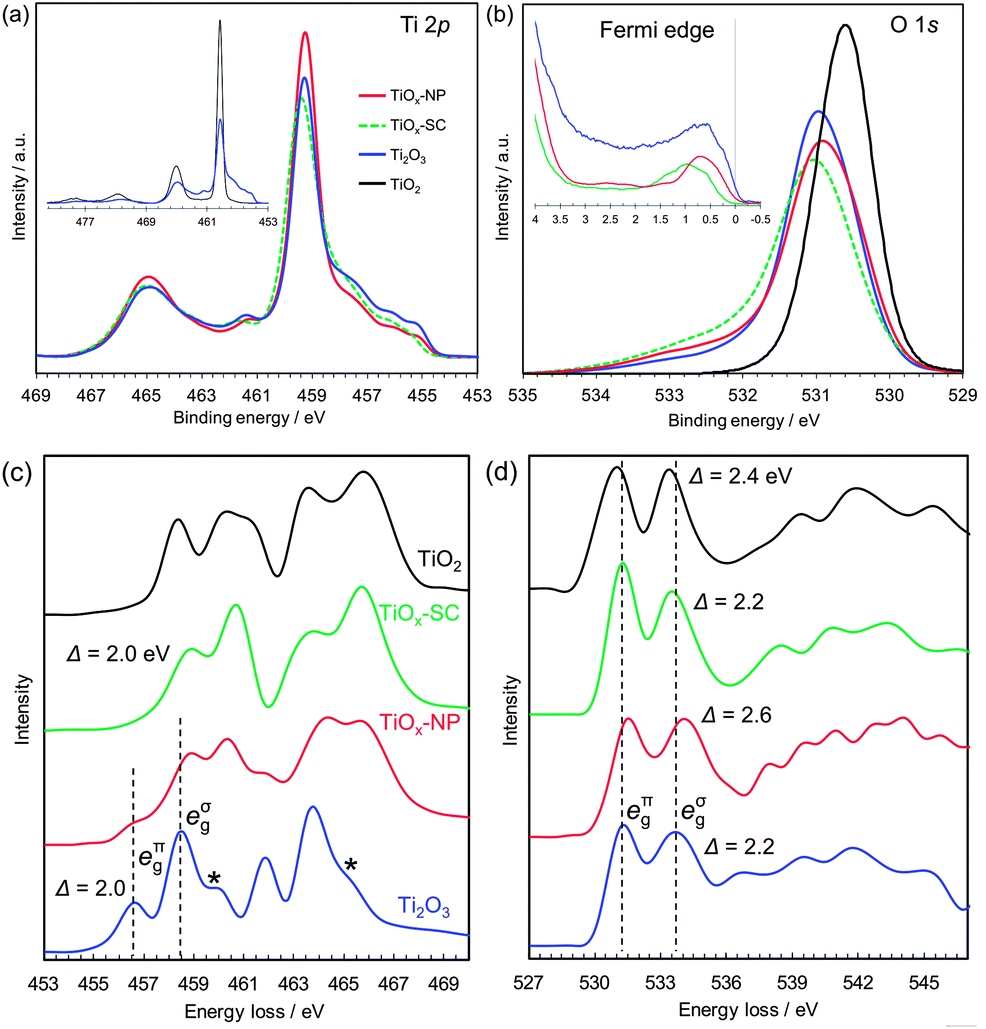 | ||
| Fig. 2 Electronic structure analyses of rutile TiO2 single crystal, reduced single crystal (TiOx-SC), reduced nanoparticles (TiOx-NP) and Ti2O3 particles. (a) Ti 2p HX-PES. (b) O 1s HX-PES with the Fermi edge spectra (insets). The takeoff angle was 88.5°. (c) Ti L-edge EELS. (d) O K-edge EELS. The EELS of Ti2O3 are consistent with those in the literature,24 except for the small post-edge peaks of Ti L-edge indicated by ‘*’, which are attributable to the Ti3O5 impurities (Fig. S5†). | ||
The HX-PES data (Fig. 2a and b) of TiOx-NP and TiOx-SC are identical and close to those of typical corundum Ti2O3.21 Their main Ti 2p peaks are located at the same energy as TiO2 (Fig. 2a, inset), suggesting that less-screened final states are dominant. Since the electronic structure models of Ti2O3 including electron correlations are still open to debate, here we avoid following a specific one but rather focus on the experimental facts. The lower-energy shoulder of the Ti 2p3/2 peak (459.4 eV) reflects core–hole screening by Ti 3d electrons, as is often observed in transition metal oxides.22,23 The Ti 3d electrons exist just below the Fermi level EF (Fig. 2b, inset: the peaks of TiOx-SC, TiOx-NP and Ti2O3 are at 0.97, 0.72 and 0.57 eV, respectively.), and these electrons should be in the a1g band (Fig. 1e). Since the compositions of TiOx-SC and Ti2O3 are the same, the 3d peak intensities probably reflect difference in the ionization cross-sections associated with orbital symmetry change.
The high-energy tail of the O 1s peak probably reflects charge deficiency in oxygen ions, rather than surface water molecules or hydroxyl groups to which the tail is usually assigned; because the detectable depth of the HX-PES method is ∼21 nm.§ Interestingly, the O 1s tail was reported to be prominent in the metallic phase of Ti4O7 but not in the semiconducting phase.22 From these O 1s HX-PES peaks and the O K-edge EELS peaks (Fig. 2d), the eπg conduction band of TiOx-SC, TiOx-NP and Ti2O3 are respectively calculated to be at ∼0.27, ∼0.41 and ∼0.33 eV above EF. This is supported by the optical absorption measurements (Fig. S23†). Thus, the excellent conductivity of TiOx-SC does not originate from a narrow semiconductor gap as expected on the basis of the Goodenough model.
The Ti L-edge EELS (Fig. 2c) of TiOx-SC is unique compared with typical corundum Ti2O3, whose peaks are 2 eV lower than that of TiO2.24 This spectral behaviour is similar to Ti4+ ions in ilmenites (e.g., NiTiO3),16 which has a corundum structure composed of M2+/Ti4+ alternating layers along the c-axis, but TiOx-SC should consist of Ti3+ ions in view of the stoichiometric composition. That is, Ti3+ ions in TiOx-SC appear to behave like Ti4+ ions during the electron excitations. This apparent 3d electron deficiency and the smaller 3d peak in the HX-PES may result from different electron correlations between TiOx-SC and Ti2O3, probably originating from lattice strains. These different electronic structures are considered to be the origin of the metallic conduction of TiOx-SC, though further detailed analyses are needed.
The EELS spectra of TiOx-NP appear to contain Ti4O7, which has broad peaks in a similar range to Ti2O3,24 together with the unique Ti2O3 of TiOx-SC. From the PDF analysis, the mass fraction of the Ti4O7 phase is estimated to be 46%. The discrepancy in the conductivities between the TiOx-SC and TiOx-NP samples may originate from the Ti4O7 phase, which is expected to be less conducting, or from surface layer and/or interparticle resistance. The reduced (110)-oriented single crystal TiO2, mentioned earlier, also contains Ti4O7, but shows comparable conductivity to the single crystalline Ti2O3 obtained from (100)-oriented single crystal TiO2 (Fig. S25†). Thus, the presence of the Ti4O7 phase is not definitive in explaining the conductivity difference. It can be concluded that this is probably due to interparticle resistance.
Conclusions
Topotactic reactions are attractive post-synthetic treatments for nanomaterials because of their negligible impact on the nanostructure as well as possible creation of unique electronic properties. As exemplified by the rutile topotactic reduction, which is too slow (200 nm per day at the optimum conditions)¶ to be applied to bulk materials though feasible for nanomaterials (e.g., less than a few hundred nanometer-size particles), there may be plenty of topotactic reactions applicable only to nanomaterials. Thus, topotactic reactions have great potential to create nanomaterials having unique structures and properties that cannot be realized in bulk materials.Since these reactions tend to proceed under kinetically controlled conditions, the products may contain nanocrystalline phases as well as crystalline phases, as we found for the reduced nanoparticle sample. Syntheses of nanomaterials are, generally, more or less kinetically controlled, thus careful analyses, with the presence of additional nanocrystalline or amorphous phases in mind, are needed for the discussion of their properties.
Methods
Synthesis
TiOx-SC and TiOx-NP were respectively synthesized by reducing mirror-polished, (100)-oriented rutile TiO2 single crystals (0.5 mm thick, 5 mm × 5 mm pieces) and rutile nanoparticles (10–30 nm) using CaH2 at 350 °C, as reported previously.10,13X-ray structure
The X-ray total scattering data were collected with Mo Kα (λ = 0.7107 Å) operated at 50 kV, 40 mA for 22 h (RINT RAPID-S, Rigaku). Background subtraction, X-ray polarization correction, absorption correction, and Compton scattering correction were performed using the PDFgetX2 program.25 The structure functions (Qmax = 17.0 Å−1, spatial resolution of 0.37 Å) were converted into PDFs. The PDF data were analyzed by curve fitting using the PDFgui program26 with a spherical particle model.27 Structures were visualized using the VESTA program.28 The composition was determined by thermogravimetric analysis (SII EXSTAR6000) scanned at 1 °C min−1 in air.Electronic structure
HX-PES were collected with synchrotron hard X-rays (BL15XU SPring-8, 5.95 keV). The spectra were corrected through background subtraction with the Shirley method, the Savitzky–Golay smoothing process, and intensity normalization based on the peak areas of Ti 2p, O 1s or valence band. The EELS data were collected using a transmission electron microscope (JEM-2100F, JEOL) at 200 kV. The Ti L-edge and O K-edge spectra were corrected via a model-based deconvolution process using the EELSModel3.0 program.29 In the model, a power law background and hydrogenic cross-sections of Ti L-edge and O K-edge were assumed. The energy-scales were calibrated by setting the O K-edge peak position of TiO2 to be at 531.0 eV.30Acknowledgements
This work was supported by the World Premier International Research Center Initiative (WPI-MANA), MEXT, Japan. The NIMS Beamline at SPring-8 is acknowledged for beamtime (2011B4612). The authors are grateful to HiSOR, Hiroshima University, and JAEA/SPring-8 for the development of HX-PES at BL15XU of SPring-8. The authors thank Y. Tsujimoto (NIMS) for reduction treatment using CaH2; A. Yamamoto (NIMS) for data processing support on the synchrotron X-ray PDF measurements; S. Ueda (NIMS), Y. Yamashita (NIMS), and S. Ishimaru (SPring-8 Service) for technical support on the HX-PES measurements; Y. Nemoto (NIMS) and I. Yamada (NIMS) for help with the EELS measurements; and T. Narushima (NIMS) for help in FIB sampling.Notes and references
- X. Chen, L. Liu, P. Y. Yu and S. S. Mao, Science, 2011, 331, 746–750 CrossRef CAS PubMed.
- H. M. Liu, W. S. Yang, Y. Ma and J. N. Yao, Appl. Catal., A, 2006, 299, 218–223 CrossRef CAS PubMed.
- D. C. Cronemeyer, Phys. Rev., 1959, 113, 1222–1226 CrossRef CAS.
- T. Ioroi, H. Kageyama, T. Akita and K. Yasuda, Phys. Chem. Chem. Phys., 2010, 12, 7529–7535 RSC.
- T. Ioroi, H. Senoh, S. I. Yamazaki, Z. Siroma, N. Fujiwara and K. Yasuda, J. Electrochem. Soc., 2008, 155, B321–B326 CrossRef CAS PubMed.
- M. Kim, D. H. Kwon, K. M. Kim, J. H. Jang, J. M. Jeon, M. H. Lee, G. H. Kim, X. S. Li, G. S. Park, B. Lee, S. Han and C. S. Hwang, Nat. Nanotechnol., 2010, 5, 148–153 CrossRef PubMed.
- C. Di Valentin, G. Pacchioni and A. Selloni, J. Phys. Chem. C, 2009, 113, 20543–20552 CAS.
- V. M. Khomenko, K. Langer, H. Rager and A. Fett, Phys. Chem. Miner., 1998, 25, 338–346 CrossRef CAS.
- R. N. Blumenth, J. Coburn, J. Baukus and W. M. Hirthe, J. Phys. Chem. Solids, 1966, 27, 643–654 CrossRef.
- S. Tominaka, Inorg. Chem., 2012, 51, 10136–10140 CrossRef CAS PubMed.
- T. Egami and S. J. L. Billinge, Underneath the Bragg peaks: structural analysis of complex materials, Elsevier, Oxford, UK, 2003 Search PubMed.
- S. J. L. Billinge and I. Levin, Science, 2007, 316, 1698 CrossRef CAS PubMed.
- S. Tominaka, Y. Tsujimoto, Y. Matsushita and K. Yamaura, Angew. Chem., Int. Ed., 2011, 50, 7418–7421 CrossRef CAS PubMed.
- L. L. V. Zandt, J. M. Honig and J. B. Goodenough, J. Appl. Phys., 1968, 39, 594–595 CrossRef.
- C. E. Rice and W. R. Robinson, Mater. Res. Bull., 1976, 11, 1355–1359 CrossRef CAS.
- G. Radtke, S. Lazar and G. A. Botton, Phys. Rev. B: Condens. Matter Mater. Phys., 2006, 74, 155117 CrossRef.
- L. F. Mattheiss, J. Phys.: Condens. Matter, 1996, 8, 5987–5995 CrossRef CAS.
- C. E. Rice and W. R. Robinson, Mater. Res. Bull., 1976, 11, 1355–1360 CrossRef CAS.
- L. L. Vanzandt, J. M. Honig and J. B. Goodenough, J. Appl. Phys., 1968, 39, 594–595 CrossRef CAS.
- M. Yoshiya, I. Tanaka, K. Kaneko and H. Adachi, J. Phys.: Condens. Matter, 1999, 11, 3217–3228 CrossRef CAS.
- T. Uozumi, K. Okada, A. Kotani, Y. Tezuka and S. Shin, J. Phys. Soc. Jpn., 1996, 65, 1150–1153 CrossRef CAS.
- M. Taguchi, A. Chainani, M. Matsunami, R. Eguchi, Y. Takata, M. Yabashi, K. Tamasaku, Y. Nishino, T. Ishikawa, S. Tsuda, S. Watanabe, C. T. Chen, Y. Senba, H. Ohashi, K. Fujiwara, Y. Nakamura, H. Takagi and S. Shin, Phys. Rev. Lett., 2010, 104, 106401 CrossRef CAS.
- K. Horiba, M. Taguchi, A. Chainani, Y. Takata, E. Ikenaga, D. Miwa, Y. Nishino, K. Tamasaku, M. Awaji, A. Takeuchi, M. Yabashi, H. Namatame, M. Taniguchi, H. Kumigashira, M. Oshima, M. Lippmaa, M. Kawasaki, H. Koinuma, K. Kobayashi, T. Ishikawa and S. Shin, Phys. Rev. Lett., 2004, 93, 236401 CrossRef CAS.
- E. Stoyanov, F. Langenhorst and G. Steinle-Neumann, Am. Mineral., 2007, 92, 577–586 CrossRef CAS.
- X. Qiu, J. W. Thompson and S. J. L. Billinge, J. Appl. Crystallogr., 2004, 37, 678 CrossRef CAS.
- C. L. Farrow, P. Juhas, J. W. Liu, D. Bryndin, E. S. Bozin, J. Bloch, T. Proffen and S. J. L. Billinge, J. Phys.: Condens. Matter, 2007, 19, 335219 CrossRef CAS PubMed.
- R. C. Howell, T. Proffen and S. D. Conradson, Phys. Rev. B: Condens. Matter Mater. Phys., 2006, 73, 094107 CrossRef.
- K. Momma and F. Izumi, J. Appl. Crystallogr., 2011, 44, 1272–1276 CrossRef CAS.
- J. Verbeeck and S. Van Aert, Ultramicroscopy, 2004, 101, 207–224 CrossRef CAS PubMed.
- L. A. Grunes, R. D. Leapman, C. N. Wilker, R. Hoffmann and A. B. Kunz, Phys. Rev. B: Condens. Matter Mater. Phys., 1982, 25, 7157–7173 CrossRef CAS.
- J. R. Gunter and H. R. Oswald, Bull. Inst. Chem. Res., Kyoto Univ., 1975, 53, 249–255 Search PubMed.
- M. P. Seah and W. A. Dench, Surf. Interface Anal., 1979, 1, 2–11 CrossRef CAS.
- S. Tominaka, Chem. Commun., 2012, 48, 7949–7951 RSC.
Footnotes |
| † Electronic supplementary information (ESI) available: Experimental details, HX-PES, PDF, TGA, optical properties. See DOI: 10.1039/c3mh00087g |
| ‡ A component(s) of the parent crystal is exchanged with the surroundings while retaining one or several crystallographically equivalent orientations to the product.31 |
| § Three times as deep as photoelectron inelastic mean free paths, ∼7 nm for both Ti 2p and O 1s.32 |
| ¶ The reaction rate is 20 nm per day for the reduction treatment using CaH2 at 350 °C,10 and 200 nm per day for the treatment using NaBH4 at 375 °C.33 Further stronger treatments resulted in low crystallinity (cf. Fig. S3†). |
| This journal is © The Royal Society of Chemistry 2014 |