Thermodynamic control of iron pyrite nanocrystal synthesis with high photoactivity and stability†
Alec
Kirkeminde
and
Shenqiang
Ren
*
Department of Chemistry, University of Kansas, Lawrence, KS, USA. E-mail: shenqiang@ku.edu
First published on 17th October 2012
Abstract
Non-toxic, earth abundant nanostructured semiconductors have received extensive attention recently. One of the more highly studied materials has been iron pyrite (FeS2) due to its many different promising applications. Herein, we report the thermodynamically-controlled synthesis of FeS2 nanocrystals, dependent on the reaction temperature and chemical precursors, and a Lewis acid/base model to explain the shape-controlled synthesis. The surface facet-controlled photocatalytic activity and photostability were studied and explained. This work further advances the synthesis with pyrite structure control and surface facet-dictated applications, such as photovoltaics, photocatalysts and photoelectrochemical cells.
Introduction
FeS2 (iron pyrite, fool's gold) is a promising optoelectronic material due to its high absorption coefficient (>105 cm−1 at Eg ± 0.1 eV) and suitable indirect band gap ∼0.95 eV,1 which opens up great potential for emerging renewable energy applications, including photovoltaics, photodetectors and photoelectrochemical cells.1,2 FeS2 is also an earth abundant and non-toxic semiconductor material, which is more desirable than commonly used inorganic chalcogenides, such as CdX and PbX. A recent cost-effective photovoltaic study has identified FeS2 as the most promising candidate for producing large-scale photovoltaic devices.3 Even with so much promise as a photovoltaic material, investigation into FeS2 has lagged behind. This can be attributed to its complicated synthesis control and conflicting crystal studies. Traditionally, the surface defect states of FeS2 are responsible for its low open circuit voltage (Voc) in photovoltaic devices, its heterogeneous bandgap, and the Fermi level pinning.3–5 More recently, many different views have emerged due to new theoretical computation becoming available, which states that sulfur vacancies are not the cause of these hurdles.5 These problems and contradictions must be addressed before FeS2 pyrite can fulfill its place as the “golden” material for photovoltaic devices.Shape, size and composition control of semiconductor nanocrystals or quantum dots (QDs) is an important aspect of colloidal synthesis, which can dictate many different aspects of materials’ functionality, such as the photoabsorbance, localized surface plasmon resonance (LSPR), catalytic properties and their self-assembly properties. Being able to control the shape and size of nanocrystals allows for optimization of these functionalities to best suit the intended application. For instance, it is well studied that controlling the size of CdSe QDs allows for control of the absorbance by the quantum confinement effect.6–8 It has also been shown that changing the shape and composition of plasmonic semiconducting nanocrystals will change their absorption and location of the LSPR.9–11 Surface facet control also opens the doors for control of surface activity and stability. It has been shown that the different crystal faces will affect its catalytic activity.12–14 In FeS2, studies have been done on the (100) crystal face to study the defect states and reactivity of pyrite with water to help combat acid mine drainage, but no studies of other crystal facets or controllable synthesis are available for standard photocatalytic and photostability studies.15
In this study, the goal is to lay down a foundation for the nanoscale synthesis and characteristics of iron pyrite to allow for appropriate material use in emerging energy applications. To do so, we start by examining previous theoretical and synthesis work. Theoretically, many reports have studied the differences between crystal facets and the growth mechanisms, but there has been no follow-up on the uses of these crystal faces.16–18 Solution processing is known for scaling up. In the past, there have been a variety of pyrite synthetic works, and many were done by hydrothermal experiments. As only one nanocrystal geometry could be synthesized, only that crystal facet's chemistry could be examined for a targeted application. This work aims to start to address this lack of foundation work in solution processing pyrite nanocrystals and to examine which type of crystals will be best used for the intended applications.
We start by systematically changing different synthetic variables for creating FeS2 nanocrystals by thermodynamic control, such as the reaction temperature and chemical precursors, and show the shape effect on surface reactivity by examining the photocatalytic properties of different pyrite crystals. Being able to control the shape of FeS2 nanocrystals allows us to (1) be able to study the kinetics behind the formation of the different crystal surface facets and their characteristics, (2) devise a model to explain such formation, and (3) study the different crystal facets’ effects on the photocatalytic activities and photostability, allowing specific uses to be recommended for each structure.
Experimental
A standard synthesis starts with FeCl2 (63.4 mg per 0.5 mmol) in octadecylamine (ODA, 12 g), which is loaded into a three neck flask, is degassed and back filled with argon, heated to 120 °C, and allowed to decompose for 1 hour. Another three neck flask is then loaded with sulfur powder (128 mg per 4 mmol) and diphenyl ether (5 mL), is degassed and back filled with argon, and heated to 70 °C for 1 hour to dissolve. The sulfur solution is then injected into the Fe–ODA precursor at variable temperatures of 120 °C, 170 °C, 220 °C (depending on which shape is desired, discussed later). After injection, the combined solution was heated to 220 °C and allowed to age for 90 min. During the aging time, another flask is loaded with FeCl2 (16 mg per 0.125 mmol) and ODA (4 g), degassed and back filled with argon, and allowed to decompose at 120 °C for 1 hour. This extra precursor solution is then injected into the FeS2 flask at varying temperature (120 °C/220 °C) to study extra precursor effects. The final solution is allowed to age for 120 min at 220 °C with aliquots taken at different aging times to assess the growth. The effects of different iron precursors (Fe(acac)2, Fe(CO)5) were examined using the same molar amount as for standard FeCl2 synthesis and using a 220 °C injection temperature. After 120 min, the solution was allowed to cool to ∼100 °C and the reaction was halted by adding methanol. Particles were separated by centrifugation and purified by being re-dissolved and crashed out in chloroform–methanol. The final particles were dispersed in chloroform for storage and further characterization. In a standard methyl orange degradation experiment, 0.09 g of nanoparticles were loaded into 10 mL of a 30 mg L−1 methyl orange solution. This was sonicated for 5 min and put in a black box with a stirrer plate and a xenon light source. The vial was put 7 mm away from the xenon source, to which the power was 46 mW cm−2, measured by a power meter. Aliquots of 200 μL of the sample were taken every 10 min and diluted with 400 μL of water, and the UV-Vis absorbance was taken to assess the photocatalytic properties.All UV-Vis absorbance spectra were obtained on a UV-3600 Shimadzu UV-Vis-NIR spectrophotometer. Room temperature X-ray powder patterns were obtained using monochromated Cu-Kα radiation (λ = 1.54178 Å) on a Bruker proteum diffraction system equipped with Helios multilayer optics, an APEX II CCD detector and a Bruker MicroStar microfocus rotating anode X-ray source operating at 45 kV and 60 mA. The powders were mixed with a small amount of Paratone N oil to form a paste that was then placed in a small (<0.5 mm) nylon cryoloop and mounted on a goniometer head. Transmission electron microscope (TEM) images were obtained using a field emission FEI Tecnai F20 XT.
Results and discussion
In this section we will first discuss the shape control of the FeS2 nanocrystals and how both the temperature and the iron precursor affect the final crystal structures and the crystal growth. The FeS2 phase identification, optical, and crystal planes have been characterized by crystallography and microscopy. Thermodynamic control and the Lewis acid–base concept will be presented to explain the growth model of the FeS2 nanocrystals. Finally, the photocatalytic activity and stability will be discussed using a standard methyl orange degradation experiment.Shape control and characterization
Fig. 1 presents the shape control by varying the reaction temperature (low magnification SEM images of different shapes are shown in Fig. S1, ESI†). Fig. 1a shows the synthesis with iron(II) chloride (FeCl2); using 120 °C for the initial injection temperature of the iron solution yields cubic structures reminiscent of their bulk counterparts. Fig. 1b shows that upon raising the initial injection temperature to 170 °C, what we deem to be popcorn-shaped particles appear. These popcorn-shaped particles are formed by merging smaller cubes together into a bigger particle to minimize the surface energy, depicted by the illustration in the inset of Fig. 1b. Other groups have seen this kind of formation of pyrite and In2O3 spheres.19,20 Popcorn particles are much bigger, around ∼220 nm, but the individual cubes that make up the particle are smaller, being around ∼80 nm. Bringing the initial temperature up to 220 °C creates FeS2 nanospheres (NSs), which show a more spherical shape with a size around ∼30 nm, as shown in Fig. 1c. Fig. 1d and e show that upon changing the precursor and keeping all other variables (i.e. 220 °C for the iron precursor injection) constant, the final FeS2 shows different morphologies. Fig. 1d shows that when using iron(II) acetylacetonate (Fe(acac)2) as a precursor, thin two dimensional sheets are formed. As one can see through these sheets by the presented TEM image, it can be determined that these sheets are thin. When iron(0) pentacarbonyl (Fe(CO)5) is used as the starting precursor, thicker hexagonal sheets are formed which are presented in Fig. 1e.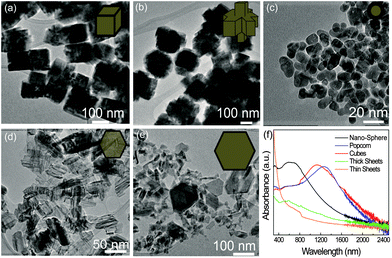 | ||
| Fig. 1 Iron pyrite nanocrystal shapes at an injection temperature of (a) 120 °C (b) 170 °C and (c) 220 °C. Iron precursor effect on shape when (d) Fe(acac)2 and (e) Fe(CO)5 is used with an injection temperature of 220 °C. Illustrations of particle shape are presented in the insets of (a–e). (f) UV-Vis-NIR absorbance of each different shape. | ||
Fig. 1f shows the UV-Vis spectroscopic absorbance of the different particle shapes. FeS2 NSs show the normal absorbance around 600 nm, which is consistent with other literature.1,2 When the shape changes to cubic, a red shift to near infrared (NIR, 1100 nm) is observed, as seen in the hydrothermal method of creating nanocubic pyrite.21 The absorbance of popcorn particles shows an even further shift into the NIR, around 1300 nm, which could be due to the aggregation effect. When examining the thick sheet's absorbance it is seen that distinctive peaks cannot be observed and broadband absorbance occurs from UV all the way through the visible to NIR (∼300–1000 nm). We have attributed the NIR absorbance of the FeS2 nanocrystals to localized surface plasmon resonance, which is confirmed using the plasmon peak wavelength shift by changing the solvent refractive index.22 The thin sheets also show broadband absorbance, but much higher absorbance in the UV light region. The wide band photoabsorbance of the FeS2 NSs in the visible could be interesting for light harvesting photovoltaics, and the IR absorbance of cubic and popcorn particles could be promising for both IR harvesting photovoltaics and photodetectors.
Fig. 2a shows the X-ray diffraction of the synthesized FeS2 nanocrystals. It can be seen that the particles created by both the FeCl2 and Fe(CO)5 precursor are an excellent match with the single crystal phase pyrite standard (00-026-0801), with no marcasite (orthorhombic crystal structure FeS2) or greigite (Fe3S4) phase detectable. When using Fe(acac)2 as the starting iron precursor, impurities appear in the diffraction pattern that match with the greigite phase. Beal et al. have also shown that synthesis performed using Fe(acac)2 can produce greigite material.23Fig. 2b–d show high resolution TEM (HRTEM) images of the NSs, cubes, and thick sheets, respectively. The crystallinity is easily seen in each of these samples, with few domains present in the thick sheets. The inset of each shows the selective area electron diffraction (SAED) patterns obtained from these samples. NSs show the [111] growth direction, while the cubes show a [100] diffraction pattern. The thick sheets show a diffraction pattern with satellites. It is believed that the thick sheets are mostly (100) face with some other crystal domains scattered throughout, which cause the satellite points in the diffraction pattern, and could be responsible for the low carrier mobility, as we observed earlier.24
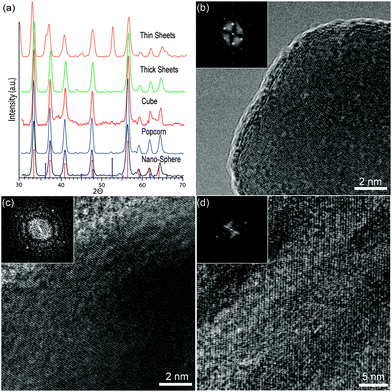 | ||
| Fig. 2 (a) XRD patterns of each shape synthesized. The main index lines represent pyrite crystal lattice peaks (00-026-0801), and the greigite crystal lattice peaks (00-026-0801) also are marked for comparison. HRTEM images showing the crystal lattice of pyrite (b) NSs, (c) cubes, and (d) plates. Insets of (b–d) are selective area electron diffraction patterns of each corresponding structure. | ||
Model and precursor discussion
Fig. 3 shows an energy diagram of the proposed model when using FeCl2. Starting from monomers created by decomposition of the precursors at 120 °C, it is found that the shapes of the particles are determined by the Gibbs free energy. With the Gibbs free energy equation, G = H − TS, one can see that in our synthesis the internal energy (H) is kept the same by holding the amount of starting material constant, and only changing temperature (T) and entropy (S). Entropy changes with the amount of decomposition of the precursor; for example, at higher temperature, more precursor decomposition happens, leading to a high concentration of iron monomers. So, if the injection of the sulfur precursor is done at a lower temperature, the reaction will proceed to the right, going through a kinetic [100] growth that ends up with a final product of cubic structures reminiscent of bulk iron pyrite structures. As the (100) crystal lattice in FeS2 has a lower surface energy than the (111) face,13 and the lack of thermal energy and entropy (due to less precursor decomposition, i.e. less monomers) at injection time, the reaction cannot pass the energy barrier ΔGQD and instead advances through the ΔGcube barrier. If the injection temperature is raised, the extra energy requirement can be overcome due to the increased thermal and entropic energy, and the (111) face will be the fastest growing, and the particles form NSs. When an injection temperature is used that falls between the others, growth in the (100) plane occurs, but not complete growth. It is believed that, during the reaction, the higher energy planes merge together to minimize surface energy, creating a “popcorn” shape, with the more stable (100) face exposed.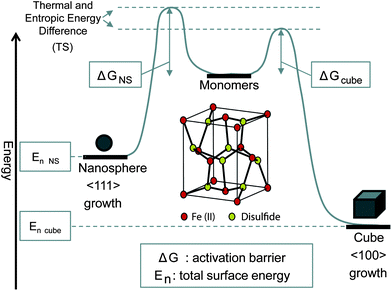 | ||
| Fig. 3 Proposed model showing energy diagram for the formation of two different crystal faces of pyrite. The pyrite crystal structure is presented in the middle. | ||
To support our model, aliquots were taken during the synthesis to assess growth. When the sulfur solution is injected at 120 °C, the initial seeds are formed by the well known LaMer theory25 as cubic structures seen as early as 5 min after injection (Fig. S2†). Throughout the reaction, the precursor is slowly added to these few cubic seeds, growing them to their final size of around ∼120 nm after about 40 min. At 90 min, the second injection of iron precursor is added. Both fast injection/slow injection were tested, as well as the temperature of the second injection solution (120/220 °C). Neither of these variables changed the final result. 120 min after the second injection (310 min total time) the final products were still cubes, although some particles start merging together from over-aging or the increase of iron precursor from the second injection. Following the same schematic as above, but with an initial temperature injection at 170 °C, both cubic and QD seeds are seen after 10 min, but by 40 min, all QD seeds disappear by Ostwald ripening or merging with cubic particles to create popcorn shaped particles. At a 220 °C initial injection temperature, QD seeds are created, followed by growth along the [111] direction which is allowed by the increased thermal energy. The NSs then grow to a final size, though the size distribution varies quite largely, which could result from Ostwald ripening or poor ligand coverage on certain faces.
After changing the iron precursors, the change of decomposition rate of the iron source must be taken into account, since all other variables are kept the same. The FeS2 growth model can be understood by the Lewis acid–base concept, which states that like components will have stronger binding with each other and that unlike components will have weaker binding. Using this concept, the precursor's hard/softness can be examined to determine which of them should be stronger binding, which would indicate less decomposition. Knowing that Fe2+ is an intermediate strength acid and acetylacetonate is a very hard base,26 it shows that the Fe(acac)2 precursor should decompose completely giving the most precursor monomers available. When looking back at the XRD pattern of these nanoplates, the material is greigite, which is Fe3S4. As there is an excess of sulfur (1![[thin space (1/6-em)]](https://www.rsc.org/images/entities/char_2009.gif) :8) in the reaction, seeing Fe3S4 in this method and not the others is no surprise due to more iron monomers being available. Comparing Cl− to acetylacetonate, it is found that the chloride ion is a hard base, but not to the same degree as acetylacetonate, meaning that it will not decompose to the same extent as Fe(acac)2, allowing for pure FeS2 NSs to be formed due to incomplete decomposition of the iron source. When Fe(CO)5 is used as the iron precursor, thick pure phase FeS2 nanoplates are formed. Iron in Fe(CO)5 is in an oxidation state of zero, therefore classified as a soft acid, and carbonyl ligands are known to be soft bases. Since both are soft, they have a stronger bond, making it the least decomposed out of the three precursors used. The limited iron monomer concentrations and large amount of ligand molecules result in thicker and larger FeS2 plates.27
:8) in the reaction, seeing Fe3S4 in this method and not the others is no surprise due to more iron monomers being available. Comparing Cl− to acetylacetonate, it is found that the chloride ion is a hard base, but not to the same degree as acetylacetonate, meaning that it will not decompose to the same extent as Fe(acac)2, allowing for pure FeS2 NSs to be formed due to incomplete decomposition of the iron source. When Fe(CO)5 is used as the iron precursor, thick pure phase FeS2 nanoplates are formed. Iron in Fe(CO)5 is in an oxidation state of zero, therefore classified as a soft acid, and carbonyl ligands are known to be soft bases. Since both are soft, they have a stronger bond, making it the least decomposed out of the three precursors used. The limited iron monomer concentrations and large amount of ligand molecules result in thicker and larger FeS2 plates.27
Photocatalytic properties and stability
To further test the differences and activity of different shaped FeS2, a standard methyl orange degradation experiment was preformed. Fig. 4 shows the UV-Vis absorbance throughout the experiment with the three different shapes created using FeCl2 as a precursor. Fig. 4a shows that the nanocubes have modest activity, with degradation being complete after 150 min (the full experimental absorbance curves are shown in Fig. S3, ESI†). The popcorn-shaped FeS2 (Fig. 4b) shows less activity towards methyl orange than the cubes. When examining the FeS2 NSs (Fig. 4c), there is almost no activity. Fig. 4d shows the decrease in the intensity at peak absorbance wavelength. It shows that the (100) plane of the FeS2 nanocrystals is the most active plane for photocatalytic sites, which can be explained by examining the crystal facets. Theory has shown that in excess sulfur conditions, where particles made in this study have a 1:8 iron:sulfur ratio, the (100) facet is iron terminated and the <111> facet is sulfur terminated.17 This being the case, it can be seen that the metal terminated face, (100), can explain the better methyl orange degradation while the sulfur terminated face shows minimal catalytic activity.
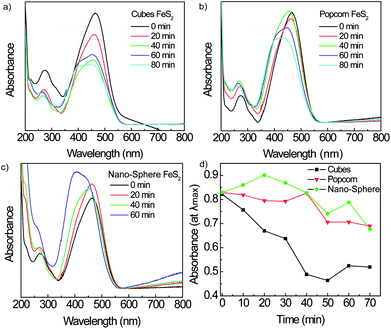 | ||
| Fig. 4 UV-Vis absorbance spectra obtained during photocatalytic experiment using different particle shapes depending on temperatures. Cube photocatalytic activity is shown in (a), while popcorn is in (b) and NSs in (c). Absorbance at λmaxvs. time (min) for the three FeCl2 shapes are presented in (d). | ||
Different surface planes also dictate the FeS2 photostability. During the experiment, the absorbance peak can be seen to blue shift to a certain degree. This bimodal absorbance peak that starts to appear suggests that other chemistry is occurring and not just methyl orange decomposition. It is well known that pyrite can be oxidized in water, which is the main cause of acid mine drainage, by the reaction FeS2(s) + 3.5O2(g) + H2O(l) → Fe2+(aq) + 2SO42−(aq) + 2H+(aq).28 It was confirmed that the leftover solution had a pH of 2.9 after the experiment, which is a change from the 4.2 pH of the starting solution of methyl orange. Also, the Fe2+ can be further oxidized by 4Fe2+(aq) + O2(g) + 4H+(aq) → 4Fe3+(aq) + 2H2O(l), leaving Fe3+ ions dissolved in the water, which was found to be what is causing the other absorbance peak. This has been confirmed by two routes, first by comparing to the absorbance of FeCl3 dissolved in water and by crashing out the leftover FeS2 particles and adding OH− ion source to the solution. A brown precipitate appears instantly. The brown precipitate is Fe(OH)3 that formed due to its very low solubility in water. It is also seen that the nano-crystals themselves experience degradation by TEM (Fig. S4, ESI†).
After confirming that Fe3+ was the cause of the peak shift, we can use the intensity and quickness of the shift to estimate the photostability of different crystal facets of FeS2 pyrite in water, which play an important role in photoelectrochemical cells. It is seen that the NSs show a shift quickly and the absorbance is very intense by the 60 min mark. When looking at the cubic structures, there is an absorption shift, first with the methyl orange decomposition, then the other peak starts showing at around 60 minutes, but not as strong as the NSs. Once again, examining the particles' crystal facets is useful to explain this phenomenon. It has been found that H2O adsorbs onto sulfur defect sites,15 at which it can then undergo the chemistry stated above, ending in the reduction of the iron in FeS2 to Fe3+. Since the (111) crystal facet is sulfur terminated, sulfur defects should be high, causing the oxidation of pyrite to happen quicker on this plane than on the (100) plane. Oxidation still happens on the cubic and popcorn structures due to there still being defects on the (100) face, but degradation happens first, than the decomposition follows at a slower pace.
Fig. 5 shows the photocatalytic activity of the nanocrystals formed using different precursors. Fig. 5a and b show the absorbance curves of the thin plates created by the Fe(acac)2 precursor and Fe(CO)5, respectively. Pyrite plates show quick methyl orange degradation, which helps confirm that the (100) is more active than the (111) facet. It can be seen that the thin plates show quicker degradation, which could result from more surface area than the thicker FeS2 plates. Fig. 5c shows the QD results for comparison of the differences of the iron precursor. Fig. 5d shows the degradation of the peak absorbance over time. The second Fe3+ peak does not appear in either of the plate samples, which suggests that these are protected more from oxidation. This can be understood by a better coverage of ligands on the 2D surfaces of the plates, which will be important for photoelectrochemical cells when using aqueous medium.
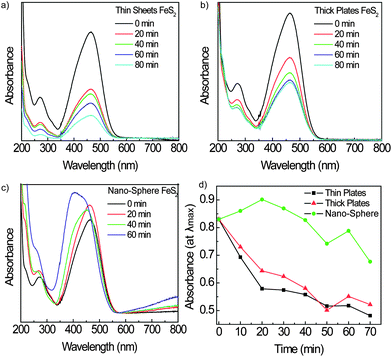 | ||
| Fig. 5 UV-Vis absorbance spectra during photocatalytic experiments using different particle shapes by changing the precursor. Thin plates created by Fe(acac)2 photocatalytic results are shown in (a), while thick plates created by Fe(CO)5 are shown in (b), while NSs are shown in (c) for reference. Absorbance at λmaxvs. time (min) for the three different precursor shapes are presented in (d). | ||
Not only does this information shed light on what crystal facet is more active to photoelectrochemical activity, it can also give insight into how to better use this material in photovoltaic cells. It has been seen that FeS2 plates are very active, but lack electron mobility,24 making them a poor candidate. NSs and cubes show more promise for photovoltaics, but sulfur deficiency sites could cause a problem unless addressed during synthesis29 or by passivating the active FeS2 with another material matrix in the active layer of the solar cell. Our group has demonstrated that we can indeed get the performance of an all-inorganic solar cell by using the latter method22 and creation of more effective photovoltaic cells of pyrite is ongoing.
Conclusions
In summary, we have shown that the pyrite nanocrystal shape can be controlled by both thermal and chemical precursor effects, and five different shapes with two different growth directions have been achieved. A thermodynamic model behind the shape-controlled synthesis has been proposed. Also, photocatalytic measurements were conducted to examine the surface photoactivity and photostability of crystal surface facets, and it is seen that the (100) face is less sensitive to photodegradation and photooxidation in water than the (111) planes. It is found that pyrite 2D plates show no oxidation over the time period of the experiment and are relatively reactive, which suggests that these would be the best candidates for photocatalytic cells, while the (111) NSs and even the (100) cubes to an extent are more useful for photovoltaics due to sulfur defects, as long as these sulfur defects could be passivated well.4,29Acknowledgements
S. R. thanks the University of Kansas for its start-up and new faculty general research fund (NFGRF) financial supporting, and additional support from NSF Kansas EPSCoR-0903806. The authors also acknowledge access to the X-Ray Diffractometer under award number NSF-MRI grant CHE-0923449.Notes and references
- J. Puthussery, S. Seefeld, N. Berry, M. Gibbs and M. Law, J. Am. Chem. Soc., 2010, 133, 716–719 CrossRef.
- D.-Y. Wang, Y.-T. Jiang, C.-C. Lin, S.-S. Li, Y.-T. Wang, C.-C. Chen and C.-W. Chen, Adv. Mater., 2012, 24, 3415–3420 CrossRef CAS.
- C. Wadia, A. P. Alivisatos and D. M. Kammen, Environ. Sci. Technol., 2009, 43, 2072–2077 CrossRef CAS.
- D. Zhang, X. Wang, Y. Mai, X. Xia, C. Gu and J. Tu, J. Appl. Electrochem., 2012, 42, 263–269 CrossRef CAS.
- L. Yu, S. Lany, R. Kykyneshi, V. Jieratum, R. Ravichandran, B. Pelatt, E. Altschul, H. A. S. Platt, J. F. Wager, D. A. Keszler and A. Zunger, Adv. Energy Mater., 2011, 1, 748–753 CrossRef CAS.
- C. B. Murray, D. J. Norris and M. G. Bawendi, J. Am. Chem. Soc., 1993, 115, 8706–8715 CrossRef CAS.
- Z. A. Peng and X. Peng, J. Am. Chem. Soc., 2000, 123, 183–184 CrossRef.
- Z. A. Peng and X. Peng, J. Am. Chem. Soc., 2002, 124, 3343–3353 CrossRef CAS.
- C. J. Orendorff, T. K. Sau and C. J. Murphy, Small, 2006, 2, 636–639 CrossRef CAS.
- J. r. P. Kottmann, O. J. F. Martin, D. R. Smith and S. Schultz, Phys. Rev. B: Condens. Matter, 2001, 64, 235402 CrossRef.
- J. M. Luther, P. K. Jain, T. Ewers and A. P. Alivisatos, Nat. Mater., 2011, 10, 361–366 CrossRef CAS.
- J. S. Chen, C. Chen, J. Liu, R. Xu, S. Z. Qiao and X. W. Lou, Chem. Commun., 2011, 47, 2631–2633 RSC.
- W.-C. Huang, L.-M. Lyu, Y.-C. Yang and M. H. Huang, J. Am. Chem. Soc., 2012, 134, 1261–1267 CrossRef CAS.
- J. S. Chen, J. Liu, S. Z. Qiao, R. Xu and X. W. Lou, Chem. Commun., 2011, 47, 10443–10445 RSC.
- J. M. Guevremont, D. R. Strongin and M. A. A. Schoonen, Am. Mineral., 1998, 83, 1246–1255 CAS.
- A. S. Barnard and S. P. Russo, J. Phys. Chem. C, 2007, 111, 11742–11746 CAS.
- A. S. Barnard and S. P. Russo, J. Mater. Chem., 2009, 19, 3389–3394 RSC.
- A. S. Barnard and S. P. Russo, J. Phys. Chem. C, 2009, 113, 5376–5380 CAS.
- W. Li, M. Doeblinger, A. Vaneski, A. L. Rogach, F. Jaeckel and J. Feldmann, J. Mater. Chem., 2011, 21, 17946–17952 RSC.
- A. Narayanaswamy, H. Xu, N. Pradhan, M. Kim and X. Peng, J. Am. Chem. Soc., 2006, 128, 10310–10319 CrossRef CAS.
- D. Wang, Q. Wang and T. Wang, CrystEngComm, 2010, 12, 3797–3805 RSC.
- A. Kirkeminde, R. Scott and S. Ren, Nanoscale, 2012 10.1039/c2nr32097e.
- J. H. L. Beal, P. G. Etchegoin and R. D. Tilley, J. Solid State Chem., 2012, 189, 57–62 CrossRef CAS.
- A. Kirkeminde, B. Ruzicka, R. Wang, S. Puna, H. Zhao and S. Q. Ren, ACS Appl. Mater. Interfaces, 2012, 4, 1174 CAS.
- V. K. LaMer and R. H. Dinegar, J. Am. Chem. Soc., 1950, 72, 4847–4854 CrossRef CAS.
- J. Zhang, Y. Tang, K. Lee and M. Ouyang, Science, 2010, 327, 1634–1638 CrossRef CAS.
- C. Xu, Y. Zeng, X. Rui, N. Xiao, J. Zhu, W. Zhang, J. Chen, W. Liu, H. Tan, H. H. Hng and Q. Yan, ACS Nano, 2012, 6, 4713–4721 CrossRef CAS.
- P. Sullivan, J. Yelton and K. Reddy, Environ. Geol., 1988, 11, 289–295 CAS.
- A. H. Ip, S. M. Thon, S. Hoogland, O. Voznyy, D. Zhitomirsky, R. Debnath, L. Levina, L. R. Rollny, G. H. Carey, A. Fischer, K. W. Kemp, I. J. Kramer, Z. Ning, A. J. Labelle, K. W. Chou, A. Amassian and E. H. Sargent, Nat. Nanotechnol., 2012 Search PubMed , advance online publication.
Footnote |
| † Electronic supplementary information (ESI) available: Sources of chemicals, TEM images of FeS2 nanocrystal seeds and FeS2 crystals after photocatalytic experiments and full UV-Vis spectra of photocatalytic experiments. See DOI: 10.1039/c2ta00498d |
| This journal is © The Royal Society of Chemistry 2013 |