 Open Access Article
Adsorption of cationic surfactant as a probe of the montmorillonite surface reactivity in the alginate hydrogel composites†
Danielle Silva do Nascimento,
Mariana Etcheverry,
Angie E. Orduz,
Carolina V. Waiman and
Graciela P. Zanini.
 *
*
INQUISUR (UNS-CONICET), Departamento de Química, Universidad Nacional del Sur, Av. Alem 1253, B8000CPB-Bahía Blanca, Argentina. E-mail: gzanini@uns.edu.ar
First published on 12th December 2022
Abstract
Adsorption of a cationic surfactant allowed to probe the surface reactivity of montmorillonite encapsulated in a composite of alginate hydrogels (A-MMT). Dodecylbenzyldimethylammonium chloride (BAC-12) was the surfactant used for these studies. BAC-12 is part of the widely used surfactant mixture known as benzalkonium chloride. XRD showed that up to three different types of basal spacing (d001) were present within the composite indicating that as the concentration of adsorbed BAC-12 increases, populations with different adsorption conformational arrangements are present, even unexpanded clay remains. From the SEM-EDS spectra it is observed that the clay is distributed in the whole composite. In addition, the effect of the presence of cationic and anionic biocides on BAC-12 adsorption was studied. Cationic biocides such as tetradecyllbenzyldimethylammonium chlorides (BAC-14) and paraquat (PQ) show a competitive behavior for the clay adsorption sites at BAC-12 low concentration indicating an electrostatic adsorption mechanism. However, the presence of anionic contaminants such as 2,4-D and metsulfuron methyl do not affect surfactant adsorption. In all scenarios is observed an abrupt increase of BAC-12 adsorbed amount reaching values higher than the clay CEC suggesting strong tail–tail interactions. This occurs at concentrations 10 times lower than the CMC of BAC-12 promoted by clay encapsulation in the composite. In these composites the alginate does not affect the surface reactivity of the clay, but the formation of the hydrogel allows it to be easily extracted from aqueous media which makes it an interesting material with a potential use in water remediation.
Introduction
Adsorption is one of the most important technologies used to retain pollutants for water remediation and purification purposes. The development of future adsorbents depends on the knowledge of the role of each component, the interactions between adsorbate and adsorbent and/or the adsorption mechanisms.Composites formed by inorganic solids and biopolymers are among the materials that have being studied for water pollutant retention.1–4 Regarding the inorganic solids, the clays as montmorillonite (MMT) are commonly applied for cationic pollutant retention due to these clays show mainly structural negative charges.5 Besides, MMT is ubiquitous in nature, nontoxic, environmental-friendly and low cost.6,7 It has large specific surface area, exhibits high cation exchange capacity and excellent adsorbent ability.8–12 Since clay forms stable suspensions, the incorporation of MMT into biopolymer matrices simplifies the separation procedures compared to the use of natural clays.13 Alginate is a biopolymer widely used in synthesizing materials with different shapes due to its ability to form hydrogels in the presence of multivalent cations such as Ca2+.14–18 In addition, MMT improves the mechanical properties of alginate hydrogels.
Alginate-montmorillonite beads (A-MMT) are composites that consist of spheres around 3 mm in diameter which have been used as adsorbents for the removal of heavy metals,19 dyes20,21 and herbicides from aqueous media.22 However, most of the information available in the literature reports the percentage of adsorption, the maximum amount adsorbed and the isotherm fittings and not the interactions of the contaminants with the material components.
Among the pollutants widely discharged into the environment are the surfactants. These substances are commonly used in personal care products, hospital and household cleaners, laundry detergent, oil recovery industries, agriculture and nanotechnology.23–25 After use, residual surfactants can reach surface waters or groundwater, and end up dispersed in soil, water or sediments.26,27
There are different types of surfactants; however, the most used are the ionic ones.24 In this regard, benzalkonium chloride (BAC) consists of a group of cationic surfactants that are highly effective as antimicrobial agents, thereby ranking as one of the most popular antiseptics and disinfectants in the world.28,29 In terms of chemistry, BAC is a mix of alkylbenzyldimethylammonium chlorides having different alkyl chain lengths (C8–C18). Most of the biocidal activity is associated with the C12–C14 derivatives, which are the main constituents of the mix.30,31 In addition, BAC is an active ingredient in common disinfectants recommended for use as prophylaxis protocol for viruses such as SARS-CoV-2.32 In consequence, it has been noted that after their use, BACs accumulate in public facilities, transportation, hospital effluents, wastewater treatment plants, and even common households.33
Due to their molecular structure, BACs interact with negatively charged surfaces as MMT.34–38 The interaction between cationic surfactant and clay minerals such as MMT is well documented but lately most of these studies have focused on the synthesis of organoclays in order to modify clay surface reactivity.39–41 However, the interest of our research is to study these surfactants as contaminants dissolved in water.
Although composites formed by alginate and clay have been studied as adsorbents of pollutants dissolved in water, there is no information on their use in surfactant adsorption and even less on such adsorption is affected by other cationic and anionic substances. In addition, there is a lack of information on the adsorption process inside the material.
The novel purpose of this work is to study the surface reactivity of the clay inside the bead through the adsorption of BAC-12. In addition, the work evaluates how this adsorption process is affected by the presence of other biocides (cationic and anionic) and by the encapsulation of the clay in a bead-like composite.
Experimental
Materials and methods
Sodium alginate biopolymer (CAS: 9005-38-3, Mw = 231.5 g mol−1) was purchased from Fluka. Na-montmorillonite (MMT, 99.4% purity) was obtained from Lago Pellegrini (Rio Negro, Argentina). The CEC of clay is 0.91 mEq g−1 and this clay was fully described by Lombardi et al..42 According to these authors, the MMT structural formula is [(Si3.87Al0.13)(Al1.44Fe3+0.27Mg0.29)O10(OH)2]Na+0.42 where Na+ is the exchangeable cation.34,43Surfactants BAC-12 and BAC-14 were purchased from Fluka (CAS: 139-07-1; 139-08-2, 99.0% purity). For the studies, 5 mM stock solutions at pH 6.0 ± 0.2 of BAC-12 and BAC-14 were prepared in 0.01 M NaCl. The critical micellar concentration (CMC) was determined by dynamic light scattering with a Zetasizer ZS90 (Malvern, UK) by Zanini et al. obtaining values around 3.8 mM and 1.18 mM for BAC-12 and BAC-14, respectively (0.01 M NaCl).28
The molecular structures of all contaminants are shown in Table S1 of the ESI†. Considering the pKa values of 2,4-D and MM their anionic species are predominant at working pH; on the other hand, BAC-12, BAC-14 and PQ are quaternary ammonium salts, therefore they only form cations in aqueous solution.44
Calcium chloride CaCl2·2H2O (CAS: 10035-04-8, 99.0% purity) was supplied by Sigma-Aldrich Company. All other chemicals were analytical grade.
Preparation alginate-clay composite beads
Briefly, 100 mL of a 1% (w/v) alginate solution was mixed with 4 g of MMT and stirred at room temperature. This mixture was added drop by drop through a micropipette tip using a peristaltic pump to a reservoir containing 0.1 M CaCl2 under moderate magnetic stirring. Each drop produces a spherical hydrogel which was referred to as an A-MMT composite bead. The beads were left in this solution for 30 min to harden. A-MMT were separated and rinsed with distilled water and stored in NaCl 0.1 M until use. Simultaneously, alginate beads were synthesized following the same steps without the addition of clay, these hydrogels were named AA beads. Fig. S1 (ESI†) shows digital photographs of A-MMT and AA beads.Characterization
Fourier transform infrared (FTIR) spectra were recorded between 4000–400 cm−1 using KBr pellets by Nicolet Nexus 470 FTIR spectrometer equipped with a DTGS detector. Thermogravimetric analysis (TGA) was carried out with the aid of STDQ600 Thermal Analysis system operated in air. Each powder sample was placed in a ceramic crucible. A constant heating rate of 10 °C min−1 was applied from 20 to 1000 °C. The internal structure of the lyophilized beads was examined using a scanning electron microscopy (SEM-EDS) LEO microscope model EVO 40. Samples were analyzed at 10.0 kV. A-MMT composite beads were washed with doubly distilled water, ground to powder and dried at 30 °C for analysis by powder X-ray diffraction (XRD). XRD patterns of A-MMT beads and A-MMT beads with BAC-12 adsorbed were performed. Powder samples X-ray diffraction patterns data were collected using a PANalytical Empyrean 3 diffractometer with a Ni-filtered CuKα radiation (λ = 1.54 Å) and a PIXcel3D detector. It was operated at a voltage of 45 kV and a current of 40 mA. Diffractograms were collected using a continuous scan mode with slit FDS of 1/16 and FDS IBASS of 1/8°. The measurement conditions were step size: 0.0131303; time per step: 480 s; scan speed: 0.041683 and run time: 30 min for the 2θ range 2°≤ 2θ ≤ 10°. The d-values of clay incorporated in the composite with and without BAC-12 adsorbed were calculated by using Bragg's equation (nλ = 2d![[thin space (1/6-em)]](https://www.rsc.org/images/entities/char_2009.gif) sin
sin![[thin space (1/6-em)]](https://www.rsc.org/images/entities/char_2009.gif) θ).
θ).
Adsorption experiments
Adsorption experiments were performed by batch equilibration method. Briefly, four wet beads were placed in 15 mL polypropylene centrifuge tubes with 10 mL of surfactant and/or herbicide solutions. The initial concentrations (Ci) were from 0.025 to 0.625 mEq L−1 in 0.01 M NaCl. Then, the tubes were shaken during 6 h at room temperature and pH was kept at 6.0 ± 0.2 using small volumes of 1 M HCl and NaOH solutions. Preliminary kinetic experiments showed that this period (6 h) is enough to reach equilibrium adsorption. BAC-12 adsorbed as a function of time is shown in Fig. S2 (ESI†). All experiments were carried out at room temperature (25 ± 1 °C) and 0.01 M NaCl.The adsorption experiments of BAC-12 on A-MMT were also performed at pH 4.0 ± 0.2, 6.0 ± 0.2 and 8.0 ± 0.2 (see Fig. S3, ESI†). Since no significant changes were observed at the pH studied, it was selected pH 6.0 ± 0.2 for the rest of the experiments.
After equilibration reached, the beads were easily removed leaving a clear supernatant. Beads were kept for further analysis and the supernatants were withdrawn for surfactants and/or herbicides quantification.
For comparative purposes, BAC-12 adsorption onto MMT aqueous suspension was performed following experiments described in our previous work.34
The concentrations of PQ, 2,4-D, MM, BAC-12 and BAC-14, in the supernatant were determined by UV-vis spectroscopy using an Agilent 8453 UV-vis diode array spectrophotometer. PQ, 2,4-D and MM were quantified at 258, 283 and 233 nm respectively, and BAC-12 and BAC-14 were quantified using the dye method proposed by Few et al.45
The amounts of surfactant and herbicide adsorbed on A-MMT (Qads, in mEq g−1) were calculated using the following equation:
Adsorption isotherms of BAC-12 in presence of BAC-14 (BAC-12:BAC-14), PQ (BAC-12:PQ), 2,4-D (BAC-12:2,4-D) and MM (BAC-12:MM) on A-MMT were performed as described above. In these experiments the adsorbates were added simultaneously, and proper volumes of stock solutions were mixed to obtain the concentration ratio (1![[thin space (1/6-em)]](https://www.rsc.org/images/entities/char_2009.gif) :
:![[thin space (1/6-em)]](https://www.rsc.org/images/entities/char_2009.gif) 1), pH was kept at 6.0 ± 0.2, the ionic strength was 0.01 M NaCl and the initial concentration range studied in these binary systems were from 0.025 to 0.625 mEq L−1. The isotherms were performed in triplicate.
1), pH was kept at 6.0 ± 0.2, the ionic strength was 0.01 M NaCl and the initial concentration range studied in these binary systems were from 0.025 to 0.625 mEq L−1. The isotherms were performed in triplicate.
Results and discussion
Characterization of beads
As can be seen in Fig. S4b,† MMT clay shows two steps. The first step at 30–100 °C is attributed to the loss of free water and the second weight loss at 550–700 °C is due to the loss of structural OH.55
For A-MMT beads, the curves show an initial weight loss up to 150 °C suggesting that corresponds to the dehydration (Fig. S4c†). DTG curve shows that the thermal behavior of the A-MMT beads seems to be a combination of the behavior of AA and MMT.22
From Fig. S4† analysis it can be estimated that the residual weight percentages are 19.66, 67.97 and 84.15% for AA beads, A-MMT beads and MMT respectively after heating at 1000 °C. From these results, it can be concluded that A-MMT beads exhibit an improvement of thermal stability compared with AA beads.
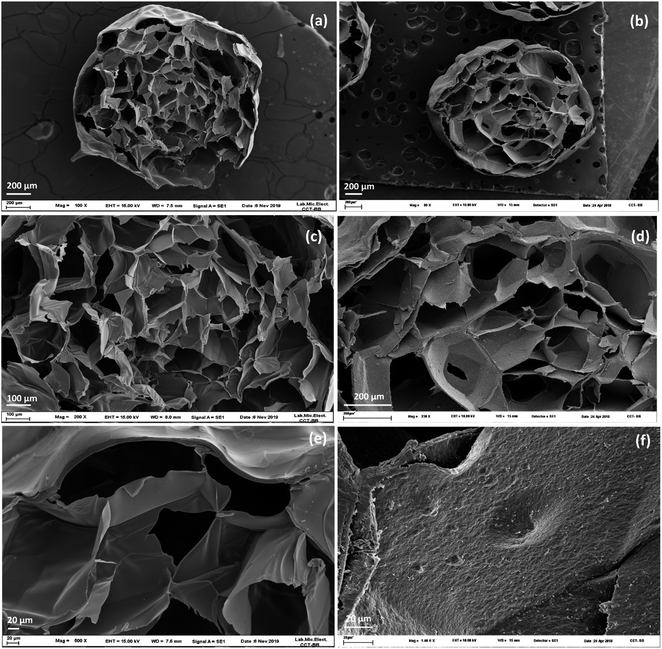
The main difference between both composites can be seen by comparing the micrographs at higher magnification (Fig. 2e vs. 2f). Fig. 2e shows thin walls and smooth surfaces14,22 while Fig. 2f shows a rough surface.57 The presence and distribution of MMT in the beads was confirmed by energy dispersive spectroscopy (EDS). Fig. S5 (ESI†) shows the EDS elemental mapping of A-MMT, the presence of elements such as Si and Al are observed both outside and inside the bead. Since these elements are the main constituents of clay, it can be assumed that MMT is distributed throughout the composite.
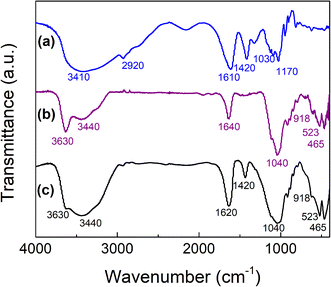
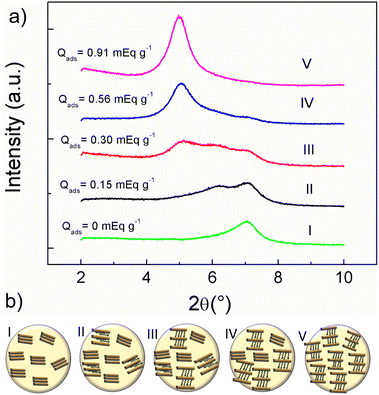
A-MMT composite beads XRD pattern (Fig. 3a-I) shows a peak at 2θ = 7.08° corresponding to a clay basal spacing d001 = 12.48 Å. Comparing this value with d001 = 12.3 Å of the MMT,34 it is observed that the biopolymer increases only by 0.18 Å the laminar spacing of the clay. This indicates that the alginate does not fully intercalate between the layers but, as shown by FTIR spectra, the carboxyl groups could interact with the edge sites of the clay thus slightly increasing the d001 without modifying its layered structure.34 Zhang et al. reported a similar increase in basal space for montmorillonite included in this type of composites.58
Fig. 3a from II to V shows that the peak is shifted to lower angles as the adsorbed amount of BAC-12 increases indicating that the basal spacing increases due to the clay expansion by the intercalation of the surfactant. These experimental data are represented in a simple scheme in Fig. 3b. Table S2 (ESI†) shows the 2θ angle and its respective d001 for all the adsorbed amount of BAC-12 studied. Fig. 3a-II shows two peaks, one of them at 2θ = 7.08° and the other at 2θ = 6.19° corresponding to 12, 48 Å and 14.27 Å of d001 respectively. The presence of two peaks indicates that within the bead, BAC-12 is adsorbed on certain sites in the clay interlayer and does not have access to other ones, probably in the core of the bead. It is known from cationic dyes adsorption on A-MMT beads that adsorption occurs by dye migration from bead surface to inner bead and that the extent of this migration depends on the initial concentration.59 Therefore, at low concentrations of BAC-12 adsorbed two clay populations with different interlaminar spacing are observed. Fig. 3a-III shows three peaks at 2θ = 7.08°, 2θ = 6.14° and 2θ = 5.23° corresponding to a basal spacing of 12.48, 14.27 and 16.89 Å, respectively. This indicates that there are three clay populations present with different interlaminar spacing, two of them correspond to clay with adsorbed BAC-12 in different molecular arrangement and there are still interlaminar clay surfaces that have not been reached by the surfactant at these concentrations.35,60 The increase in interlayer spacing from 12.48 Å to 16.89 Å is similar to those found for BAC-12 adsorption on montmorillonite in aqueous suspension for similar adsorbed amount. Remarkably, this indicates that clay as part of the composite does not modify its surface reactivity.34,38 Fig. 3a-IV shows two peaks around 2θ = 7.10° and 2θ = 5.07° corresponding to a basal spacing around 12.48 Å, and 17.3 Å, respectively demonstrating that exist two clay populations. Fig. 3a-V shows only one peak at 7.10°. This indicates that there is a unique clay population and that every interlaminar spaces contain BAC-12 intercalated with the same conformation.
Adsorption isotherms
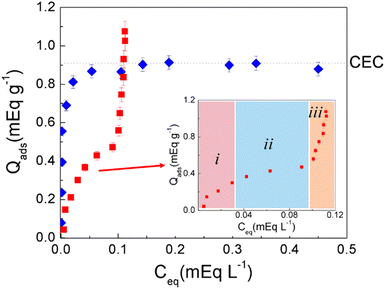
It is noteworthy that although the CMC of the BAC-12 in aqueous solution is 3.8 mM the formation of bilayers or micelles on A-MMT composite beads occurs at lower initial concentration (Ci from 0.38 to 0.625 mM). Undoubtedly the clay encapsulated within A-MMT composite bead has a significant effect on the micellization of BAC-12.
![[thin space (1/6-em)]](https://www.rsc.org/images/entities/char_2009.gif) :
:![[thin space (1/6-em)]](https://www.rsc.org/images/entities/char_2009.gif) 1) adsorption isotherms on A-MMT composite. The experimental results are clearly similar to that discussed for BAC-12 adsorbed on A-MMT (Fig. 4 red squares).
1) adsorption isotherms on A-MMT composite. The experimental results are clearly similar to that discussed for BAC-12 adsorbed on A-MMT (Fig. 4 red squares).
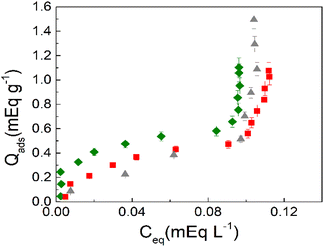 | ||
| Fig. 5 Adsorption isotherms of surfactants on A-MMT composites. BAC-12 (red squares), BAC-14 (green diamonds) and BAC-12:BAC-14 (grey triangles). | ||
It is also observed in Fig. 5 that a strong tail–tail interaction occurs at equilibrium concentration around Ceq = 0.10 mEq L−1 corresponding to Ci around 0.38 mEq L−1 for both surfactants and for the mixture of them. Considering that these surfactants have different carbon chain length, it seems clear that the clay encapsulated in the bead promotes the micellization of surfactants.
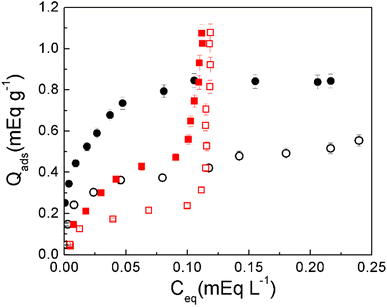 | ||
| Fig. 6 Adsorption isotherms on A-MMT composites. PQ (black circles), BAC-12 (red squares), PQ in presence of BAC-12 (empty circles) and BAC-12 in presence of PQ (empty squares). | ||
The BAC-12 adsorption isotherm on A-MMT beads (red squares) was analyzed in Fig. 4. It is noticeable in Fig. 6 that at equilibrium concentrations lower than 0.10 mEq L−1 PQ adsorbed amounts are higher than BAC-12 adsorbed amounts, this suggests that PQ has more freedom to move within the bead and is therefore more probable to reach the surface of the clay. On the other hand, at equilibrium concentrations higher than 0.10 mEq L−1 the amount of adsorbed PQ does not increase, continuing the plateau reached around Ceq = 0.05 mEq L−1. This would indicate the absence of intermolecular interactions among the adsorbed herbicide molecules.
Comparing PQ adsorbed in the absence and presence of BAC-12, it is observed that the adsorbed amount of PQ in (BAC-12:PQ) decreases in the whole range of concentrations (empty circles), this indicates that the herbicide competes with the surfactant for the same adsorption sites. Comparing BAC-12 adsorbed in the absence and presence of PQ, a decrease in the adsorbed amount of BAC-12 in (BAC-12:PQ) is observed when the equilibrium concentrations are less than around 0.10 mEq L−1. At higher values of this Ceq no changes in adsorption behavior are observed. These results indicate that, at low concentrations the adsorption of BAC-12 onto the composite is governed by electrostatic interactions while at higher concentrations the adsorption is governed by hydrophobic interactions of the surfactant tails. Fig. S6a (ESI†) shows the adsorption isotherms of BAC-12 in absence and presence of 2,4-D (BAC-12:2,4-D) and of MM (BAC-12:MM). As can be seen, BAC-12 shows the same behavior in presence and absence of anionic herbicides. These results indicate that 2,4-D and MM do not affect BAC-12 adsorption on A-MMT composites because they do not have affinity for the clay surface due to their negative charge. Fig. S6b† shows that neither 2,4-D nor MM adsorb on A-MMT. On the other hand, the inset in Fig. S6b† shows that the BAC-12 presence slightly affects the adsorption of 2,4-D at equilibrium concentrations above 0.36 mEq L−1. This behavior may be due to the hydrophobic interaction of the aromatic ring of 2,4-D with the surfactant tails. These types of interactions are responsible for the adsorption of organic molecules on organoclays.64
Conclusions
This work explores through the adsorption of a cationic surfactant the surface reactivity of montmorillonite included in an alginate hydrogel composite. These studies demonstrated that the clay is capable of adsorbing cationic surfactants even when it is part of a composite. Furthermore, it is noteworthy that XRD was a powerful tool to elucidate the surface reactivity of the clay encapsulated in the hydrogel and thus understand the adsorption process of cationic substances inside the composite. Besides, the diffractograms showed that the 2θ angle of the clay remained at 7.08° (d001 = 12.48 Å) while other peaks, up to a total of 3, occurred as the adsorbed amount of surfactant increased. Finally, at the maximum concentration studied, only one peak was observed around 4.89° (d001 = 17.91 Å). This evidenced the presence of different clay populations inside the bead at different concentrations of adsorbed surfactant. At present, no similar results have been reported. In addition, it is important to note that the increase from 12.48 Å to 17.91 Å of the basal spacing coincides with that obtained in our previous work with the adsorption of the same surfactant on clay in aqueous suspension.Although the reactivity of the clay within the composite is not affected, its encapsulation in a hydrogel promotes tail–tail interaction of the BAC-12 at much lower concentrations of its CMC.
Regarding the effect of the presence of cationic biocides on the adsorption of BAC-12, it was observed that at low concentrations they compete for the adsorption sites, indicating electrostatic interaction between the surfactant and the clay, while at high concentrations the competition does not take place since the hydrophobic interactions of this surfactant govern. As for the presence of anionic biocides, no appreciable changes in surfactant adsorption were observed.
The results of this article show that the alginate biopolymer allows the formation of composites in which the surface reactivity of the encapsulated solid retains its reactivity. This gives these composites a great potential for their use in water remediation.
Conflicts of interest
There are no conflicts to declare.Acknowledgements
The authors gratefully acknowledge the financial support of Consejo Nacional de Investigaciones Científicas y Técnicas (CONICET; PIP 11220200102819CO), Ministerio de Ciencia, Tecnología e Innovación (PICT, 2020-SERIEA-03920) and Universidad Nacional del Sur (PGI-UNS-24/Q093). Danielle Silva do Nascimento thanks CONICET for postdoctoral fellowship.Notes and references
- M. Hassan, A. K. Deb, F. Qi, Y. Liu, J. Du, A. Fahy, M. A. Ahsan, S. J. Parikh and R. Naidu, J. Cleaner Prod., 2021, 319, 128694 CrossRef CAS.
- T. K. Das, Q. Scott and A. N. Bezbaruah, Chemosphere, 2021, 281, 130837 CrossRef CAS PubMed.
- B. Ates, S. Koytepe, A. Ulu, C. Gurses and V. K. Thakur, Chem. Rev., 2020, 120, 9304–9362 CrossRef CAS.
- M. Hnamte and A. K. Pulikkal, Chemosphere, 2022, 307, 135869 CrossRef CAS.
- M. J. Avena and C. P. De Pauli, J. Colloid Interface Sci., 1998, 202, 195–204 CrossRef CAS.
- C. V. Lazaratou, D. V. Vayenas and D. Papoulis, Appl. Clay Sci., 2020, 185, 105377 CrossRef CAS.
- C. Zhou, D. Tong and W. Yu, Smectite nanomaterials: Preparation, properties, and functional applications, Elsevier Inc., 2019 Search PubMed.
- H. Yang, W. Wang, J. Zhang and A. Wang, Int. J. Polym. Mater. Polym. Biomater., 2013, 62, 369–376 CrossRef CAS.
- M. Wu, S. Zhao, M. Tang, R. Jing, Y. Shao, X. Liu, Y. Dong, M. Li, Q. Liao, G. Lv, Q. Zhang, Z. Meng and A. Liu, Colloids Surf., A, 2019, 575, 264–270 CrossRef CAS.
- F. Bergaya, B. K. G. Theng and G. Lagaly, Handbook of Clay Science, 2006, vol. 1 Search PubMed.
- M. Sarkar and K. Dana, J. Mol. Struct., 2022, 1256, 132468 CrossRef CAS.
- C. V. L. Natarelli, P. I. C. Claro, K. W. E. Miranda, G. M. D. Ferreira, J. E. de Oliveira and J. M. Marconcini, SN Appl. Sci., 2019, 1, 1212 CrossRef CAS.
- L. Pinto, M. A. Bonifacio, E. De Giglio, E. Santovito, S. Cometa, A. Bevilacqua and F. Baruzzi, Food Packag. Shelf Life, 2021, 28, 100676 CrossRef CAS.
- R. da Silva Fernandes, M. R. de Moura, G. M. Glenn and F. A. Aouada, J. Mol. Liq., 2018, 265, 327–336 CrossRef CAS.
- Z. Tong, Y. Chen, Y. Liu, L. Tong, J. Chu, K. Xiao, Z. Zhou, W. Dong and X. Chu, Mar. Drugs, 2017, 15, 91 CrossRef PubMed.
- M. S. Hasnain and A. K. Nayak, Alginate-inorganic composite particles as sustained drug delivery matrices, Elsevier Inc., 2018 Search PubMed.
- I. P. S. Fernando, W. W. Lee, E. J. Han and G. Ahn, Chem. Eng. J., 2020, 391, 123823 CrossRef CAS.
- C. V. Waiman, J. Natera, W. A. Massad and G. P. Zanini, Dyes Pigm., 2020, 177, 108281 CrossRef CAS.
- A. Olad and F. Farshi Azhar, Desalin. Water Treat., 2014, 52, 2548–2559 CrossRef CAS.
- A. Oussalah and A. Boukerroui, Euro-Mediterr. j. environ. integr., 2020, 5, 31 CrossRef.
- G. Pandey, M. Tharmavaram, N. Khatri and D. Rawtani, Microporous Mesoporous Mater., 2022, 346, 112288 CrossRef CAS.
- M. Etcheverry, V. Cappa, J. Trelles and G. Zanini, J. Environ. Chem. Eng., 2017, 5, 5868–5875 CrossRef CAS.
- J. B. F. N. Engberts, Angew. Chem., Int. Ed., 2005, 44, 5922 CrossRef CAS.
- Y. Nakama, in Cosmetic Science and Technology, Elsevier, 2017, pp. 231–244 Search PubMed.
- K. Holmberg, B. Jönsson, B. Kronberg and B. Lindman, Surfactants and Polymers in Aqueous Solution, Wiley, 2nd edn, 2002 Search PubMed.
- A. H. Khan, S. M. Macfie and M. B. Ray, J. Environ. Manage., 2017, 196, 26–35 CrossRef CAS PubMed.
- S. Paria, Adv. Colloid Interface Sci., 2008, 138, 24–58 CrossRef CAS PubMed.
- G. P. Zanini, R. G. Ovesen, H. C. B. Hansen and B. W. Strobel, J. Environ. Manage., 2013, 128, 100–105 CrossRef CAS PubMed.
- A. Klimonda and I. Kowalska, Water Sci. Technol., 2019, 79, 1241–1252 CrossRef CAS PubMed.
- EU Reference Laboratories for Residues of Pesticides, EU Ref. Lab. Pestic. Requiring Single Residue Methods, 2016, 5, pp. 1–6 Search PubMed.
- B. M. P. Pereira and I. Tagkopoulos, Appl. Environ. Microbiol., 2019, 85, 1–27 Search PubMed.
- G. Nabi, Y. Wang, Y. Hao, S. Khan, Y. Wu and D. Li, Environ. Res., 2020, 188, 109916 CrossRef CAS PubMed.
- H. M. Dewey, J. M. Jones, M. R. Keating and J. Budhathoki-Uprety, ACS Chem. Health Saf., 2022, 29, 27–38 CrossRef CAS.
- R. Ilari, M. Etcheverry, C. V. Waiman and G. P. Zanini, Colloids Surf., A, 2021, 611, 125797 CrossRef CAS.
- R. Atkin, V. S. J. Craig, E. J. Wanless and S. Biggs, Adv. Colloid Interface Sci., 2003, 103, 219–304 CrossRef CAS PubMed.
- B. J. Heyde, S. P. Glaeser, L. Bisping, K. Kirchberg, R. Ellinghaus, J. Siemens and I. Mulder, Sci. Rep., 2020, 10, 15397 CrossRef CAS PubMed.
- C. Zhang, F. Cui, G. ming Zeng, M. Jiang, Z. zhu Yang, Z. gang Yu, M. ying Zhu and L. qing Shen, Sci. Total Environ., 2015, 518–519, 352–362 CrossRef CAS PubMed.
- R. Ilari, M. Etcheverry, C. Zenobi and G. Zanini, Int. J. Environ. Health, 2014, 7, 70 CrossRef CAS.
- L.-L. Zhang, A. Zaoui, W. Sekkal and Y.-Y. Zheng, J. Hazard. Mater., 2022, 442, 130107 CrossRef.
- Y. Son, Y. Kim, S. Bae, T.-H. Kim and Y. Hwang, SSRN Electron. J., 2022, 10, 108778 CAS.
- L. Han, T. Wang, J. Gong, X. Li, Y. Ji and S. Wang, Colloids Surf., A, 2022, 650, 129542 CrossRef CAS.
- B. Lombardi, M. Baschini and R. M. Torres Sánchez, Appl. Clay Sci., 2003, 22, 309–312 CrossRef CAS.
- B. Lombardi, M. Baschini and R. M. Torres Sánchez, J. Argent. Chem. Soc., 2002, 90, 87–99 CAS.
- R. T. Morrison and R. N. Boyd, Organic Chemistry, Prentice Hall PTR, 1998 Search PubMed.
- A. V. Few and R. H. Ottewill, J. Colloid Sci., 1956, 11, 34–38 CrossRef CAS.
- G. Lawrie, I. Keen, B. Drew, A. Chandler-Temple, L. Rintoul, A. Peter Fredericks and L. Grøndahl, Biomacromolecules, 2007, 8, 2533–2541 CrossRef CAS PubMed.
- T. Jiang, Q. Zhao and H. Yin, Appl. Clay Sci., 2007, 35, 155–161 CrossRef CAS.
- P. Praus, M. Turicová, S. Študentová and M. Ritz, J. Colloid Interface Sci., 2006, 304, 29–36 CrossRef CAS PubMed.
- S. Barreca, S. Orecchio and A. Pace, Appl. Clay Sci., 2014, 99, 220–228 CrossRef CAS.
- P. M. Amarasinghe, K. S. Katti and D. R. Katti, J. Colloid Interface Sci., 2009, 337, 97–105 CrossRef CAS PubMed.
- E. M. Pecini and M. J. Avena, Langmuir, 2013, 29, 14926–14934 CrossRef CAS PubMed.
- P. Laurienzo, M. Malinconico, A. Motta and A. Vicinanza, Carbohydr. Polym., 2005, 62, 274–282 CrossRef CAS.
- A. A. Said, M. M. M. Abd El-Wahab and R. M. Hassan, Thermochim. Acta, 1994, 233, 13–24 CrossRef CAS.
- A. A. Said and R. M. Hassan, Polym. Degrad. Stab., 1993, 39, 393–397 CrossRef CAS.
- M. Földvári, Handbook of thermogravimetric system of minerals and its use in geological practice, 2011, vol. 213 Search PubMed.
- X. Zhang, K. Wang, J. Hu, Y. Zhang, Y. Dai and F. Xia, J. Mater. Chem. A, 2020, 8, 25390–25401 RSC.
- W. D. Keller, R. C. Reynolds and A. Inoue, Clays Clay Miner., 1986, 34, 187–197 CrossRef.
- H. Zhang, Y. Shi, X. Xu, M. Zhang and L. Ma, ACS Omega, 2020, 5, 10068–10076 CrossRef CAS PubMed.
- M. A. Dominguez, M. Etcheverry and G. P. Zanini, Adsorption, 2019, 25, 1387–1396 CrossRef CAS.
- A. Tahani, M. Karroua, H. Van Damme, P. Levitz and F. Bergaya, J. Colloid Interface Sci., 1999, 216, 242–249 CrossRef CAS PubMed.
- G. Rytwo, S. Nir and L. Margulies, J. Colloid Interface Sci., 1996, 181, 551–560 CrossRef CAS.
- G. Rytwo and M. Tavasi, Pest Manage. Sci., 2003, 59, 1265–1270 CrossRef CAS PubMed.
- D. L. Sparks, Environmental soil chemistry, Academic Press, Elsevier, 2nd edn, 2003 Search PubMed.
- Y. Xi, M. Mallavarapu and R. Naidu, Appl. Clay Sci., 2010, 49, 255–261 CrossRef CAS.
Footnote |
| † Electronic supplementary information (ESI) available. See DOI: https://doi.org/10.1039/d2ra07405b |
| This journal is © The Royal Society of Chemistry 2022 |


