
 Open Access Article
 This Open Access Article is licensed under a Creative Commons Attribution-Non Commercial 3.0 Unported Licence
A carboxylesterase-activatable near-infrared phototheranostic probe for tumor fluorescence imaging and photodynamic therapy†
Lihong Li *abc,
Qi Zhangac,
Jiaojiao Liac,
Yafei Tianac,
Jinyao Liac,
Wen Liubc and
Haipeng Diao*abc
*abc,
Qi Zhangac,
Jiaojiao Liac,
Yafei Tianac,
Jinyao Liac,
Wen Liubc and
Haipeng Diao*abc
aDepartment of Biochemistry and Molecular Biology, Shanxi Medical University, Taiyuan 030001, PR China. E-mail: lilh@sxmu.edu.cn; diaohp@sxmu.edu.cn
bKey Laboratory of Cellular Physiology (Shanxi Medical University), Ministry of Education, PR China
cCollege of Basic Medical Sciences, Shanxi Medical University, Taiyuan 030001, PR China
First published on 12th December 2022
Abstract
Phototheranostic probes have been proven to be a promising option for cancer diagnosis and treatment. However, near-infrared phototheranostic probes with specific tumor microenvironment responsiveness are still in demand. In this paper, a carboxylesterase (CES)-responsive near-infrared phototheranostic probe was developed by incorporating 6-acetamidohexanoic acid into a hemicyanine dye through an ester bond. The probe exhibits highly sensitive and selective fluorescence enhancement towards CES because CES-catalyzed cleavage of the ester bond leads to the release of the fluorophore. By virtue of its near-infrared analytical wavelengths and high sensitivity, the probe has been employed for endogenous CES activatable fluorescence imaging of tumor cells. Moreover, under 660 nm laser irradiation, the probe can generate toxic reactive oxygen species and efficiently kill tumor cells, with low cytotoxicity in dark. As far as we know, the probe was the first CES-responsive phototheranostic probe with both near-infrared analytical wavelengths and photosensitive capacity, which may be useful in the real-time and in situ imaging of CES as well as imaging-guided photodynamic therapy of tumors. Therefore, the proposed probe may have wide application prospect in cancer theranostics.
Introduction
Phototheranostics, characterized by integrating photoinduced imaging and concurrent therapy into a system, has attracted much attention in the field of cancer theranostics. Among optical diagnostics, fluorescence imaging has the advantages of excellent sensitivity, easy operation, fast response and so on. In particular, fluorescence imaging with near-infrared (NIR) wavelength (650–900 nm) is more favorable for biomedical diagnosis due to the deeper tissue penetration, less photodamage, and lower background fluorescence disturbance.1–5 For photoinduced therapeutics, photodynamic therapy (PDT) is capable of killing cancer cells selectively by generating venenous singlet oxygen under laser irradiation, without noticeable damage to normal tissues in dark.6–8 The merits, including minimal invasiveness, precise controllability and negligible drug resistance, have made PDT a promising therapeutic option for cancer. Therefore, developing novel phototheranostic probes with fluorescence imaging-guided PDT is rather beneficial to tumor diagnosis and efficient treatment.Moreover, the phototheranostic probe responding to specific tumor microenvironment is the ideal agent for cancer diagnosis and therapy because of the improved tumor specificity. Such phototheranostic probe is generally activated by an endogenous initiator in tumor cells, such as hypoxia,9–11 acidic pH,12–14 abundant thiol species,15–17 reactive oxygen species,18,19 and some overexpressed enzymes.20–23 Carboxylesterase (CES) is one of the overexpressed enzymes in various tumor cells, which can catalyze the hydrolysis of carboxylic esters and be in action in the growth, invasion, as well as metastasis of malignant tumors.24–26 CES has thus been regarded as a potential target for tumor theranostics, and several CES-activated prodrugs for chemotherapy have been reported.27–32 Besides, some CES-responsive fluorescence probes for single imaging were proposed.33–45 These probes were generally designed by incorporating varied substrates with carboxyl groups into fluorophores with hydroxyl groups, which displayed rational sensitivity and selectivity toward CES. They have been used for bioimaging at cellular level or in vivo, verifying the feasibility of such sensing strategy. However, most of these probes had relatively low emission wavelength (<650 nm), and CES-responsive photo-theranostic probe with NIR analytical wavelengths is still absent.
Herein, a CES-responsive phototheranostic probe HCH-AcAH (Scheme 1) was developed for activatable NIR fluorescence imaging and PDT of tumor cells. HCH-AcAH was synthesized by incorporating 6-acetamidohexanoic acid (AcAH) into the hemicyanine skeleton HCH via an ester bond. HCH was selected owing to its NIR analytical wavelengths, tunable fluorescence signal, superior photosensitive capacity, and high stability.46–48 The probe has almost no fluorescence signal due to the esterification of hydroxyl in HCH, which is desirable for sensitive detection. However, reaction with CES triggers the cleavage of ester bond, accompanied with the release of the fluorophore HCH and concomitant fluorescence enhancement, which results in the development of a sensitive and selective means for CES detection. Moreover, the released HCH also possesses photodynamic capacity, thereby damaging tumor cells. HCH-AcAH has been used not only for activatable fluorescence imaging of tumor cells with overexpressed CES, but also to efficiently killing tumor cells via photodynamic effect.
 | ||
| Scheme 1 The structure and response mechanism of HCH-AcAH to CES. | ||
Experimental
Reagents and apparatus
CES was purchased from Sigma-Aldrich. IR-780 iodide and AcAH were purchased from J&K Scientific Co., Ltd (Beijing, China). Resorcinol and propidium iodide (PI) were obtained from Aladdin Biochemical Technology Co., Ltd (Shanghai, China). Dulbecco's modified Eagle's medium (DMEM), fetal bovine serum (FBS), trypsin, glutathione (GSH), 2,7-dichlorodihydrofluorescein diacetate (DCFH-DA), 3-(4,5-dimethyl-2-thiazolyl)-2,5-diphenyl-2H-tetrazolium bromide (MTT), and calcein acetoxymethyl ester (calcein-AM) were obtained from Solarbio Science & Technology Co., Ltd (Beijing, China). All the inorganic salts used were purchased from Beijing Chemical Industry Co., Ltd (Beijing, China). Human cervical cancer cell line (HeLa cell) was derived from Cell Bank of Chinese Academy of Sciences (Shanghai, China). Ultrapure water (over 19 MΩ cm) was produced by Heal Force (China).1H and 13C NMR spectra were scanned on an AVANCE III spectrometer (Bruker, Germany). High-resolution electrospray ionization mass spectrometry (HR-ESI-MS) was carried out using APEX IV FTMS instrument (Bruker Daltonics). An F-7000 fluorescence spectrophotometer (Hitachi, Japan) was used to record fluorescence spectra. A UH5300 UV-visible spectrophotometer (Hitachi, Japan) was employed to collect the absorption spectra. A SpectraMax190 microplate reader (Molecular Devices, USA) was used to determine the absorbance in MTT assay. Fluorescence imaging was conducted with an Eclipse Ts2 fluorescence microscope (Nikon, Japan). Confocal fluorescence imaging was performed on an FV 3100-IX83 confocal laser scanning microscope (Olympus, Japan).
Synthesis and characterization of the probe HCH-AcAH
The synthesis route of the probe HCH-AcAH was shown in Scheme S1†. HCH was prepared according to our previous method.34 Then, HCH (82 mg, 0.2 mmol) was added to a mixture of AcAH (52 mg, 0.3 mmol), 1-ethyl-3-(3-dimethylaminopropyl)carbodiimide hydro-chloride (69 mg, 0.36 mmol) and 4-dimethylaminopyridine (4 mg, 0.32 mmol) in CH2Cl2 (6 mL). The reaction mixture was stirred for 1 h at ambient temperature. After evaporating the solvent under reduced pressure, the residue was further purified by column chromatography with CH2Cl2/CH3OH as eluents, affording HCH-AcAH as a purple solid (28 mg, yield 24%). HR-ESI-MS: m/z calcd for HCH-AcAH (C36H42N2O4+, M+), 567.3217; found, 567.3214 (Fig. S1†). 1H and 13C NMR spectra were shown in Fig. S2 and S3,† respectively. 1H NMR (400 MHz, 298 K, CDCl3): δ 8.68 (d, 1H, J = 15.2 Hz), 7.75 (s, 1H), 7.61 (d, 1H, J = 7.6 Hz), 7.48 (m, 4H), 7.23 (s, 1H), 7.14 (s, 1H), 7.04 (m, 1H), 6.62 (d, 1H, J = 15.2 Hz), 4.50 (t, 2H, J = 6.8 Hz), 3.28 (q, 2H, J = 6.8 Hz), 2.76 (m, 4H), 2.64 (t, 2H, J = 7.2 Hz), 2.44 (s, 2H), 2.07 (s, 3H), 1.99 (m, 4H), 1.83 (s, 6H), 1.66 (m, 2H), 1.50 (m, 2H), 1.11 (t, 3H, J = 7.2 Hz).13C NMR (100 MHz, 298 K, CDCl3): δ 178.6, 171.8, 171.1, 160.5, 153.1, 150.6, 146.5, 142.2, 141.3, 132.0, 131.6, 129.9, 129.4, 128.4, 128.1, 122.9, 119.5, 115.1, 113.2, 109.7, 105.5, 51.2, 47.6, 39.3, 34.3, 29.5, 29.1, 28.3, 26.4, 24.5, 24.4, 23.4, 21.6, 20.3, 11.6.General procedure for CES detection
A certain amount of HCH-AcAH was dissolved in DMSO to prepare the storage solution (1 mM). For detecting the response of HCH-AcAH to CES, HCH-AcAH (10 μM) was mixed with different concentrations of CES in PBS (pH 7.4). After incubation at 37 °C for 6 min, the reaction system was subjected to fluorescence measurement with λex/em = 680/710 nm. As a control, HCH-AcAH in the absence of CES was determined under the same conditions.ROS evaluation
To evaluate the ROS generation ability of the reaction system in vitro, DCFH-DA was utilized as the ROS indicator. The reaction system was first made by reacting HCH-AcAH (1 μM) with CES (200 U L−1) at 37 °C for 6 min. Then, the activated DCFH-DA (1 μM) was added, and the mixture was exposed to 660 nm laser irradiation. The fluorescence spectra were monitored with λex = 485 nm. For comparison, DCFH-DA alone was observed under the same condition.Confocal fluorescence imaging of endogenous CES in HeLa cells
HeLa cells were inoculated and grew with adherence for 24 h. The culture medium was discarded and the cells were cleaned with PBS (pH 7.4) three times. Then, the cells were incubated with HCH-AcAH (10 μM) for 10 min. For the inhibitor study, the cells were pretreated with inhibitor triphenyl phosphate (TPP, 10 μM) for 1 h before incubation with HCH-AcAH. The imaging was carried out on a confocal laser scanning microscope with 635 nm excitation and 650–750 nm emission.Cytotoxicity evaluation
The dark and photo toxicity of HCH-AcAH to cells was determined by standard MTT assay.10 After digestion and centrifugation, HeLa cells were collected, counted, and inoculated in 96-well plates with a density of 7000–10000 cells per well. Cells were incubated at 37 °C for 24 hours. Different concentrations of HCH-AcAH (1–30 μM) in DMEM were added to each well and co-incubated with cells for 12 h. The media were replaced by fresh DMEM. Then, the cells in the group with laser were exposed to 660 nm laser irradiation (0.25 W cm−2) for 10 min, while the control group was placed in dark. After removing the old media, 100 μL MTT solution (0.5 mg mL−1) was added and incubated for another 4 h. The supernatant was discarded and DMSO (100 μL) was added. Finally, the absorbance at 490 nm was measured, and the cell viability was calculated.Calcein-AM/PI staining of cells
Adherent HeLa cells were incubated with HCH-AcAH (10 μM) at 37 °C for 10 min. After washed with PBS, the group with laser was irradiated by 660 nm laser (0.25 W cm−2) for 10 min, while the control group without laser was kept away from light. Then, cells in each group were treated by calcein-AM (4 μM) and PI (100 μg mL−1). After 20 min, the cells were washed and photographed with a fluorescence microscope.Results and discussion
Spectral properties of HCH-AcAH reacting with CES
The spectral changes of HCH-AcAH before and after reacting with CES were first studied. In the UV-vis absorption spectra (Fig. 1A), it was observed that HCH-AcAH had a maximum absorption peak at 585 nm, with two shoulder peaks at 553 and 628 nm, respectively (curve a). After interacting with CES, the maximum absorption peak shifted to 680 nm (curve b), along with the color of the solution changing from purple to blue (inset in Fig. 1A). Meanwhile, HCH-AcAH itself was nearly nonfluorescent due to the blocking of hydroxyl in HCH.46 However, addition of CES induced strong fluorescence signal at 710 nm (Fig. 1B). Such significant fluorescence enhancement was highly favorable for the sensitive detection of CES. Moreover, both the absorption and fluorescence spectra of HCH-AcAH after reacting with CES resembled those of the fluorophore HCH (Fig. S4†), hinting that the reaction with CES triggered the release of HCH, thereby leading to the fluorescence enhancement. The formation of HCH was also verified by HR-ESI-MS analysis (Fig. S5†). The mass spectrum of the reaction solution showed a prominent peak at m/z = 412.2271, indicating the generation of the fluorophore HCH.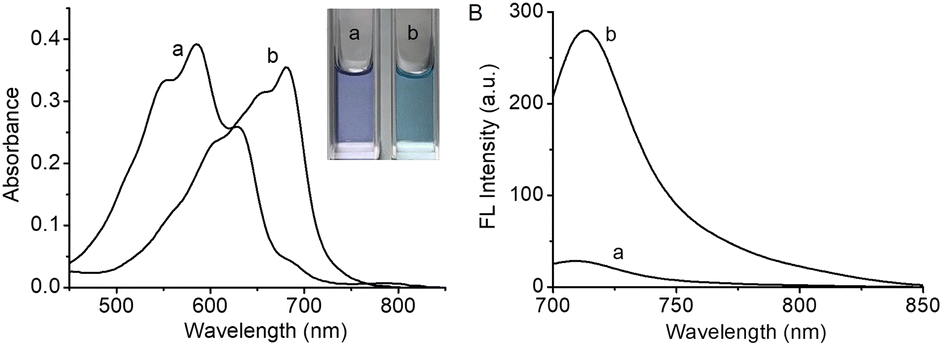 | ||
| Fig. 1 The absorption (A) and fluorescence (B) spectra of HCH-AcAH (10 μM) before (a) and after (b) reacting with CES (200 U L−1). λex = 680 nm. | ||
The influences of reaction time, temperature, and pH on the reaction system were then explored. The reaction kinetic curves (Fig. S6A†) showed that higher concentrations of CES induced quicker reaction rates and stronger fluorescence signals, and the fluorescence reached an approximate plateau within 6 min. By contrast, the fluorescence of HCH-AcAH itself had little change during the same period, suggesting the good stability of the probe in an aqueous environment. The fluorescence signal of either the probe or the reaction system was barely affected by the temperature increasing from 20 to 45 °C (Fig. S6B†). In addition, the strongest fluorescence enhancement was achieved at pH 7 (Fig. S6C†), which was attributed to the effects of pH on the fluorescence signal of HCH-AcAH and HCH, as well as the enzymatic activity of CES. The above results indicated that HCH-AcAH was suitable for the quick detection of CES at normal physiological conditions (37 °C, pH 7.4), which was thus employed in this work.
Under the above conditions, the fluorescence spectra of HCH-AcAH reacting with varying concentrations of CES were monitored. As depicted in Fig. 2, higher concentrations of CES induced larger fluorescence enhancement, and a good linearity could be achieved in the range of 5–40 U L−1, with a linear equation of ΔF = 3.75 × C + 19.92 (R = 0.988), where ΔF means the fluorescence difference with and without CES. Using the formula 3s/m (s is the standard deviation of blank determinations, n = 11, and m is the slope of the linear equation), the detection limit was 0.712 U L−1, which was lower than the existed NIR fluorescent probes for CES.39,40
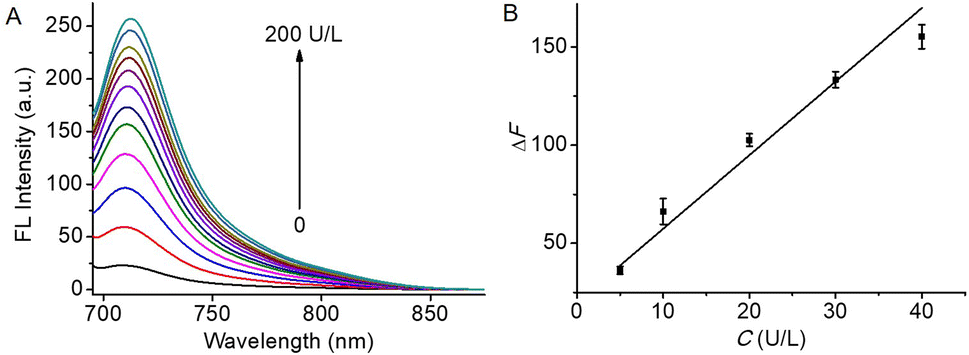 | ||
| Fig. 2 (A) Fluorescence responses of HCH-AcAH (10 μM) to varying concentrations of CES (0, 5, 10, 20, 30, 40, 50, 60, 70, 80, 100, and 200 U L−1). (B) Linear fitting curve of ΔF toward the content (C) of CES from 5 to 40 U L−1. λex/em = 680/710 nm. | ||
Next, the selectivity of HCH-AcAH for CES was evaluated by testing some probable coexisting substances covering inorganic salts (CaCl2, FeCl3, CuSO4, and MgCl2), amino acids (cysteine, tyrosine, proline, and methionine), ascorbic acid, GSH, and several enzymes (nitroreductase and hyaluronidase). The results (Fig. S7†) manifested that species except for CES scarcely affected the fluorescence signal of the probe, implying the excellent specificity of probe HCH-AcAH towards CES, which was ascribed to the specific cleavage of the ester bond by CES.
To further verify that the enhanced fluorescence resulted from the CES-mediated hydrolyzation, the effect of TPP, an inhibitor of CES,49 was studied on the enzyme's activity. As was seen in Fig. S8†, 100 nM and 500 nM TPP reduced 45 and 71% of the fluorescence intensity compared with the fluorescence in the absence of TPP (curve b), respectively, demonstrating that the fluorescence off-on response was indeed triggered by CES-catalyzed cleavage.
In order to evaluate the photodynamic effect of the reaction system, DCFH-DA was utilized to indicate the formation of ROS. As depicted in Fig. 3, upon the addition of DCFH-DA and irradiation with 660 nm laser, the reaction system showed gradually increased fluorescence at 525 nm with a dependency on the irradiation time. As a control, the fluorescence of DCFH-DA itself scarcely varied under the same condition, verifying the laser-induced generation of ROS in the reaction system of HCH-AcAH and CES. In addition, HCH-AcAH itself also induced the formation of ROS (Fig. S9†). Even so, due to the precise controllability of the laser irradiation, HCH-AcAH may have great potential in the selective PDT of tumor with overexpressed CES.
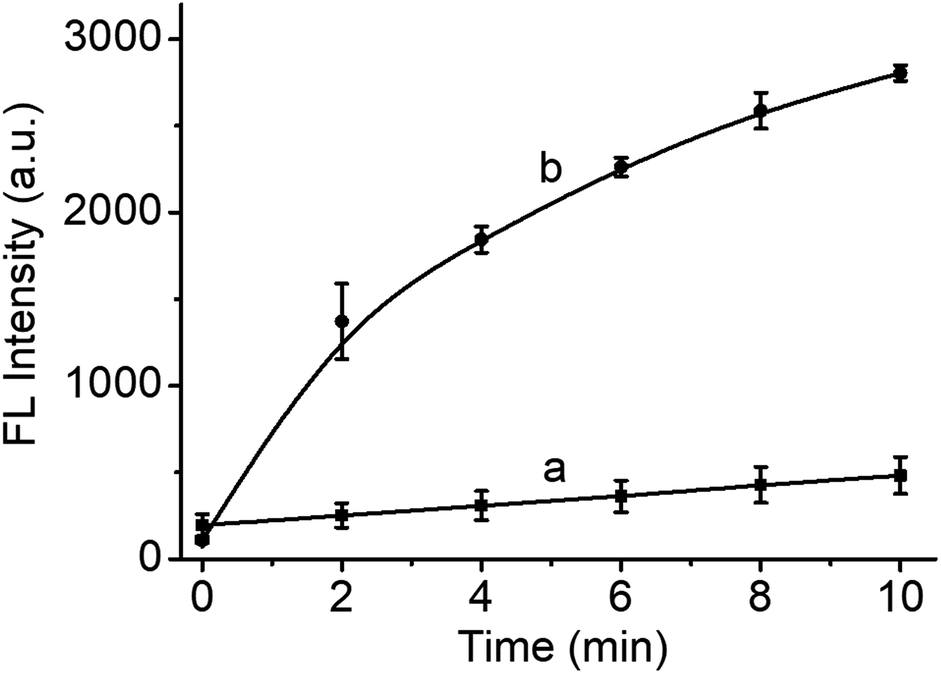 | ||
| Fig. 3 Fluorescence changes of DCFH-DA in PBS (a) or in the reaction solution (b) of HCH-AcAH (1 μM) and CES (200 U L−1) upon 660 nm laser (0.25 W cm−2) for different irradiation time (0–10 min). λex/em = 485/525 nm. | ||
Fluorescence imaging of endogenous CES in living cells
Encouraged by the high sensitivity and selectivity as well as the NIR analytical wavelengths of HCH-AcAH, we further explored its applicability in the real-time imaging of endogenous CES in living cells. It has been reported that CES was overexpressed in various tumors, including cervical cancer and liver cancer.50–52 And cervical cancer cell line HeLa has been used as the model cell in many studies on CES.33,39–41 Hence HeLa cells were chosen in the following cellular study. As shown in Fig. 4, HeLa cells alone emitted no background fluorescence, which profited from the long excitation wavelength (635 nm). However, upon treatment with HCH-AcAH, bright red fluorescence was observed in the cytoplasm of HeLa cells, with negligible fluorescence in the nucleus. The reason for this phenomenon may be the location behaviors of CES35 and the generated fluorophore HCH, which mainly resided in the cytoplasm instead of nucleus (Fig. S10†). Moreover, the fluorescence signal in cells with TPP (inhibitor of CES) pre-incubation was largely depressed (group c in Fig. 4), revealing the enhanced fluorescence in HeLa cells must be ascribed to the endogenous CES. Thus, the probe has great potential in imaging tumor cells with overexpressed CES.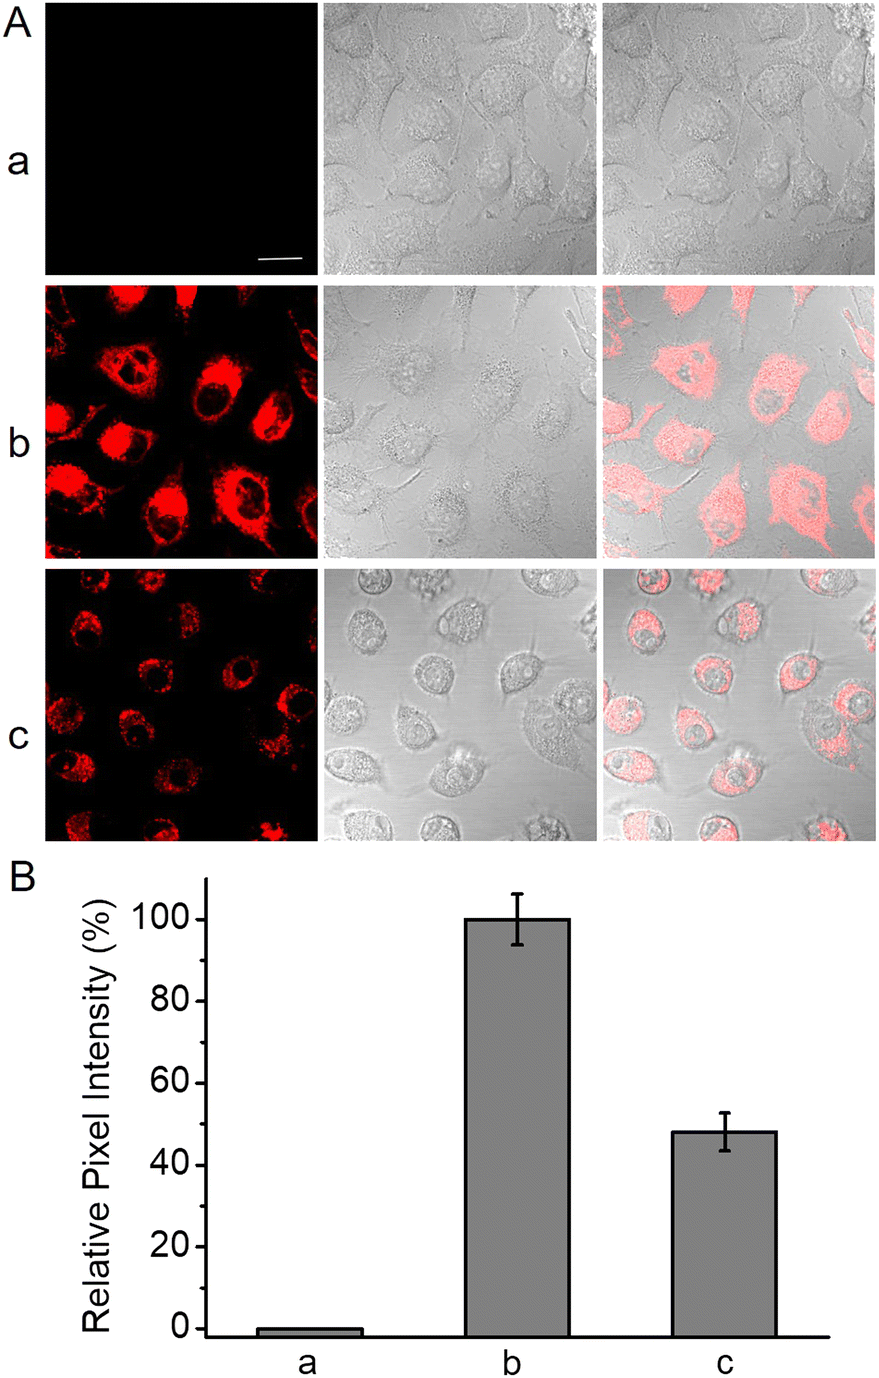 | ||
| Fig. 4 (A) Fluorescence images of HeLa cells. (a) HeLa cells only (control), (b) HeLa cells incubated with HCH-AcAH (10 μM) for 10 min, (c) HeLa cells were pretreated with TPP (10 μM) for 1 h before incubation with HCH-AcAH (10 μM) for 10 min. Scale bar, 20 μm. (B) Relative pixel intensity of the corresponding images in panel A (the pixel intensity from image (b) is defined as 100%). The results are the mean ± standard deviation of three separate measurements. | ||
PDT capacity of HCH-AcAH at the cellular level
Given the ROS generation and cell membrane permeability of HCH-AcAH, its PDT capacity at the cellular level was investigated. With DCFH-DA as the ROS imaging agent, we monitored the ROS formation in HCH-AcAH treated cells (Fig. S11†). The cells with either HCH-AcAH incubation or laser irradiation showed no remarkable fluorescence, indicating the probe or laser alone could not generate ROS. However, upon exposure to 660 nm laser for 10 min, the HCH-AcAH incubated cells exhibited intense green fluorescence, which is the direct evidence of ROS formation in cells. Whereafter, the cell viability was assessed with MTT and calcein-AM/PI staining assays. As can be seen in Fig. 5A, HeLa cells incubated with HCH-AcAH without laser kept relatively high viability (about 80%) even at the concentration of 30 μM, suggesting the low cytotoxicity of the probe in dark. However, once the HCH-AcAH treated cells were irradiated by 660 nm laser, the survival rates significantly reduced with concentration-dependency, which was attributed to the PDT effect of the probe. Consistent results were obtained from calcein-AM/PI staining (Fig. 5B). HCH-AcAH or laser alone could barely affect the cell viability owing to the intense green and negligible red fluorescence in cells, implying the low dark cytotoxicity of HCH-AcAH and high safety of laser used in this work. On the contrary, laser irradiation on HCH-AcAH treated cells induced bright red intracellular fluorescence, indicative of dead cells.10 These observations suggested that the probe HCH-AcAH possessed excellent PDT capacity at the cellular level. | ||
| Fig. 5 (A) Viability of HCH-AcAH treated HeLa cells without or with 660 nm laser irradiation (0.25 W cm−2, 10 min). The viability of cells in the absence of HCH-AcAH and laser irradiation was defined as 100%. (B) Fluorescence images of calcein-AM/PI staining HeLa cells after different treatments. Scale bar, 100 μm. | ||
Conclusions
In summary, the first NIR phototheranostic probe HCH-AcAH was developed for CES-activatable tumor fluorescence imaging and concomitant PDT. The probe showed highly sensitive and selective NIR fluorescence enhancement (λex/em = 680/710 nm) to CES, with the detection limit of 0.712 U L−1. The response mechanism relied on the CES-catalyzed cleavage of ester bond, along with the liberation of HCH. Moreover, significant laser-induced ROS generation was achieved in the reaction system of HCH-AcAH and CES. Compared with the reported fluorescence probes for CES, the proposed probe exhibited NIR analytical wavelengths, low detection limit, and prominent photosensitive capacity (Table S1†). These merits made HCH-AcAH useful in the real-time and in situ imaging of CES as well as imaging-guided PDT of tumors. The experiments at cellular level verified that HCH-AcAH could indeed be applied in endogenous CES-activatable fluorescence imaging of tumor cells. In addition, HCH-AcAH displayed low cytotoxicity in dark while conspicuous PDT-mediated cell death was observed upon 660 nm laser irradiation. The simplicity and great performance of HCH-AcAH may make it potential in cancer diagnosis and treatment.Author contributions
L. H. Li: conceptualization, writing-review & editing, funding acquisition, supervision; Q. Zhang: methodology, writing-original draft; J. J. Li: software; Y. F. Tian: validation; J. Y. Li: validation; W. Liu: resources, project administration; H. P. Diao: funding acquisition, supervision.Conflicts of interest
There are no conflicts to declare.Acknowledgements
We are grateful for the financial support from the NSF of China (no. 82071969 and 21705104), the Youth Top Talent Plans of Shanxi Province (no. 20180606); the Scientific and Technological Innovation Programs of Higher Education Institutions in Shanxi (no. 2019L0406), Open Fund from Key Laboratory of Cellular Physiology (Shanxi Medical University), Ministry of Education, China (no. KLMEC/SXMU-202003), the Startup Foundation for Doctors of Shanxi Medical University (no. 03201601).Notes and references
- Z. M. Yang, Z. J. Zhang, Z. Q. Lei, D. Wang, H. C. Ma and B. Z. Tang, ACS Nano, 2021, 15, 7328 CrossRef CAS PubMed.
- A. Antonucci, M. Reggente, C. Roullier, A. J. Gillen, N. Schuergers, V. Zubkovs, B. P. Lambert, M. Mouhib, E. Carara, L. Dini and A. A. Boghossian, Nat. Nanotechnol., 2022, 12, 1111 CrossRef PubMed.
- Q. Zhang, L. Wu, S. Z. Liu, Q. J. Chen, L. P. Zeng, X. Z. Chen and Q. Zhang, Cancer Cell Int., 2020, 20, 570 CrossRef CAS.
- A. Baghdasaryan, F. F. Wang, F. Q. Ren, Z. R. Ma, J. C. Li, X. T. Zhou, L. Grigoryan, C. Xu and H. J. Dai, Nat. Commun., 2022, 12, 5613 CrossRef.
- T. Setsuko and J. Takashi, RSC Adv., 2020, 10, 28171 RSC.
- S. S. Hafiz, M. Xavierselvan, S. Gokalp, D. Labadini, S. Barros, J. Duong, M. Foster and S. Mallidi, ACS Appl. Nano Mater., 2022, 5, 6125 CrossRef CAS PubMed.
- W. C. Shen, T. T. Hu, X. Y. Liu, J. J. Zha, F. Q. Meng, Z. K. Wu, Z. L. Cui, Y. Yang, H. Li, Q. H. Zhang, L. Gu, R. Z. Liang and C. L. Tan, Nat. Commun., 2022, 13, 3384 CrossRef CAS.
- W. Kang, Y. Tian, Y. Zhao, X. D. Yin and Z. G. Teng, RSC Adv., 2022, 12, 16927 RSC.
- F. Xu, H. D. Li, Q. C. Yao, H. Y. Ge, J. L. Fan, W. Sun, J. Y. Wang and X. J. Peng, Chem. Sci., 2019, 10, 10586 RSC.
- L. H. Li, L. Ding, X. Y. Zhang, D. N. Wen, M. Zhang, W. Liu, H. J. Wang, B. Wang, L. L. Yan, L. X. Guo and H. P. Diao, Spectrochim. Acta, Part A, 2022, 267, 120579 CrossRef.
- H. P. Lee and A. K. Gaharwar, Adv. Sci., 2020, 7, 2000863 CrossRef.
- R. Wang, K. H. Kim, J. Yoo, X. S. Li, N. Kwon, Y. H. Jeon, S. H. Shin, S. S. Han, D. S. Lee and J. Yoon, ACS Nano, 2022, 16, 3045 CrossRef.
- M. J. Zhao, Q. Zeng, X. P. Li, D. Xing and T. Zhang, Nano Res., 2022, 15, 716 CrossRef.
- X. Xie, K. L. Jiang, B. W. Li, S. L. Hou, H. L. Tang, B. H. Shao, Y. Ping and Q. Q. Zhang, Biomaterials, 2022, 286, 121598 CrossRef.
- Z. Yang, W. P. Fan, W. Tang, Z. Y. Shen, Y. L. Dai, J. B. Song, Z. T. Wang, Y. Liu, L. S. Lin, L. L. Shan, Y. J. Liu, O. Jicobson, P. F. Rong, W. Wang and X. Y. Chen, Angew. Chem., Int. Ed., 2018, 57, 14101 CrossRef CAS PubMed.
- Y. Q. Zhang, J. Fang, S. Y. Ye, Y. Zhao, A. N. Wang, Q. L. Mao, C. X. Cui, Y. L. Feng, J. C. Li, S. N. Li, M. Y. Zhang and H. B. Shi, Nat. Commun., 2022, 13, 1685 CrossRef CAS.
- G. D. Ren, Z. C. Wang, Y. F. Tian, J. Y. Li, Y. Y. Ma, L. Zhou, C. W. Zhang, L. X. Guo, H. P. Diao, L. H. Li, L. Lu, S. F. Ma, Z. F. Wu, L. L. Yan and W. Liu, Biomed. Pharmacother., 2022, 153, 113506 CrossRef CAS.
- J. X. Wang, W. Y. Kong, H. S. Jin, C. L. Li, Q. Luo, Y. Luo, C. P. Yuan, J. Lu, L. Zhang and X. J. Liu, Colloids Surf., 2022, 218, 112750 CrossRef CAS PubMed.
- Z. Y. Xu, J. Q. Qian, C. Meng, Y. Liu, Q. Ding, H. M. Wu, P. Li, F. S. Ran, G. Q. Liu, Y. Y. Wang and Y. Ling, Theranostics, 2022, 12, 2535 CrossRef CAS PubMed.
- X. Zhou, H. D. Li, C. Shi, F. Xu, Z. Zhang, Q. C. Yao, H. Ma, W. Sun, K. Shao, J. J. Du, S. R. Long, J. L. Fan, J. Y. Wang and X. J. Peng, Biomaterials, 2020, 253, 120089 CrossRef CAS.
- J. Yuan, Q. H. Zhou, S. Xu, Q. P. Zuo, W. Li, X. X. Zhang, T. B. Ren, L. Yuan and X. B. Zhang, Angew. Chem., Int. Ed., 2022, e202206169 CAS.
- F. Y. Zhou, S. K. Yang, C. Zhao, W. W. Liu, X. F. Yao, H. Yu, X. L. Sun and Y. Liu, Theranostics, 2021, 11, 7045 CrossRef CAS PubMed.
- J. Zheng, Y. Z. Liu, F. L. Song, L. Jiao, Y. N. Wu and X. J. Peng, Chem. Commun., 2020, 56, 5819 RSC.
- B. J. Aguilar, A. T. Nkembo, R. Duverna, R. A. Poku, F. Amissah, S. Y. Ablordeppey and N. S. Lamango, Eur. J. Med. Chem., 2014, 81, 323 CrossRef PubMed.
- H. N. He, L. Sun, J. X. Ye, E. G. Liu, S. H. Chen, Q. L. Liang, M. C. Shin and V. C. Yang, J. Controlled Release, 2016, 240, 67 CrossRef PubMed.
- A. Sharma, E. J. Kim, S. Mun, M. S. Ji, B. G. Chung and J. S. Kim, Dyes Pigm., 2019, 163, 62 CrossRef.
- X. P. Ma, X. M. Huang, Z. Moore, G. Huang, J. A. Kilgore, Y. G. Wang, S. Hammer, N. S. Williams, D. A. Boothman and J. M. Gao, J. Controlled Release, 2015, 200, 201 CrossRef PubMed.
- P. E. Saw, H. R. Yao, C. H. Lin, W. Tao, O. C. Farokhzad and X. D. Xu, Nano Lett., 2019, 19, 5967 CrossRef CAS PubMed.
- M. R. Hellmich, C. Chao, K. Modis, Y. Ding, J. R. Zatarain, K. Thanki, M. Maskey, N. Druzhyna, A. A. Untereiner, A. Ahmad, Y. Xue, H. Y. Chen, W. K. Russell, J. M. Wang, J. Zhou and C. Szabo, Biomolecules, 2021, 11, 1073 CrossRef CAS PubMed.
- Q. Huang, X. Liu, H. Y. Wang, X. R. Liu, Q. Z. Zhang, K. Li, Y. Chen, Q. Zhu, Y. Q. Shen and M. H. Sui, Acta Biomater., 2022, 137, 262 CrossRef CAS PubMed.
- C. Gao, X. L. Liang, S. Y. Mo, N. S. Zhang, D. S. Sun and Z. F. Dai, ACS Appl. Mater. Interfaces, 2018, 10, 3219 CrossRef CAS.
- J. B. Zhuang, N. Li, Y. L. Zhang, B. L. Li, H. Q. Wen, X. C. Zhang, T. Y. Zhang, N. Zhao and B. Z. Tang, CCS Chem., 2021, 3, 1964 Search PubMed.
- Y. Y. Zhang, W. Chen, D. Feng, W. Shi, X. H. Li and H. M. Ma, Analyst, 2012, 137, 716 RSC.
- K. Kailass, O. Sadovski, W. R. Zipfel and A. A. Beharry, J. Med. Chem., 2022, 65, 8855 CrossRef CAS PubMed.
- J. N. Dai, Y. D. Hou, J. C. Wu and B. X. Shen, ChemistrySelect, 2020, 5, 11185 CrossRef.
- Y. Shu, C. Q. Huang, H. J. Liu, F. Y. Hu, H. M. Wen, J. Liu, X. Z. Wang, C. X. Shan and W. Li, Spectrochim. Acta, Part A, 2022, 281, 121529 CrossRef PubMed.
- J. Q. Dong, J. B. Gao and Y. Wang, Dyes Pigm., 2022, 205, 110549 CrossRef.
- H. Zhou, J. B. Tang, J. Zhang, B. C. Chen, J. F. Kan, W. F. Zhang, J. Zhou and H. M. Ma, J. Mater. Chem. B, 2019, 7, 2989 RSC.
- M. Y. Li, C. Zhai, S. Y. Wang, W. X. Huang, Y. G. Liu and Z. Li, RSC Adv., 2019, 9, 40689 RSC.
- J. M. Wang, Z. D. Teng, L. Zhang, Y. X. Yang, J. Qian, T. Cao, Y. P. Cao, W. W. Qin, Y. Liu and H. C. Guo, ACS Sens., 2020, 5, 3264 CrossRef CAS PubMed.
- L. Peng, S. D. Xu, X. K. Zheng, X. M. Cheng, R. Y. Zhang, J. Liu, B. Liu and A. J. Tong, Anal. Chem., 2017, 89, 3162 CrossRef CAS PubMed.
- J. Wang, W. B. Xu, Z. C. Yang, Y. C. Yan, X. X. Xie, N. Qu, Y. Wang, C. Y. Wang and J. L. Hua, ACS Appl. Mater. Interfaces, 2018, 10, 31088 CrossRef CAS.
- Y. Y. Sun, X. N. Zhou, L. Y. Sun, X. X. Zhao, Y. R. He, G. Gao, W. N. Han and J. Zhou, Chin. Chem. Lett., 2022, 33, 4229 CrossRef CAS.
- Y. Liu, Z. X. He, Y. T. Yang, X. H. Li, Z. F. Li and H. M. Ma, Biosens. Bioelectron., 2022, 211, 114392 CrossRef CAS PubMed.
- S. Y. Liu, X. T. Zou, Y. Guo and X. Gao, Anal. Chim. Acta, 2022, 1221, 340126 CrossRef CAS.
- L. H. Li, W. Shi, X. F. Wu, Q. Y. Gong, X. H. Li and H. M. Ma, Biosens. Bioelectron., 2016, 81, 395 CrossRef CAS.
- L. Yuan, W. Y. Lin, S. Zhao, W. S. Gao, B. Chen, L. W. He and S. S. Zhu, J. Am. Chem. Soc., 2012, 134, 13510 CrossRef CAS PubMed.
- L. H. Li, M. Zhang, L. Ding, G. D. Ren, X. Y. Hou, W. Liu, H. J. Wang, B. Wang, L. L. Yan and H. P. Diao, Spectrochim. Acta, Part A, 2021, 252, 119518 CrossRef CAS PubMed.
- A. L. Eiden, P. E. Kaufman, F. M. Oi, M. J. Dark, J. R. Bloomquist and R. J. Miller, Med. Vet. Entomol., 2007, 31, 243 CrossRef.
- J. G. Wang, Q. Q. Chen, N. Tian, W. P. Zhu, H. Zou, X. S. Wang, X. K. Li, X. L. Fan, G. Y. Jiang and B. Z. Tang, J. Mater. Chem. B, 2018, 6, 1595 RSC.
- K. Na, M. Kim, C. Y. Kim, J. S. Lim, J. Y. Cho, H. Shin, H. J. Lee, B. J. Kang, D. H. Han, H. Kim, J. H. Baik, M. S. Lange, J. Karl and Y. Paik, J. Proteome Res., 2020, 19, 4867 CrossRef CAS PubMed.
- P. R. Jensen, S. C. Serra, L. Miragoli, M. Karlsson, C. Cabella, L. Poggi, L. Venturi, F. Tedoldi and M. H. Lerche, Int. J. Cancer, 2015, 136, E117 CrossRef CAS PubMed.
Footnote |
| † Electronic supplementary information (ESI) available. See DOI: https://doi.org/10.1039/d2ra06929f |
| This journal is © The Royal Society of Chemistry 2022 |