 Open Access Article
Creative Commons Attribution 3.0 Unported Licence
Polyethylenimine-functionalized cellulose aerogel beads for efficient dynamic removal of chromium(VI) from aqueous solution†
Dong-Mei Guoa,
Qing-Da An *a,
Zuo-Yi Xiao
 a,
Shang-Ru Zhai
 *a and
Zhan Shi
 b
b
aFaculty of Light Industry and Chemical Engineering, Dalian Polytechnic University, Dalian 116034, China. E-mail: anqingdachem@163.com; zhaisrchem@163.com
bState Key Laboratory of Inorganic Synthesis and Preparative Chemistry, College of Chemistry, Jilin University, Changchun 130012, China
First published on 24th November 2017
Abstract
For the highly effective removal of hexavalent chromium from aqueous solutions, a new polyethylenimine (PEI) grafted porous adsorbent, a cellulose@PEI aerogel (CPA-2) composite, was synthesized through a glutaraldehyde crosslinking reaction between the amine groups of PEI and the hydroxyl groups of cellulose. The physicochemical properties of this new adsorbent were characterized by FT-IR, SEM, EDX, XPS, etc., and the modification of grafting with PEI was demonstrated by FT-IR, EDX and XPS analyses. The effects of pH, contact time, initial concentration and PEI content on Cr(VI) sorption were systematically investigated. Experimental data were well described by the Freundlich isotherm and the pseudo-second-order model in a batch system, demonstrating that chemisorption was the rate-controlling factor for Cr(VI) removal with CPA-2. Furthermore, the experimental maximum adsorption capacity of CPA-2 was 229.1 mg g−1, which was around 12 times higher than that of cellulose aerogel (CA) (18.7 mg g−1). The Thomas model was well fitted to the breakthrough curves of adsorption processes under different fixed-bed conditions. Above all, the exhausted bead-like adsorbent could be easily separated and regenerated without significant loss of adsorption capacity. Accordingly, this new composite material should be a promising sorbent for sewage disposal, with advantages of high performance, low-cost, biodegradability and excellent reusability.
1. Introduction
With the rapid development of industrialization and urbanization, water contamination such as heavy metal pollution has led to severe environmental problems, which threaten ecological systems and human health. Chromium, a heavy metal existing generally in sewage, usually originates from industries such as textile dyeing, leather tanning and paper making.1 There are two valences of chromium in its natural state, which are trivalence and hexavalence, having observable differences in toxicities.2 Trivalent chromium is an essential trace element that is good for metabolizing sugar, protein and fat (the quantity demanded is 50–200 mg a day).3 Nevertheless, hexavalent chromium, which is highly soluble and mobile in aqueous media, exerts toxicity, carcinogenicity and mutagenicity to humans and animals because of its strong oxidizing properties.4,5 Nowadays, the U.S. Environmental Protection Agency (EPA) Guidelines give a maximum value of chromium in potable water, namely 0.05 mg L−1.6 Hence, it is an important issue to remove Cr(VI) from chromium-polluted water to weaken the grave impact of Cr(VI) on human health.Numerous methods, including photocatalysis,7 membrane process,8 adsorption,9,10 electrochemical treatment11 and so forth, have been used to remove Cr(VI) from wastewater. Nevertheless, most of these strategies have associated defects which more or less limit their practical application to sewage disposal, for instance, high cost produced by operating, poor efficacy, generation of a toxic sludge and secondary pollutants and so on. By contrast, adsorption is regarded as a simple and cost effective method for the separation of chromium from aqueous solutions, because of the simplicity of design, environmental friendliness, low cost, high efficiency and reusability of adsorbents.12
Up to now, a variety of adsorbents, such as graphene,13 biomass,14 activated carbon,3 mineral,15,16 etc., have been developed to dispose Cr(VI). Amongst them, using low-cost biomass as adsorbent to remove Cr(VI) has received great attention, such as rice husk,17 cellulose,18 lignin,19 sodium alginate20 and chitosan.21 Among these materials, cellulose has received increasing attentions owing to its properties which contain inexpensive, abundant, non-toxic, low weight, renewable and biodegradable. There are many –OH groups on the surface of cellulose that can provide some adsorption capacity. However, previous powdery cellulose-based adsorbents are difficult to be separated from sewage, usually employing energy-consuming processes like filtration or centrifuging.22 To address this issue, the preparation of micrometer-sized cellulose aerogel beads might be an alternative way to solve this bottleneck problem. Moreover, as a result of the low activity of –OH, the adsorption capacity of pure cellulose is little. Hence, surface modification of cellulose materials with more functional groups to significantly enhance the adsorption ability of adsorbent has attracted more and more attentions within the last decades.
Some effective groups such as carbonyl group,23 carboxyl group24 and amino group25,26 can be grafted onto the surface of cellulose to improve the adsorption capacity. By contrast, amino-functionalized adsorbents exerted excellent properties in removing Cr(VI) ions from effluents.26 For example, Tian et al. reported a composite composed of halloysite and polyethyleneimine to dispose chromium-polluted water, and its maximum adsorbing capacity was 102.5 mg g−1.27 In addition, Chen et al. prepared polyethyleneimine-grafted magnetic nanoparticles to dispose sewage, for which the adsorbing capacity of Cr(VI) reached 175.8 mg g−1.28 Clearly, polyethylenimine (PEI) whose chain has plenty of primary and secondary amino groups is frequently used to modify sorbents by grafting onto the support materials to improve the adsorption capacity for Cr(VI).29,30 Given that amino groups are easily protonated under acidic conditions, Cr(VI) could be absorbed on polyethyleneimine-modified adsorbents by electrostatic interaction. However, on account of the high solubility of PEI in aqueous system, it is difficult to recover the polymer when it is directly used to remove Cr(VI) from effluents, limiting the application of PEI. Hence, enhancing the stability and reusability of PEI is another important issue for current studies.
To overcome the shortcomings mentioned above, a new core–shell/bead-like cellulose@PEI aerogel composite was produced by grafting PEI onto the surface of cellulose hydrogel beads using glutaraldehyde (GLA) as cross-linking agent. This method could not only introduce plenty of amino groups to the surface of cellulose, but also increase the mechanical property of cellulose hydrogels. Meanwhile, the separation of cellulose@PEI aerogel beads after adsorbing chromium is very simple, avoiding tedious procedures like filtration or other separation process. Thus, the synthetic sorbent was utilized for removing Cr(VI) from effluents. Adsorption experiments were carried out as a function of contact time, pH, initial Cr(VI) concentration, and more significantly flow rate, inlet concentration of column adsorption to investigate the practical potentiality of such new bead-like aerogel composite under dynamic sorption conditions were conducted out, and possible adsorption mechanism was also investigated thoroughly.
2. Materials and methods
2.1 Materials
PEI (Mw = 600, 99%) and α-cellulose (50 μm) were obtained from Sigma-Aldrich Co., Ltd. Glutaraldehyde solution (50%) was purchased from Tianjin Guangfu Fine Chemical Industry Research Institute, China. Ethyl acetate, chloroform, glacial acetic acid, urea, K2Cr2O7, ethanol, LiOH were obtained from Tianjin Kermel Chemical Reagent Corporation, China. tert-Butanol and acetone, supplied by Sinopharm Chemical Reagent Co., Ltd, China. Deionized water was used throughout this work. All the chemicals were used as-received without any further treatment.2.2 Synthesis of cellulose@PEI aerogel beads
The schematic of synthesizing cellulose@PEI aerogel beads is shown in Scheme 1. Solvent system of LiOH/urea/H2O (4.6![[thin space (1/6-em)]](https://www.rsc.org/images/entities/char_2009.gif) :
:![[thin space (1/6-em)]](https://www.rsc.org/images/entities/char_2009.gif) 15
15![[thin space (1/6-em)]](https://www.rsc.org/images/entities/char_2009.gif) :
:![[thin space (1/6-em)]](https://www.rsc.org/images/entities/char_2009.gif) 80.4 w/w) was prepared at first. Afterwards, a certain amount of α-cellulose (4 g) was dispersed into 100 g solvent mixture under violent stirring for 2 h at room temperature. After that, mixed solution was cooled to −18 °C for 2 h, and then dissolved at ambient temperature under magnetic stirring to obtain a transparent cellulose solution. Cellulose hydrogel beads were prepared by added dropwise of the cellulose solution (4%, w/w) into a coagulation bath of ethyl acetate/chloroform/glacial acetic acid (3
80.4 w/w) was prepared at first. Afterwards, a certain amount of α-cellulose (4 g) was dispersed into 100 g solvent mixture under violent stirring for 2 h at room temperature. After that, mixed solution was cooled to −18 °C for 2 h, and then dissolved at ambient temperature under magnetic stirring to obtain a transparent cellulose solution. Cellulose hydrogel beads were prepared by added dropwise of the cellulose solution (4%, w/w) into a coagulation bath of ethyl acetate/chloroform/glacial acetic acid (3![[thin space (1/6-em)]](https://www.rsc.org/images/entities/char_2009.gif) :
:![[thin space (1/6-em)]](https://www.rsc.org/images/entities/char_2009.gif) 3
3![[thin space (1/6-em)]](https://www.rsc.org/images/entities/char_2009.gif) :
:![[thin space (1/6-em)]](https://www.rsc.org/images/entities/char_2009.gif) 1 v/v) for 10 min, and then the obtained cellulose beads were transferred into glacial acetic acid solution (1%, w/w) for 24 h for the purpose of solidification. Ethyl acetate/chloroform/glacial acetic acid solution could be collected and reused. Afterwards the cellulose hydrogel beads were separated and repeatedly washed with water to remove extra chemical reagents.
1 v/v) for 10 min, and then the obtained cellulose beads were transferred into glacial acetic acid solution (1%, w/w) for 24 h for the purpose of solidification. Ethyl acetate/chloroform/glacial acetic acid solution could be collected and reused. Afterwards the cellulose hydrogel beads were separated and repeatedly washed with water to remove extra chemical reagents.
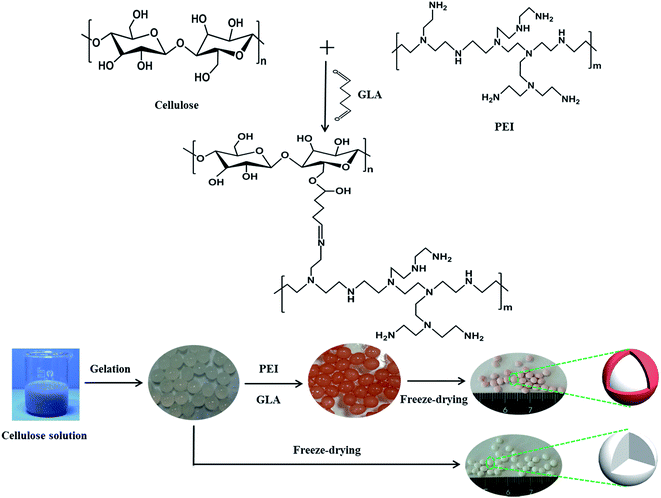 | ||
| Scheme 1 The synthesis route to prepare cellulose aerogel beads and core–shell cellulose@PEI aerogel beads. | ||
The cellulose hydrogel beads and a certain amount of PEI were then added into 60 mL deionized water stirring for 1 h to make it totally dispersed. Next, 40 mL aqueous glutaraldehyde solution as crosslinking agent was put into the hybrid and agitated for 2 h to obtain core–shell/bead-like cellulose@PEI hydrogel beads,31 followed by washing with deionized water to wash away the residual PEI and glutaraldehyde. The absorbed water in cellulose hydrogel beads was exchanged with ethanol which was then replaced by the tert-butanol. Lastly, cellulose@PEI hydrogels were frozen at −50 °C for 12 h, and subjected to freeze-drying at −50 °C for 12 h. By varying the amount of PEI (1, 1.5, 2, 2.5 and 3 g), five samples of cellulose@PEI aerogel were generated and coded as CPA-1, CPA-1.5, CPA-2, CPA-2.5 and CPA-3, respectively.
Pure cellulose aerogel (CA) was prepared by the same method as a control sample. Moreover, the tert-butanol replacement prior to freeze-drying was conducted out for the sake of ensuring admirable voids and three-dimensional network structure of the aerogel, which would be demonstrated by the characterization analysis as follows.
2.3 Characterization
The FT-IR spectra were measured on Nicolet 5700 FT-IR spectroscope (Nicolet, USA) between 4000 and 500 cm−1 using the KBr pellet technique. The scanning electron microscopy (SEM) and the energy dispersive X-ray spectroscopy (EDX) images were carried out on a Hitachi S-4800 SEM instrument (Hitachi, Japan) to investigate the morphology and structural of composites. X-ray photoelectron spectra (XPS) were studied by an ESCALAB MKII X-ray photoelectron spectrometer. It is worth mentioning that EDX and XPS were used to confirm the chemical modification process and reveal the adsorption mechanism. The specific surface area and pore diameter were obtained by using a surface area analyzer (Quantachrome Autosorb NOVA2200e, USA). The concentration of Cr(VI) was measured by a UV-vis spectrophotometer (UV-754N Shanghai, China). All pH values were evaluated by Delta320 digital pH meter (Mettler-Toledo, Switzerland). Moreover, the surface zeta potentials of CPA-2 were studied by Malvern Zen 3600 Zetasizer (Malvern Instruments, United Kingdom) under different pH conditions.2.4 Batch adsorption experiments
A series of batch adsorption experiments including effects of contact time, pH and initial concentration of Cr(VI) were conducted in 50 mL glass conical flasks in which 0.02 g of sorbent was added into 20 mL solution of calculated Cr(VI) concentration by shaking at 180 rpm at 25 °C. Magnetic stirring could ensure the homogeneity of system in adsorption process. Moreover, solution pH was adjusted by using 0.1 M HCl or 0.1 M NaOH. Then residual concentration of Cr(VI) ions was monitored by UV-vis absorption spectrophotometry at maximum absorbance wavelength of 540 nm. And the adsorption capacity at specific times and equilibrium were calculated by the following equations:
 | (1) |
 | (2) |
2.5 Column adsorption experiments
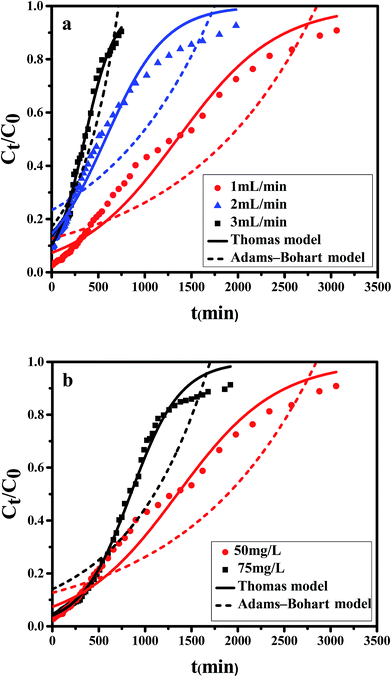
The typical CPA-2 beads with an average size of 3 mm was packed into the fixed-bed column on account of the bead-like structure of cellulose@PEI aerogel beads, by which was favorable for the dynamic adsorption. Fixed-bed column operations were conducted in glass column whose internal diameter and length were 1.2 cm and 10 cm, respectively. The column reactors were packed with 0.590 g CPA-2 at bed depth of 8 cm. Before each experiment, a little gauze was placed at the bottom of fixed-bed reactor to make the sorbent stabilized. The concentrations of Cr(VI) solution fed into the column at a determinate flow rate (1, 2 and 3 mL min−1) by a peristaltic pump were 50 and 75 mg L−1, respectively. The samples flowing out were collected at decided time intervals and measured by UV-vis spectrophotometer. The column experiments were used to investigate the practical application properties of adsorbent. The time of breakthrough appearance and the shape of the breakthrough curve are essential features for confirming the dynamic response of a fixed-bed column. And the breakthrough curves were drew by ratio of outflow and inlet metal concentration (Ct/C0) as a function of time. The continuous Cr(VI) uptake process was continued until the exhaustion point (Ct/C0 = 0.9) of the column appeared. The outlet concentration from the fixed bed reaching about 10% of the feed concentration is breakthrough point.Total adsorbed metal quantity, qtotal (mg), is equal to the area under the plot of the adsorbed Cr(VI) concentration Cad (Cad = C0 − Ct) (mg L−1) against t (min), could be calculated using:
 | (3) |
| VE = Qttotal | (4) |
The maximum capacity of the fixed bed, qe (mg g−1), was evaluated from eqn (5):
 | (5) |
Total amount of Cr(VI) sent to column, W (mg), could be calculated as following:
 | (6) |
Total removal (R (%)) was calculated from eqn (6):
 | (7) |
The empty bed contact time (EBCT) is an important parameter. Generally speaking, the VE is increased with the increase in EBCT. The EBCT in the column can be described as following:
 | (8) |
3. Results and discussion
3.1 Batch adsorption experiments
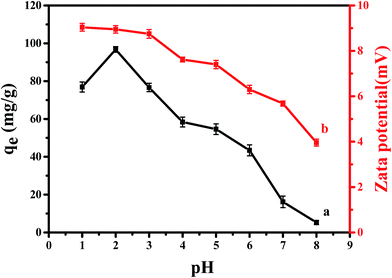 | ||
| Fig. 1 (a) Effect of pH on the adsorption of Cr(VI) on CPA-2; (b) zeta potential analysis at different solution pH onto CPA-2. | ||
The impact of solution pH on chromium uptake could be elucidated by the surface charge of sorbent and the degree of ionization of adsorbate. Therefore, the surface charges of CPA-2 were measured at various pH values. From Fig. 1b, it should be noted that cellulose@PEI composite was positively charged and zeta potential value decreased with increasing pH from 1 to 8. The positive charge could be associated with PEI, which is a cationic polyelectrolyte. There are many –NH2 on cellulose@PEI aerogel that would be protonated to form –NH3+ in low pH solution, resulting in an electrostatic attraction to negatively charged Cr(VI) ions,32 which can lead to an increase in adsorption capacity. When the solution pH increased, the degree of –NH2 protonation decreased, making a decrease in surface charge of CPA-2.
In addition, Cr(VI) exists various forms such as H2CrO4, HCrO4−, CrO42− and Cr2O72− in water which are associated with solution pH. The dominant forms of Cr(VI) would interconvert from CrO42− to HCrO4− and Cr2O72− when pH value is lower than 6.5, while pH above 6.5 hexavalent chromium could be transformed as CrO42−. In addition, H2CrO4 is predominant at pH less than 2.33 In contrast to CrO42−, Cr2O72− has the same charge but double Cr(VI) amount, so does the HCrO4− owing to charge balance, making the uptake capacity increased significantly. In other words, increasing the ratio of HCrO4− and Cr2O72− would give rise to an improvement of Cr(VI) removal. Moreover, at pH < 2, the existence of H2CrO4 could cause reduction of electrostatic attraction between CPA-2 and Cr(VI). Consequently, the optimal pH value appeared at 2, which was consistent with previous work.28
Langmuir and Freundlich models, two famous types of isotherm models, were used to simulate the equilibrium data. Langmuir model is based on the assumption that the adsorption process is monolayer sorption on a homogeneous sorption surface and all sorption sites are almost identical. Hence, it can reach saturation. Nevertheless, Freundlich isotherm model is used to characterize multilayer adsorption.34 These two models are represented as:
Langmuir:
 | (9) |
 | (10) |
Freundlich:
 | (11) |
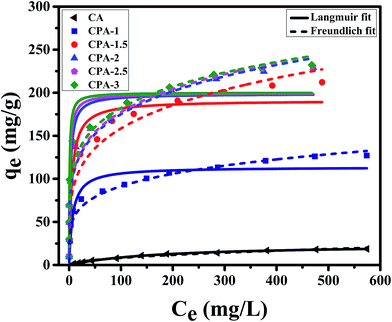 | ||
| Fig. 2 Langmuir and Freundlich isotherm models of Cr(VI) removal using CA, CPA-1, CPA-1.5, CPA-2, CPA-2.5 and CPA-3. | ||
| samples | Langmuir isotherm | Freundlich isotherm | |||||
|---|---|---|---|---|---|---|---|
| qm (mg g−1) | Kl (L mg−1) | Rl | R2 | Kf (mg g−1) | n | R2 | |
| CA | 24.39 | 0.0056 | 0.2033–0.9470 | 0.9958 | 0.7979 | 1.9742 | 0.9767 |
| CPA-1 | 113.66 | 0.1421 | 0.0099–0.4131 | 0.9152 | 34.5086 | 4.7259 | 0.9640 |
| CPA-1.5 | 191.06 | 0.1946 | 0.0073–0.3394 | 0.9298 | 55.7269 | 4.4056 | 0.9443 |
| CPA-2 | 198.71 | 0.4167 | 0.0034–0.1943 | 0.8944 | 68.3574 | 4.8976 | 0.9537 |
| CPA-2.5 | 199.19 | 0.6109 | 0.0023–0.1407 | 0.9002 | 70.0826 | 4.9548 | 0.9393 |
| CPA-3 | 200.16 | 0.9270 | 0.0014–0.0887 | 0.9055 | 77.3620 | 5.3802 | 0.9345 |
In addition, the qm value of CPA-2 for chromium acquired from Langmuir model was 198.7 mg g−1, while the experimental maximum sorption capacity of CPA-2 was 229.1 mg g−1, which was around 12 times higher than the sorption capacity of Cr(VI) on CA (18.7 mg g−1), manifesting that the adsorption capacity was observably enhanced by the modification of PEI and considerably higher than other previously reported adsorbents. The qm values of CPA-2 and other adsorbents under similar conditions were summarized in Table 2. The CPA-2 which could be separated from effluents easily had a fairly greater adsorption capacity than those previously reported adsorbents, indicating that CPA-2 has a good potential in the decontamination of chromium-polluted water.
| Adsorbents | qmax (mg g−1) | Ref. |
|---|---|---|
| PEI grafted γ-Fe2O3@Fe3O4 nanoparticles | 78.1 | 48 |
| Activated carbon | 15.5 | 49 |
| Quaternized rice hulls | 32.3 | 50 |
| Amino-functionalized mesoporous silica | 118.6 | 51 |
| PEI immobilized acrylate-based magnetic beads | 140.6 | 28 |
| PEI–HNTs | 102.5 | 27 |
| Amino-functionalized magnetic cellulose | 171.5 | 52 |
| Graphene oxide functionalized with magnetic | 67.7 | 53 |
| PEI–MNPs | 175.8 | 31 |
| CPA-2 | 229.1 | This work |
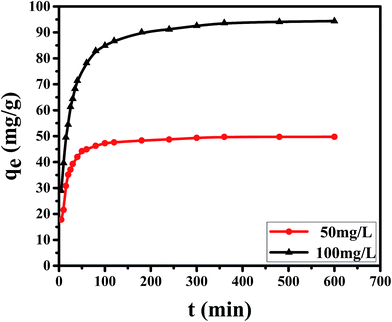
As is well known that pseudo-first-order model was based on the assumption that the adsorption process is primarily controlled by internal diffusion process, while the pseudo-second-order kinetic model was based on the assumption that the adsorption process is mainly controlled by chemisorption of adsorbate molecules on active sites. The kinetic data of Cr(VI) on CPA-2 were fitted by pseudo-first-order and pseudo-second-order rate equations,38 which were expressed as:
ln(qe − qt) = ln![[thin space (1/6-em)]](https://www.rsc.org/images/entities/char_2009.gif) qe − Klt qe − Klt
| (12) |
 | (13) |
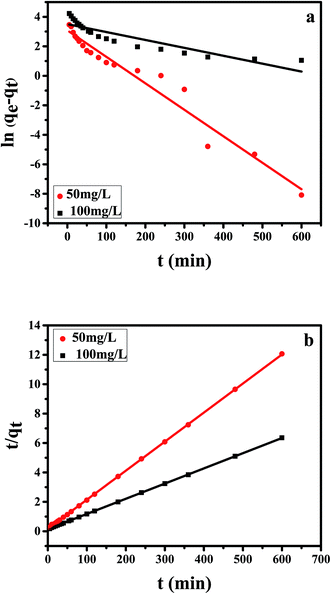 | ||
| Fig. 4 The (a) pseudo-first-order, (b) pseudo-second-order kinetic model of Cr(VI) removal on the CPA-2. | ||
| C0 (mg L−1) | qe,exp (mg g−1) | Pseudo-first-order | Pseudo-second-order | ||||
|---|---|---|---|---|---|---|---|
| K1 | qe,cal (mg g−1) | R2 | K2 | qe,cal (mg g−1) | R2 | ||
| 50 | 49.73 | 0.0180 | 21.83 | 0.9570 | 0.0023 | 50.63 | 0.9999 |
| 100 | 96.76 | 0.0054 | 33.24 | 0.8109 | 0.0007 | 96.81 | 0.9999 |
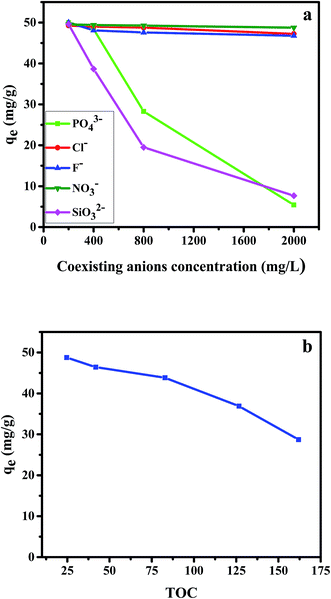
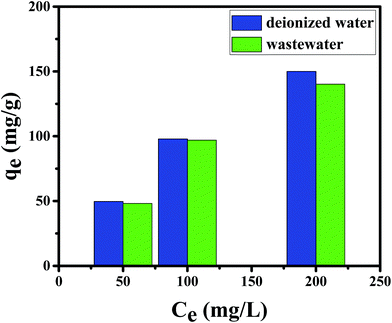
By using 20 mg dosage of CPA-2 and 50 mg L−1 (20 mL) as initial Cr(VI) concentration at pH 2, the adsorption experiments was performed by different concentrations of co-existing anions (Cl−, NO3−, F−, PO43− and SiO32−) and TOC (Acid Red 94). The results were depicted in Fig. 5. As shown in the Fig. 5a, the Cl−, NO3− and F− had no remarkable competitive influence on the adsorption of Cr(VI) onto CPA-2. Nevertheless, the removal capacity for Cr(VI) decreased rapidly with the increase of the concentration of PO43− and SiO32−. When the concentration of PO43− and SiO32− increased from 200 to 2000, the qt of Cr(VI) decreased from 49.99 to 5.41 mg L−1 and 49.59 to 7.67 mg L−1, respectively. On the one hand, the coexisting PO43− and SiO32− which can produce HPO42−, HSiO3− and OH− under hydrolytic process changed the pH of aqueous solution. The increased pH exerted distinct inhibitory effect on the chromates adsorption. On the other hand, competition adsorption could be used to explain the results, too. The Cl−, NO3− and F− are monovalent anions, which have little competition with Cr(VI) ions for the active sites on CPA-2. By contrast, PO43− and SiO32− are multivalent anions. There are distinct competitive effects between the multivalent anions and Cr(VI). Those results were consistent with the previous works.3,21 As can be seen from the Fig. 5b, the uptake capacity of Cr(VI) decreased with the increase of TOC. When the concentration of TOC increased from 24.66 to 161.92, the removal capacity of Cr(VI) decreased from 48.75 to 32.71 mg L−1. The Acid Red 94 is anionic dye that can compete active adsorption sites with Cr(VI) ions, resulting in the decrease of removal capacity.
3.2 Dynamic column adsorption testing
| Q (mL min−1) | C0 (mg L−1) | pH | W (mg) | ttotal (min) | qtotal (mg) | qe (mg g−1) | R (%) |
|---|---|---|---|---|---|---|---|
| 1 | 50 | 2 | 153 | 3060 | 70.48 | 119.46 | 46.07 |
| 2 | 50 | 2 | 198 | 1980 | 36.80 | 62.37 | 18.58 |
| 3 | 50 | 2 | 112.5 | 750 | 17.44 | 29.56 | 15.50 |
| 1 | 75 | 2 | 144 | 1920 | 66.62 | 112.91 | 46.26 |
It is shown that the slope of breakthrough curve increased with the inlet Cr(VI) concentration increasing. At lower feed concentration, breakthrough curve was dispersed and saturation point occurred slowly because of the weaker driving force in the mass transfer process. As initial concentration increased, a steeper breakthrough curve was obtained which could be explained by the condition that more hexavalent chromium could be available to bind with the active sites at higher concentration.
| Parameter | Thomas model | Adams–Bohart model | ||||
|---|---|---|---|---|---|---|
| KT (L min−1 mg−1) | q0 (mg g−1) | R2 | KAB (L min−1 mg−1) | N0 (mg L−1) | R2 | |
| Flow rate (mL min−1) | ||||||
| 1 | 3.760 × 10⁻⁵ | 114.2 | 0.9672 | 4.738 × 10⁻⁹ | 48![[thin space (1/6-em)]](https://www.rsc.org/images/entities/char_2009.gif) 169 169![[thin space (1/6-em)]](https://www.rsc.org/images/entities/char_2009.gif) 484 484 |
0.8202 |
| 2 | 6.180 × 10⁻⁵ | 97.8 | 0.9688 | 8.407 × 10⁻⁹ | 38![[thin space (1/6-em)]](https://www.rsc.org/images/entities/char_2009.gif) 308 308![[thin space (1/6-em)]](https://www.rsc.org/images/entities/char_2009.gif) 064 064 |
0.7666 |
| 3 | 1.228 × 10⁻⁴ | 89.9 | 0.9907 | 6.56 × 10⁻⁸ | 8![[thin space (1/6-em)]](https://www.rsc.org/images/entities/char_2009.gif) 921 921![[thin space (1/6-em)]](https://www.rsc.org/images/entities/char_2009.gif) 867 867 |
0.9143 |
![[thin space (1/6-em)]](https://www.rsc.org/images/entities/char_2009.gif) |
||||||
| Initial concentration (mg L−1) | ||||||
| 50 | 3.760 × 10⁻⁵ | 114.2 | 0.9672 | 4.738 × 10⁻⁹ | 48![[thin space (1/6-em)]](https://www.rsc.org/images/entities/char_2009.gif) 169 169![[thin space (1/6-em)]](https://www.rsc.org/images/entities/char_2009.gif) 484 484 |
0.8202 |
| 75 | 4.973 × 10⁻⁵ | 107.5 | 0.9938 | 7.986 × 10⁻⁹ | 27![[thin space (1/6-em)]](https://www.rsc.org/images/entities/char_2009.gif) 184 184![[thin space (1/6-em)]](https://www.rsc.org/images/entities/char_2009.gif) 079 079 |
0.8121 |
The Thomas model is one of the most ecumenically applied models for continuous flow systems,41 which can be expressed as:
 | (14) |
The Bohart–Adams model was used to fit the initial part of the breakthrough curve,42 which was focused on estimating characteristic parameters, such as N0 and KAB, and the model was given as follows:
 | (15) |
As can be seen from the Table 5, for the Thomas model, the uptake capacity (q0) decreased with the increase of feed concentration or flow rate of Cr(VI), while the value of KT increased. Therefore, lower flow rate and inlet concentration would increase the removal of Cr(VI) on the CPA-2 beads. For the Adams–Bohart model, the values of KAB increased with inlet concentration or flow rate increasing, while the values of N0 decreased with influent concentration or flow rate increasing. These results represented that the system kinetics was controlled by external mass transfer in the initial stage of Cr(VI) adsorption. By comparing the correlation coefficients (R2) obtained from all the dynamic models, the correlation coefficient values generated from the Thomas model were much higher than those from the Adams–Bohart model. It was concluded that the Thomas model was more suitable for the processes of Cr(VI) removal on the CPA-2 under different fixed-bed conditions, while the Bohart–Adams model could be used to fit the initial part of the breakthrough curve.
3.3 Characterization of resultant materials
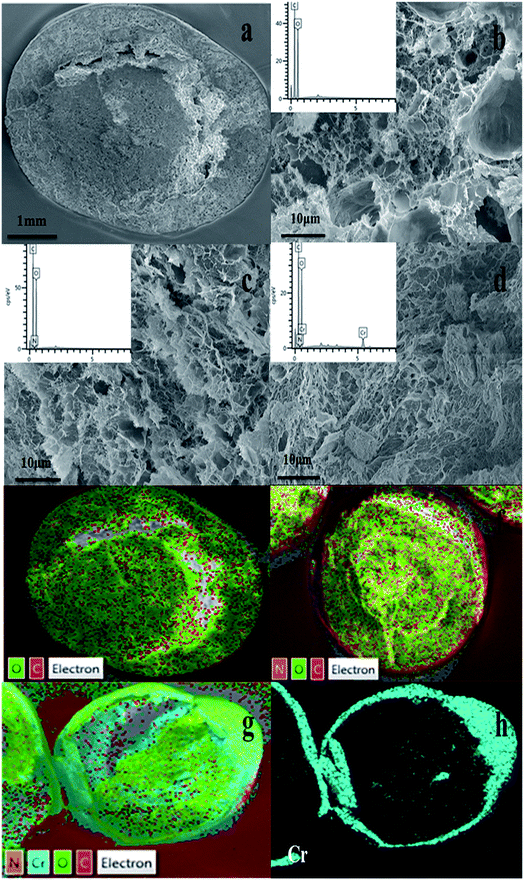 | ||
| Fig. 8 SEM images of (a, b) CA, (c) CPA-2, (d) CPA-2-Cr; EDX pattern of (e) CA, (f) CPA-2, (g, h) CPA-2-Cr (insets show EDX pattern of element type and content of CA, CPA-2 and CPA-2-Cr). | ||
Additionally, EDX mapping were used to reveal the element type and content of cellulose aerogel beads. As can be seen, C and O elements existed in CA beads (Fig. 8e), while N element was detected in CPA-2 (Fig. 8f). Given that there are amount of amino groups on PEI molecules, the existence of N element indicated that PEI had been grafted on CA beads resoundingly which was proved by the following XPS analysis. As depicted in Fig. 8g and h, the existence of Cr was obviously observed on the surface of CPA-2-Cr, demonstrating that Cr(VI) ions have been absorbed on the surface of adsorbent under testing conditions. In addition, other EDX spectra (Fig. 8b–d insets) clearly displayed the change of element type and content of CA, CPA-2 and CPA-2-Cr.
3.4 Adsorption mechanism over resultant sample
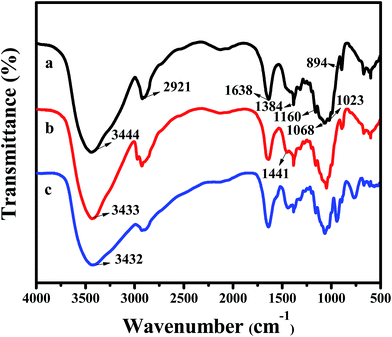
Through the pH effect study, it is known that the sorption process is regarded as the result of electrostatic interaction between protonated amine group (–NH3+) and Cr(VI) ions. For the advanced investigation of the adsorption mechanism, XPS spectra of CA, CPA-2 and CPA-2-Cr were studied and the spectra were shown in Fig. 10. As illustrated in the XPS total survey spectra (Fig. 10a), the photoelectron lines of CA at binding energies of about 285 and 533 eV were related to C 1s and O 1s, respectively. The existence of N element in the CPA-2 was demonstrated by the peak in the wide scan spectrum with binding energy at 400 eV. For the spectrum of CPA-2-Cr, there were two peaks at 579 and 588 eV appeared, which related to Cr 2p3/2 and Cr 2p1/2 orbits, respectively, demonstrating that Cr(VI) was successfully adsorbed by CPA-2. All these results were in accordance with the EDX and FTIR analyses. The high-resolution Cr 2p spectrum could be split into four peaks (Fig. 10b). The peaks at 577.6 eV (Cr 2p3/2) and 587.3 eV (Cr 2p1/2) were assigned to Cr(III) and the others at 579.8 eV (Cr 2p3/2) and 589.1 eV (Cr 2p1/2) were ascribed to Cr(VI), demonstrating that Cr(VI) and Cr(III) coexist on the porous surface of CPA-2.47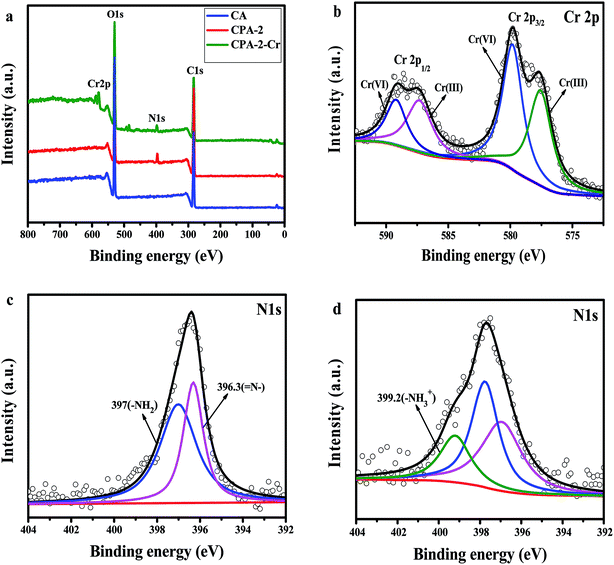 | ||
| Fig. 10 XPS spectra of (a) total survey spectra of CA, CPA-2 and CPA-2-Cr, (b) Cr 2p spectrum of CPA-2-Cr, (c) N 1s spectra of CPA-2, (d) N 1s spectra of CPA-2-Cr. | ||
The removal of chromium was generally depended on the functional groups on the surface of sorbent. Fig. 10c and d displayed the N 1s spectra of CPA-2 before and after Cr(VI) adsorption. In Fig. 10c, the peaks at 396.3 and 397 eV were attributed to ![[double bond, length as m-dash]](https://www.rsc.org/images/entities/char_e001.gif) N– and –NH2, respectively. After adsorbing Cr(VI), as shown in Fig. 8d, the new peak appeared at 399.2 eV assigned to –NH3+, and the peaks of
N– and –NH2, respectively. After adsorbing Cr(VI), as shown in Fig. 8d, the new peak appeared at 399.2 eV assigned to –NH3+, and the peaks of ![[double bond, length as m-dash]](https://www.rsc.org/images/entities/char_e001.gif) N– and –NH2 had corresponding shift, indicating that amino groups from PEI participated in the Cr(VI) removal process.
N– and –NH2 had corresponding shift, indicating that amino groups from PEI participated in the Cr(VI) removal process.
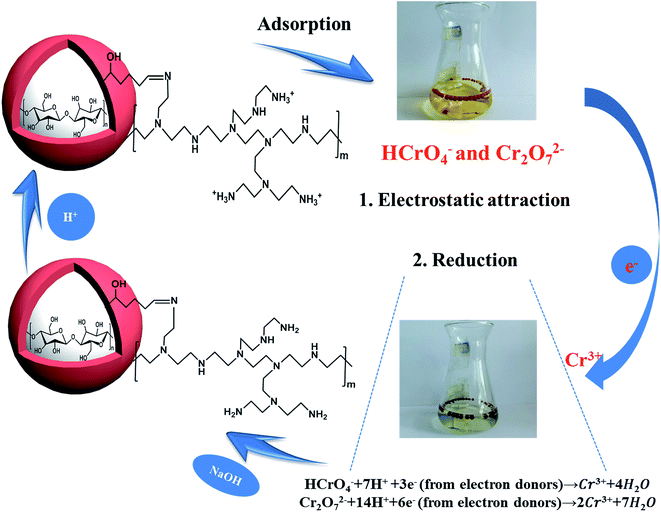
From the above analysis, the mechanism of Cr(VI) removal could be concluded as follows; on the one hand, the amino groups on the adsorbent could be effectively protonated to –NH3+ at lower pH, and Cr(VI) anions were adsorbed on CPA-2 via electrostatic attraction. On the other hand, Cr(VI) was reduced to less toxic Cr(III) by a redox reaction occurred between Cr(VI) and CPA-2. The existence of amino and hydroxyl groups acting as electron donors could be responsible for the reduction of Cr(VI) to Cr(III) during the adsorption process. Most of the Cr(III) immobilized on CPA-2 surface through ion exchange or surface complexation and a few of residual Cr(III) were released to solution again. The proposed removal mechanism was depicted in Scheme 2.
3.5 Regeneration studies
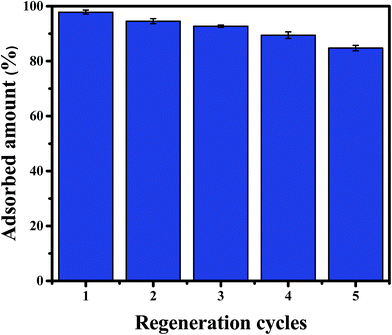
Desorption and regeneration experiments were designed to assess the practical utility of CPA-2, due to reusability is important for adsorbent to decrease economic cost. To do so, 0.02 g CPA-2 beads was added into 20 mL of 50 mg L−1 Cr(VI) solution by shaking at 180 rpm at 25 °C for 24 h. The Cr(VI)-adsorbed CPA-2 beads were collected and eluted for 30 min using 50 mL of a solution of 0.2 mol L−1 NaOH and 0.2 mol L−1 NaCl, and then rinsed with deionized water to pH 6–7 for reuse in the second run. After five adsorption–desorption cycles, the removal efficiency still kept above 80% (Fig. 11), indicating that CPA-2 beads could be repeatedly utilized in removing Cr(VI) from effluents. The decrease in adsorption capacity could be attributed to the loss of partial reduction property of CPA-2 and the unavoidable mass loss during the cyclic process.4. Conclusion
In conclusion, a new type of low-cost, highly efficient, environmentally-friendly bead-like composite (CPA-2) was synthesized through cross-link reaction between the amine groups of PEI and the hydroxyl groups of cellulose, leading to the significant enhancement of Cr(VI) removal efficiency under batch and column systems. Either morphology analysis or changes of FTIR and XPS characteristic spectra demonstrated the successful modification of CPA-2 with PEI. The batch experimental results indicated that Cr(VI) adsorption capacity of CPA-2 was highly pH dependent, and the optimal pH value appeared at 2. The maximum adsorption capacity of CPA-2 was calculated to be 229.1 mg g−1, which was much higher than previous reported adsorbents for Cr(VI) removal. Kinetics data suggested that the removal of Cr(VI) on CPA-2 fitted well with pseudo-second-order kinetic model while the equilibrium data were well described by Freundlich model. Column studies indicated that the adsorption of Cr(VI) on CPA-2 depended on flow rate and influent Cr(VI) concentration, and Thomas model was more suitable for the breakthrough curves of adsorption processes under different fixed-bed conditions. Mechanism investigations revealed that the removal of chromium by the CPA-2 was a complicated process, in which electrostatic interaction and a redox reaction were involved. More significantly, the CPA-2 beads could be easily separated and reused without significant loss of adsorption capacity even after five cycles. Generally speaking, as-prepared CPA-2 can be considered as a promising adsorptive material in the decontamination of chromium-polluted water.Conflicts of interest
There are no conflicts to declare.Acknowledgements
We acknowledge the financial support from the National Natural Science Foundation of China (21676039) and the Opening Foundation of State Key Laboratory of Inorganic Synthesis and Preparative Chemistry of Jilin University (2016-04) for this work.References
- H. Gu, S. Rapole, Y. Huang, D. Cao, Z. Luo, S. Wei and Z. Guo, J. Mater. Chem. A, 2013, 1, 2011–2021 CAS.
- R. Anderson, Regul. Toxicol. Pharmacol., 1997, 26, S35–S41 CrossRef CAS PubMed.
- W. Zheng, Q. An, Z. Lei, Z. Xiao, S. Zhai and Q. Liu, RSC Adv., 2016, 6, 104897–104910 RSC.
- X. Lv, J. Xu, G. Jiang, J. Tang and X. Xu, J. Colloid Interface Sci., 2012, 369, 460–469 CrossRef CAS PubMed.
- T. Liu, Z. Wang, L. Zhao and X. Yang, Chem. Eng. J., 2012, 189, 196–202 CrossRef.
- L. Keith, Environ. Sci. Technol., 1979, 13, 416–423 CrossRef.
- S. Rengaraj, C. Joo, Y. Kim and J. Yi, J. Hazard. Mater., 2003, 102, 257–275 CrossRef CAS PubMed.
- R. Goyal, N. Jayakumar and M. Hashim, J. Hazard. Mater., 2011, 195, 383–390 CrossRef CAS PubMed.
- J. Dui, G. Zhu and S. Zhou, ACS Appl. Mater. Interfaces, 2013, 5, 10081–10089 CAS.
- P. Hu, X. Liang, M. Yaseen, X. Sun, Z. Tong, Z. Zhao and Z. Zhao, Chem. Eng. J., 2018, 332, 608–618 CrossRef CAS.
- L. Lin, S. Zhai, Z. Xiao, Y. Song, Q. An and X. Song, Bioresour. Technol., 2013, 136, 437–443 CrossRef CAS PubMed.
- L. Zhang, W. Xia, X. Liu and W. Zhang, J. Mater. Chem. A, 2015, 3, 331–340 CAS.
- X. Lei, X. Xue and H. Yang, Appl. Surf. Sci., 2014, 321, 396–403 CrossRef CAS.
- B. Saha and C. Orvig, Coord. Chem. Rev., 2010, 254, 2959–2972 CrossRef CAS.
- A. Albadarin, C. Mangwandi, A. Al-Muhtaseb, G. Walker, S. Allen and M. Ahmad, Chem. Eng. J., 2012, 179, 193–202 CrossRef CAS.
- D. Mulange Wa Mulange and A. Garbers-Craig, J. Hazard. Mater., 2012, 223–224, 46–52 CrossRef CAS PubMed.
- Y. Fan, R. Yang, Z. Lei, N. Liu, J. Lv, S. Zhai, B. Zhai and L. Wang, Korean J. Chem. Eng., 2016, 33, 1416–1424 CrossRef CAS.
- A. Kumar, S. Kalidhasan, V. Rajesh and N. Rajesh, Ind. Eng. Chem. Res., 2012, 51, 58–69 CrossRef CAS.
- B. Adhikari, M. Gurung, S. Alam, B. Tolnai and K. Lnoue, Chem. Eng. J., 2013, 231, 190–197 CrossRef CAS.
- Y. Yan, Q. An, Z. Xiao, W. Zheng and S. Zhai, Chem. Eng. J., 2017, 313, 475–486 CrossRef CAS.
- R. Li, Q. An, Z. Xiao, B. Zhai and S. Zhai, RSC Adv., 2017, 7, 40227–40236 RSC.
- C. Liu, R. Jin, X. Ouyang and Y. Wang, Appl. Surf. Sci., 2017, 408, 77–87 CrossRef CAS.
- H. Qiao, Y. Zhou, F. Yu, E. Wang, Y. Min, Q. Huang, L. Pang and T. Ma, Chemosphere, 2015, 141, 297–303 CrossRef CAS PubMed.
- X. Xiong, J. Duan, W. Zou, X. He and W. Zheng, J. Membr. Sci., 2010, 363, 96–102 CrossRef CAS.
- L. Zhao and H. Mitomo, J. Appl. Polym. Sci., 2008, 110, 1388–1395 CrossRef CAS.
- Y. Zhao, H. Shen, S. Pan, M. Hu and Q. Xia, J. Mater. Sci., 2010, 45, 5291–5301 CrossRef CAS.
- X. Tian, W. Wang, Y. Wang, S. Komarneni and C. Yang, Microporous Mesoporous Mater., 2015, 207, 46–52 CrossRef CAS.
- B. Chen, X. Zhao, Y. Liu, B. Xu and X. Pan, RSC Adv., 2015, 5, 1398–1405 RSC.
- Y. Pang, G. Zeng, L. Tang, Y. Zhang, Y. Liu, X. Lei, Z. Li, J. Zhang, Z. Liu and Y. Xiong, Chem. Eng. J., 2011, 175, 222–227 CrossRef CAS.
- A. Donia, A. Atia and F. Abouzayed, Chem. Eng. J., 2012, 191, 22–30 CrossRef CAS.
- G. Bayramoğlu and M. Arica, Chem. Eng. J., 2008, 139, 20–28 CrossRef.
- G. Zhao, J. Li, X. Ren, C. Chen and X. Wang, Environ. Sci. Technol., 2011, 45, 10454–10462 CrossRef CAS PubMed.
- X. Sun, Y. Ma, X. Liu, S. Wang, B. Gao and X. Li, Water Res., 2010, 44, 2517–2524 CrossRef CAS PubMed.
- Q. Cao, F. Huang, Z. Zhuang and Z. Lin, Nanoscale, 2012, 4, 2423–2430 RSC.
- R. Yu, Y. Shi, D. Yang, Y. Liu, J. Qu and Z. Z. Yu, ACS Appl. Mater. Interfaces, 2017, 9, 21809–21819 CAS.
- D. Setyono and S. Valiyaveettil, J. Hazard. Mater., 2016, 302, 120–128 CrossRef CAS PubMed.
- X. Sun, L. Yang, Q. Li, Z. Liu, T. Dong and H. Liu, Chem. Eng. J., 2015, 262, 101–108 CrossRef CAS.
- L. Zhuang, Q. Li, J. Chen, B. Ma and S. Chen, Chem. Eng. J., 2014, 253, 24–33 CrossRef CAS.
- J. Goel, K. Kadirvelu, C. Rajagopal and V. Garg, J. Hazard. Mater., 2005, 125, 211–220 CrossRef CAS PubMed.
- Q. Li, X. Tang, Y. Sun and H. Xu, RSC Adv., 2015, 5, 25337–25347 RSC.
- H. Thomas, J. Am. Chem. Soc., 1944, 66, 1664–1666 CrossRef CAS.
- Y. Liu, G. Zhong, Z. Liu, M. Meng, Y. Jiang, L. Ni, W. Guo and F. Liu, RSC Adv., 2015, 5, 85691–85704 RSC.
- L. Yun, H. Liu, R. Gao, S. Xiao, Z. Ming, Y. Yin, S. Wang, L. Jian and D. Yang, ACS Appl. Mater. Interfaces, 2016, 8, 29179–29185 Search PubMed.
- J. Sun, X. Sun, H. Zhao and R. Sun, Polym. Degrad. Stab., 2004, 84, 331–339 CrossRef CAS.
- W. Li, A. Jin, C. Liu, R. Sun, A. Zhang and J. Kennedy, Carbohydr. Polym., 2009, 78, 389–395 CrossRef CAS.
- Z. Du, T. Zheng, P. Wang, L. Hao and Y. Wang, Bioresour. Technol., 2016, 201, 41–49 CrossRef CAS PubMed.
- H. Liang, X. Cao, W. Zhang, H. Lin, F. Zhou, L. Chen and S. Yu, Adv. Funct. Mater., 2011, 21, 3851–3858 CrossRef CAS.
- Y. Pang, G. Zeng, L. Tang, Y. Zhang, Y. Liu, X. Lei, Z. Li, J. Zhang, Z. Liu and Y. Xiong, Chem. Eng. J., 2011, 175, 222–227 CrossRef CAS.
- S. Babel and T. Kurniawan, Chemosphere, 2004, 54, 951–967 CrossRef CAS PubMed.
- K. Low, C. Lee and A. Ng, J. Environ. Sci. Health, Part A: Environ. Sci. Eng. Toxic Hazard. Subst. Control, 1997, 23, 1849–1860 CrossRef.
- J. Li, X. Miao, Y. Hao, J. Zhao, X. Sun and L. Wang, J. Colloid Interface Sci., 2008, 318, 309–314 CrossRef CAS PubMed.
- X. Sun, L. Yang, Q. Li, J. Zhao, X. Li, X. Wang and H. Liu, Chem. Eng. J., 2014, 241, 175–183 CrossRef CAS.
- L. Li, L. Fan, M. Sun, H. Qiu, X. Li, H. Duan and C. Luo, Colloids Surf., B, 2013, 107, 76–83 CrossRef CAS PubMed.
Footnote |
| † Electronic supplementary information (ESI) available. See DOI: 10.1039/c7ra09940a |
| This journal is © The Royal Society of Chemistry 2017 |

