 Open Access Article
Efficiently improving the adsorption capacity of the Rhodamine B dye in a SO3H-functionalized chromium-based metal–organic framework†
Khang M. V.
Nguyen
,
Anh V. N.
Phan
,
Nhung T.
Dang
,
Truong Q.
Tran
,
Huy K.
Duong
,
Hung N.
Nguyen
and
My V.
Nguyen
 *
*
Faculty of Chemistry, Ho Chi Minh City University of Education, Ho Chi Minh City, 700000, Vietnam. E-mail: mynv@hcmue.edu.vn
First published on 1st June 2023
Abstract
A metal–organic framework containing metal sites of chromium, termed BUT-8(Cr), was successfully fabricated via a solvothermal procedure, which is capable of excellent uptake of the Rhodamine B (RhB) dye from the solution. The removal of the RhB dye using BUT-8(Cr) was studied in terms of solution pH, material content, adsorption isotherms, and kinetics to identify the most favorable conditions. Accordingly, the maximum adsorption capacity of 811.7 mg g−1 is well-fitted by the Langmuir isotherm model, which is much higher than those of previously reported MOF materials. Furthermore, the kinetic data for the RhB adsorption fit with the pseudo-second order model. This indicates that RhB uptake is a chemical process. The recycling test result shows that an efficiency of 94.5% is retained over seven recycles. The comparison of the results of FT-IR and Raman spectroscopy, and PXRD, and TGA-DSC analyses of RhB⊂BUT-8(Cr) reveals the presence of electrostatic and π–π interactions between the RhB+ ions and negatively charged SO3− moieties within the MOF architecture, leading to RhB removal with an ultra-high adsorption capacity. These findings show that the sulfonic-functionalized Cr-based MOF could be a promising candidate for removing organic dyes in a real polluted environment.
1. Introduction
To date, various treatment techniques have been developed to find solutions for organic dye elimination in wastewater. These dyes are popular colorants used in textile, paint, cosmetics, leather, visualizing microplastics, and related industries,1–3 released directly into the natural water environment. Rhodamine B (RhB) is a toxic cationic dye of the xanthene class. The presence of RhB in water sources brings negative effects on human health and ecosystems. Particularly, it causes skin and eye irritation, neurotoxicity, and serious problems to the photosynthetic process of aquatic plants and is a cancer-causing agent.4–8 Herein, the aromatic rings in the structure of RhB make it more stable and harder to be biologically oxidated or eliminated photocatalytically.9 Hence, dye-effluent treatment techniques and their developments turn out to be research challenges. Generally, the removal of organic dyes can be performed using various methods, including precipitation–deposition, electrocoagulation, membrane filtration, advanced oxidation, and electrochemical techniques.10–19 Apart from the stated procedures, adsorption is considered the most effective treatment method because of its economic feasibility, easy operation, simplicity, and high efficiency.20–23 Recently, adsorbents have been utilized to separate organic dyes from wastewater, such as activated carbon,24 fibers,25 metal oxides,26 biosorbents,27–29 clay,30 graphene oxide,31 and zeolites.32 However, these materials still have disadvantages in the adsorption applications due to their low capacity, slow kinetics, complex processes, and being economically unattractive in some cases. Therefore, preparing and employing alternative adsorbents for organic dye elimination from wastewater is highly desirable. Among the recently discovered adsorbents, metal–organic frameworks (MOFs) are known for their porous morphology with adjustable pore size and modification of functional groups on the ligand, resulting in remarkable advantages such as large surface area, low density, and high thermal and chemical stability.33–38 Interestingly, the MOF structure can be controlled, allowing the generation of effective interactions between guest molecules and the adsorption sites, opening unique applications related to adsorption.39–44 Noteworthily, chromium-based MOFs have emerged as ultra-high water stable materials because of their robust metal-carboxylate bonds and rigid frameworks, leading to many applications of adsorption under practical conditions.45,46It should be noted that the molecular size of RhB exhibits unsimilarity with the pore size of traditional absorbents and a lack of strong attraction with the adsorption sites of the materials, resulting in a low adsorption efficiency of RhB.47,48 Thus, it is necessary to incorporate negatively charged adsorption sites and achieve appropriate pore sizes within MOFs for significantly enhancing the adsorption capacity of the cationic RhB ions through efficient interactions. In addition, we reported a series of Zr-based MOFs containing densely packed SO3− groups within the framework with an excellent adsorption capacity of Pb2+ and the cationic methylene blue dye via the effective electrostatic interaction between the positively charged moieties and anionic sulfonic sites.40,41 Nevertheless, these materials possess an unsuitable pore size compared to the size of RhB molecules, leading to an insufficient adsorption capacity of RhB (ca. 42 mg g−1). With this in mind, we expect that the BUT-8(Cr) material with high water stability, appropriate pore size and effective electrostatic interaction between the guest molecules and the functional groups can be a potential candidate for achieving high efficiency in RhB removal from wastewater. This is a new approach to overcome the mentioned obstacles of the adsorption uptake using the previously established adsorbents.
In this study, we perform a research study using a sulfonic-functionalized Cr-based MOF, denoted as BUT-8(Cr), to effectively uptake the RhB dye via the electrostatic attraction between the positively charged RhB ions and the negatively charged SO3 moieties. As a consequence, BUT-8(Cr) showed a maximum experimental adsorption capacity of 811. 7 mg g−1 for RhB at pH = 3 and could be recycled at least seven times. Remarkably, the structural characteristics and adsorption mechanism of RhB onto BUT-8(Cr) were interpreted via the adsorption models combined with the methods such as Fourier transform infrared (FT-IR) spectroscopy, Raman spectroscopy, powder X-ray diffraction (PXRD), and thermogravimetric analysis (TGA). These obtained data demonstrate that the BUT-8(Cr) material has potential applications as an effective absorbent to capture RhB dyes from an aqueous medium.
2. Experimental section
Materials and general procedures
All the utilized chemicals, including 2,6-napthalenedicarboxylic acid (H2NDC, 98%), chromium nitrate (Cr(NO3)3·9H2O, 98%), oleum (SO3 in concentrated H2SO4, 20%), N,N-dimethylformamide (DMF, 98%), hydrochloric acid (HCl, 37%), hydrofluoric acid (HF, 47%), and methanol (MeOH, 99%) were purchased from commercially available sources and used without further purification. Herein, the 4,8-disulfonaphthalene-2,6-dicarboxylic acid (H4SNDC) linker and MIL-101-NDC were prepared according to the previously reported works.40,41,49,50Raman spectroscopy analysis was performed on a spectrometer (XploRA one 532 nm, Horiba). Fourier transform infrared (FT-IR) spectra were obtained on a spectrometer with the Attenuated Total Reflectance sampling method (FT/IR-6600, Jasco). Powder X-ray diffraction data were obtained on a diffractometer (D8 Advance, Bruker) using a Ni filtered Cu Kα source (λ = 1.54718 Å). The 2θ range was 3–50° with a step size of 0.02° and a fixed counting time of 0.5 s/step. Thermogravimetric analysis (TGA) and differential scanning calorimetry (DSC) diagrams were obtained on a thermal analysis system (Labsys Evo 1600 TGA, SETARAM) under dry airflow and in the temperature range of 25–800 °C at a rate of 10 °C min−1. Solution 1H-NMR spectra were analyzed on an NMR spectrometer (AVANCE Neo 600 MHz, Bruker). Accordingly, H+⊂BUT-8(Cr) was digested in DMSO-d6 solution containing 10 μL of HF. Then, the mixture was sonicated for 10 minutes before 1H-NMR measurement. Low pressure N2 adsorption analyses were performed on a surface characterization analyzer (3Flex, Micromeritics). Helium was used for the estimation of dead space. A liquid N2 bath was employed for measurements at 77 K. Before N2 sorption measurements, the material was activated at 80 °C under vacuum (10−2 kPa) for 48 h. Scanning electron microscopy (SEM) images were acquired utilizing a microscope (FESEM S-4800, Hitachi) with an accelerating voltage of 10 kV connected to energy-dispersive X-ray (EDX) mapping analyzed on an instrument (EDX H-7593, Horiba). Transmission electron microscopy (TEM) was carried out using a microscope (Jeon 1010, Hitachi) with a high voltage of 80 kV. UV-Vis spectra were obtained on a spectrometer (Lambda 25, PerkinElmer). Notably, the surface area was determined using Materials Studio 7.0 software with a grid interval of 0.25 Å and a solvent diameter of 3.68 Å. The accessible solvent surface for a unit cell was indicated in the analysis tab and used for counting the value of surface area per gram (Table S1 and Fig. S10, ESI†).
Synthesis of DMA⊂BUT-8(Cr)
According to the previously reported work,49 a mixture of Cr(NO3)3·9H2O (0.400 g, 1 mmol) and H4SNDC (0.376 g; 1 mmol) was dissolved in a 20 mL vial containing 6 mL of DMF solvent. The mixture was then transferred into a 20 mL Teflon-lined stainless-steel autoclave and 110 μL hydrofluoric acid was added. The autoclave was heated at 190 °C for 24 h, and then slowly cooled to room temperature. Subsequently, the obtained solid was washed with the DMF solvent and then continuously soaked in hot DMF (80 mL) and deionized water (200 mL) for 24 h, respectively. After washing three times with distilled water, the mixture was immersed in MeOH for 24 h (10 mL per 4 h). Finally, the sample was collected by centrifugation and dried under dynamic vacuum at 80 °C for 24 h to yield a pure material, termed pristine BUT-8(Cr) (DMA⊂BUT-8(Cr), DMA = dimethylammonium) (88% yield, based on Cr3+). FT-IR (cm−1, ATR): 3404 (w), 3073 (w), 2794 (w), 2461 (w), 1701 (w), 1608 (m), 1464 (w), 1412 (s), 1362 (s), 1213 (w), 1171 (s), 1032 (s), 791 (w), 768 (m), 628 (w).Synthesis of H+⊂BUT-8(Cr)
The activated DMA⊂BUT-8(Cr) was further soaked in 100 mL of a sulfuric acid solution (0.3 M) for 48 h (5 times per 24 h). The mixture was washed with distilled water, centrifuged, and exchanged with MeOH for 24 h (5 times per 24 h). The final product was collected and dried under dynamic vacuum at 80 °C for 24 h to obtain a pure green powder, termed H+⊂BUT-8(Cr) (80% yield, based on Cr3+). 1H-NMR (digested H+⊂BUT-8(Cr), DMSO-d6, 600 MHz): δ = 9.57 (s, 2H), and 8.48 (s, 2H), (see ESI,† Fig. S1). FT-IR (cm−1, ATR): 1694 (w), 1614 (s), 1416 (s), 1368 (s), 1216 (w), 1159 (s), 1030 (s), 919 (w), 791 (w), 768 (m), 628 (w).Adsorption experiment
All experiments were carried out under a constant stirring rate (300 rpm) and at room temperature. The influences of variables, including the pH, adsorbent dosage, adsorption kinetics, and isotherms, were determined in batch mode. The initial pH was adjusted from 2 to 10 by adding 0.01 M NaOH or HCl solutions using a pH meter. The amount of adsorbent dosage (5–25 mg) was surveyed with the initial concentration of RhB (200 mg L−1) to identify the optimal dosage. The adsorption isotherms were determined by observing optimal dosage with different initial concentrations of the RhB dye (25–175 mg L−1). The RhB concentrations remaining in the solution after 24 h were analyzed. To investigate the adsorption kinetics, the mixture was continuously stirred with specific intervals from 5 to 150 min. In each experiment, the adsorbent was separated via centrifugation to collect the filtrate for determining the remaining RhB concentration using UV-Vis spectrophotometer analysis at a maximum wavelength of 553 nm. The concentration of RhB was confirmed by using a calibration curve made from the standard solutions (Fig. S2, ESI†).The RhB removal percentage (R%), the equilibrium (qe) and interval adsorption capacity (qt) were determined using the following equations:
 | (1) |
 | (2) |
 | (3) |
Reusability
To evaluate the regeneration of H+⊂BUT-8(Cr), the adsorption–desorption cycles were performed. In detail, the adsorbed RhB⊂BUT-8(Cr) material was immersed in ethanol (pH = 7) with constant stirring for 24 h followed by centrifugation to separate the solid from the aqueous medium. The obtained solution was analyzed using a UV-Vis spectrophotometer to inspect if any RhB signal appeared at a wavelength of 553 nm. Then, the separated solid was soaked in ethanol. This process was repeated many times until no signals of RhB were presented. Finally, the desorbed material was collected before vacuum-drying at 80 °C for 24 h and then tested for continuous adsorption studies.3. Results and discussion
Synthesis and structural characterization of BUT-8(Cr)
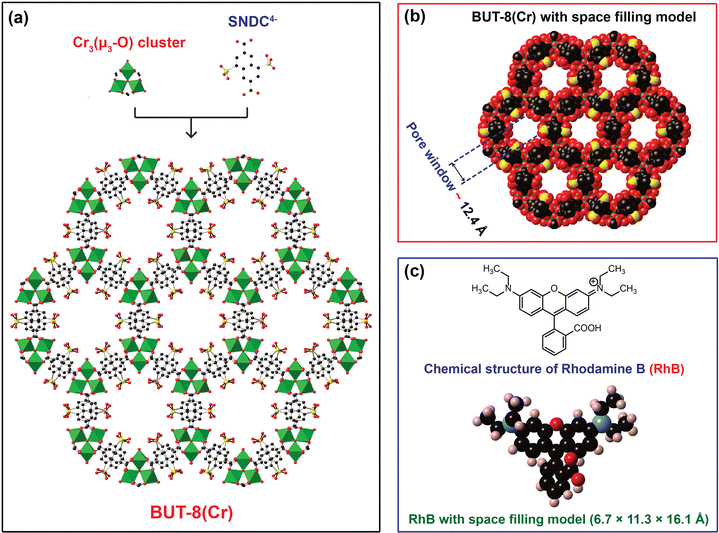
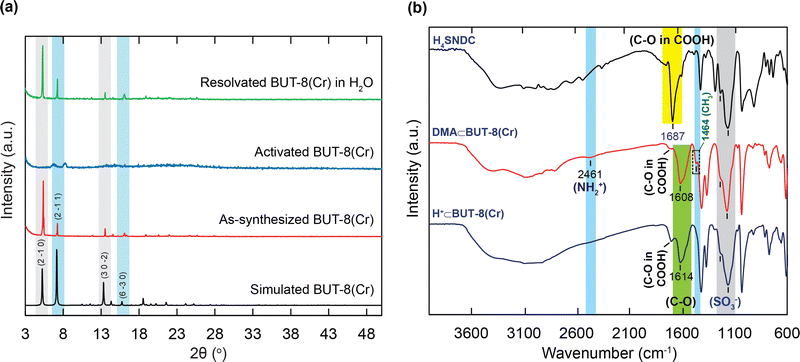
In order to confirm the influence of the sulfonic groups within BUT-8(Cr) on the adsorption capacity of RhB, we have fabricated two Cr-based MOF materials, namely MIL-101-NDC and BUT-8(Cr). Accordingly, the structure of MIL-101-NDC crystallizes in the cubic space group of Fd-3, generated by trimeric {Cr3(OH)(H2O)2(μ3-O)} units and unfunctionalized ligand of NDC2−.50 MIL-101-NDC contains two kinds of pore windows with diameters of approximately 13.5 and 18.2 Å, respectively. With this feature, MIL-101-NDC is unsuitable for RhB adsorption with ultra-high capacity because of the lack of negatively charged moieties to efficiently uptake the cationic RhB ions. Meanwhile, the structure of BUT-8(Cr) is constructed from the Cr3(μ3-O) clusters and SO3H-functionalized linkers with a cage window of 12.4 Å (Fig. 1). Noteworthily, BUT-8(Cr) adopts densely packed SO3H moieties and an appropriate cage window diameter, capable of effectively capturing the positively charged RhB molecules over the framework through robust electrostatic attraction.The pristine BUT-8(Cr) was fabricated by heating the the mixture of Cr(NO3)3·9H2O salt and H4SNDC linker in DMF solvent in the presence of hydrofluoric acid as a modulator at 190 °C for 24 h. The phase purity of the as-synthesized BUT-8(Cr) product was demonstrated by powder X-ray diffraction (PXRD) analysis with the typical peaks indexed to (2−10), (2−11), (30−2), and (6−30), which is in good agreement with the simulated BUT-8(Cr) (Fig. 2a). Notably, the dimethylammonium (DMA) ions appeared due to the decomposition of DMF during the reaction process. However, the SO3H groups functionalized within BUT-8(Cr) with the anionic forms can effectively balance the positively charged sites of the DMA+ ions, resulting in the generation of a rigid backbone capable of retaining the structural order.
To recover the sulfonic groups inside BUT-8(Cr) for facilitating the formation of perfect uptake space for RhB adsorption, we performed the exchange of the DMA+ ions with an excess amount of H+ ions by immersing the pristine BUT-8(Cr) in 0.3 M H2SO4 solution. The material was washed with an abundant amount of distilled water until pH = 5 and then dried under vacuum at 80 °C for 24 h to acquire a new product, denoted as H+⊂BUT-8(Cr). To demonstrate whether the DMA+ ions are fully released out of the MOF structure, the activated H+⊂BUT-8(Cr) was digested by the HF medium and dissolved in a d6-DMSO solution for 1H-NMR measurement. As a result, the DMA signals are no longer present in the digested H+⊂BUT-8(Cr) sample (Fig. S1, ESI†). From this, it can be concluded that the exchange process of protons onto BUT-8(Cr) has been successfully conducted. Significantly, the activated H+⊂BUT-8(Cr) has a low crystallinity with broadened diffraction peaks because of the high flexibility of the sulfonic groups (Fig. 2a). This can clearly explain that the guest solvent molecules strongly interact with the sulfonate moieties via the hydrogen bonding networks. These solvent molecules will be released from the structure of H+⊂BUT-8(Cr) after activation, leading to a structural order loss. This is also in line with the N2 adsorption analysis for the H+⊂BUT-8(Cr) (Fig. S8 and S9, ESI†); the BET and Langmuir surface areas of the activated H+⊂BUT-8(Cr) (61.41 and 66.77 m2 g−1, respectively) are much lower than the theoretically predicted value (2751 m2 g−1, see Fig. S10 and Table S1, ESI†). H+⊂BUT-8(Cr) possesses high flexibility upon activation, leading to a significant decrease in the surface area. This situation is also observed with the sulfonic-functionalized MOF materials in the previous reports.19,40,41,49,51 Interestingly, the PXRD signals appear similar to the simulated structure when the activated H+⊂BUT-8(Cr) is resolvated in water. To demonstrate the promising application under practical conditions, the chemical stability of H+⊂BUT-8(Cr) was tested by immersing it in an aqueous medium. Accordingly, the structural order of the material is retained after being soaked in water for 30 days, as evidenced from the PXRD analysis results (Fig. S11, ESI†).
Next, the FT-IR spectra of DMA⊂BUT-8(Cr) and H+⊂BUT-8(Cr) (Fig. 2b) show the signals at 1178 cm−1 and 1190 cm−1, which can be assigned to the presence of the SO3− functional group in the H4SNDC linker and both types of BUT-8(Cr). This result indicates the SO3− functionalization into the BUT-8(Cr) materials. Furthermore, the bands of C–O in the carboxylate group of DMA⊂BUT-8(Cr) and H+⊂BUT-8(Cr) are at 1614 cm−1 and 1608 cm−1, respectively, reflecting the lower vibrational frequency of this band in the carboxylate group of H4SNDC (1687 cm−1). It is realized that the resonance in the carboxylate group causes the bond multiplicity to decrease. Thus the wavenumber tends to be lower than the initial signals. The peaks at 2461 cm−1 and 1464 cm−1 recorded for the DMA⊂BUT-8(Cr) sample are attributed to the presence of -NH2+ and -CH3 groups in (CH3)2NH2+, which are absent in the sample of H+⊂BUT-8(Cr).
Additionally, the EDX-mapping data of H+⊂BUT-8(Cr) have also revealed the absence of nitrogen element, showing that all of the DMA+ ions are completely removed. In fact, both the H+ and DMA+ ions can freely diffuse inside and outside the pores of the material (Fig. S3, ESI†). The surface morphology of H+⊂BUT-8(Cr) is characterized by SEM and TEM images (Fig. S4 and S5, ESI†), which show that H+⊂BUT-8(Cr) crystallizes as globular particles with a size of approximately 2 μm and possess a high agglomeration of the particles. This leads to the difficult observation of the porous texture of the MOF particles from the TEM data.
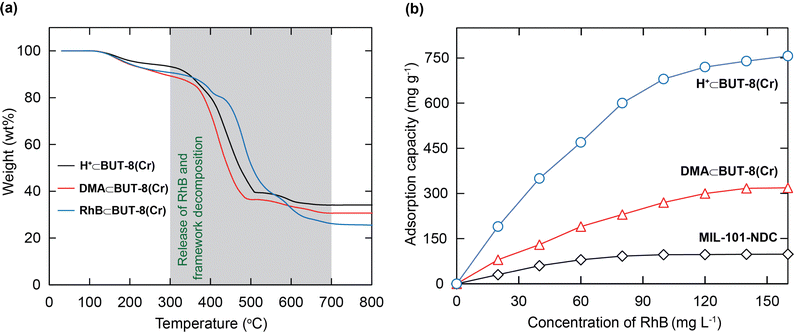
For further studies on the thermal stability of the material, thermal gravimetric analysis (TGA) was also conducted on the activated samples, including the DMA⊂BUT-8(Cr), H+⊂BUT-8(Cr), and RhB⊂BUT-8(Cr) samples. The TGA curves are measured under dry air and are illustrated in Fig. 3a. In detail, two weight losses can be observed from these three samples, before 300 °C and between 300 and 700 °C, respectively. The first step, with approximately 5 wt% weight loss, can be assigned to the evaporation of the coordinated and absorbed water molecules. The second step with significant weight loss (ca. 57–60 wt%) can be attributed to the release of the RhB molecules and the decomposition of the framework of all samples. As a result, BUT-8(Cr) has high thermal stability up to 300 °C, which opens promising adsorption applications under practical conditions.
In order to gain deeper insight into the influence of the number of sulfonic moieties within the MOF backbone on the RhB uptake capacity, a series of experiments were performed. Consequently, 10 mg of each, MIL-101-NDC, DMA⊂BUT-8(Cr), and H+⊂BUT-8(Cr), is introduced into 100 mL of various RhB solutions with an initial concentration range of 20 to 160 mg L−1 at a pH value of 3. As a consequence, the RhB adsorption capacities at 160 mg L−1 concentration on MIL-101-NDC, DMA⊂BUT-8(Cr), and H+⊂BUT-8(Cr) are 98.3, 318.6, and 756.9 mg g−1, respectively (Fig. 3b).
It is realized that the increase in the RhB uptake in the presence of a large amount of SO3H groups within the structure of H+⊂BUT-8(Cr) can be ascribed to the increased electrostatic interaction between the cationic RhB ions and the formation of SO3− in the pores of the material. DMA⊂BUT-8(Cr) displays a lower adsorption capacity of RhB than H+⊂BUT-8(Cr) due to the presence of DMA+ ions preventing the entry of the RhB molecules into the pores. Meanwhile, MIL-101-NDC exhibits the lowest adsorption capacity for RhB because of the lack of sulfonic moieties within its framework. Following the gained data, we choose the H+⊂BUT-8(Cr) material to study the further adsorption experiments of RhB in this work.
Influence of pH and ionic strength
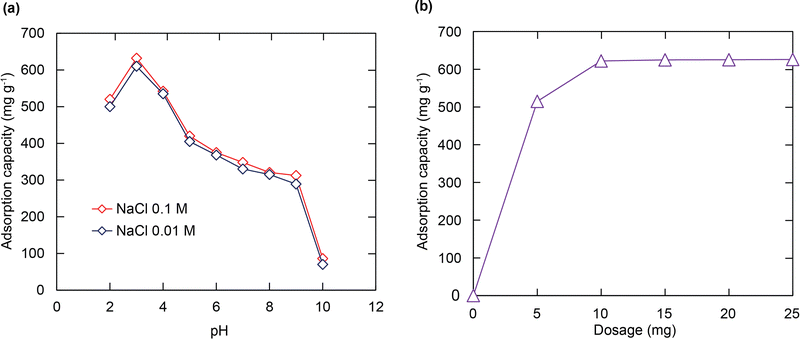
To explore the effect of pH on the RhB capture from the soulution, initial pH values ranging from 2 to 10 affecting the uptake performance of RhB were surveyed. It can be understood from Fig. 4a that the highest RhB adsorption capacity was recorded at pH = 3 and it decreased when the pH values increased. This tendency can be explained through efficient electrostatic interaction between the SO3− groups and the positively charged RhB+ ions. At low pH values, two main processes occur in the solution such as the ionization of RhB to form the cationic RhB ions and the protonation process of SO3− moieties to generate the SO3H or SO3H2+ species.52 These transformation processes lead to the repulsion force or weak interaction between the cationic RhB dye and the protonated forms. However, at higher pH values, the neutral form of RhB is formed through the zwitter ion equilibrium;52 meanwhile SO3− components still existed in this form, which leads to less occupation between the active sites and the adsorbent, resulting in the low uptake of the RhB dye. At pH = 3, a balanced point between these contradictory circumstances is achieved. With all of this considered, the pH value of 3 is selected as an optimal pH value for the subsequent studies. Also, the RhB adsorption onto H+⊂BUT-8(Cr) is weakly dependent on the ionic strength with different solutions of 0.1 M and 0.01 M NaCl. Thus it can be concluded that the adsorption of RhB over the material depends on the inner-sphere complexation via the electrostatic attraction between the sulfonate groups and RhB+ ions rather than the outer-sphere surface complexation.53Effect of adsorbent dose
To determine the optimal dosage of the adsorbent for enhancing the interaction between the adsorption regions within H+⊂BUT-8(Cr) and the RhB molecules, different amounts of activated H+⊂BUT-8(Cr) (5–25 mg) were added to 100 mL of Pb2+ solution (100 mg L−1) at pH = 3 and stirred for 24 h. As shown in Fig. 4b, the adsorption capacity strongly increased from 530 mg g−1 to 630 mg g−1, approximately, as the H+⊂BUT-8(Cr) content increased from 5 to 10 mg, respectively. It is clear to note that the larger mass of the material has opened up more available adsorption space with more effective interaction through adsorption sites. However, the data on adsorption capacity do not show any significant increase when the H+⊂BUT-8(Cr) mass varies from 15 to 25 mg. This circumstance reveals that the adsorption process has reached the equilibrium point. Hence, the adsorption content of 10 mg is selected as the optimum condition of the material content.Adsorption isotherms
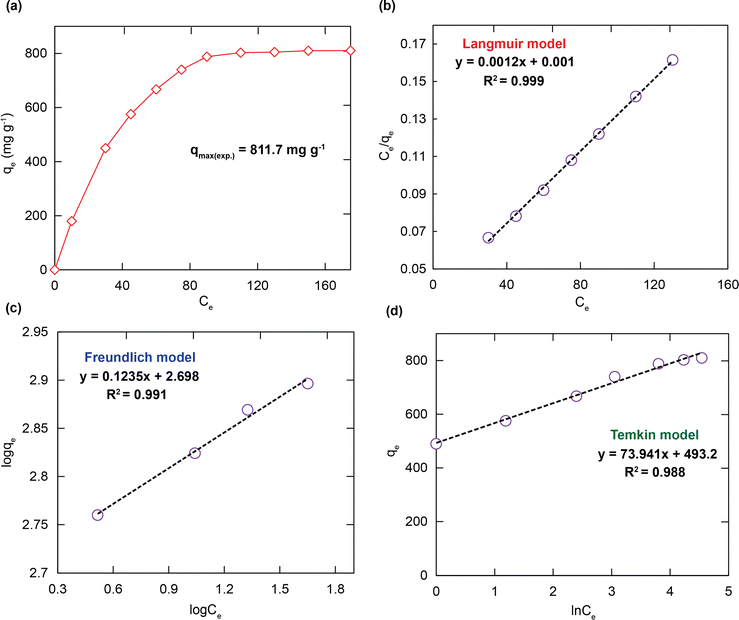
To elucidate the RhB adsorption properties of H+⊂BUT-8(Cr), the adsorption isotherm models were used to illustrate the attraction between the RhB+ ions and the adsorbent specifically. On varying the RhB concentration in the range of 25 to 175 mg L−1, the adsorption uptake of RhB promptly increases with an increase in the initial concentration of RhB. It approaches a maximum adsorption capacity (qm) of 811.7 mg g−1, as shown in Fig. 5a. This is attributed to the appearance of more dense adsorption sites available on H+⊂BUT-8(Cr). The obtained results reveal that the active ranges of H+⊂BUT-8(Cr) are the limiting components for the uptake process of RhB.To interpret the adsorption mechanism of RhB over the material, the adsorption isotherm models such as Langmuir, Freundlich, and Temkin were employed. The linear forms of these models are displayed in the eqn (S1)–(S3) (ESI†). For further application of Langmuir adsorption isotherm models, uniform surface area and monolayer adsorption with limited active sites are assumed. The Freundlich model is applied with the assumption that adsorption processes happen on heterogeneous surfaces generated from the existence of functional groups and interactions between the adsorbent and adsorbate. The Temkin model is applied with the assumption that adsorption heat of all molecules is not involved in a straight line.54
As shown in Fig. 5b–d and Table 1, the calculated R2 value for fitting in the Langmuir model (0.999) is higher than those in the Freundlich model (0.991) and Temkin model (0.988). The theoretical adsorption capacity of RhB estimated from the compatible model is 833.3 mg g−1, which is much more appropriate than the experimental value of 811.7 mg g−1 previously. It can be extrapolated that the material H+⊂BUT-8(Cr) has a uniform distribution of various active sites and monolayer adsorption proves to be more powerful. Besides, the separation factor of RL value (determined using the eqn (S4), ESI†), is obtained to be greater than zero and smaller than 1. These results are appropriate with the chemical adsorption, which is caused by the electrostatic interaction between negatively charged SO3− moieties and the cationic RhB dye and π–π interaction between the aromatic rings of the structure of the organic ligand and the RhB molecules.40,41,51,55
| Isotherm models | Parameters | Value |
|---|---|---|
| Langmuir | q m (mg g−1) | 833.3 |
| K L (L mg−1) | 1.201 | |
| R 2 | 0.999 | |
| Freundlich | 1/n | 0.114 |
| K F (mg g−1 (L g−1)1/n) | 501.2 | |
| R 2 | 0.991 | |
| Temkin | K T (L mg−1) | 788.5 |
| β | 33.51 | |
| R 2 | 0.988 |
Adsorption kinetics
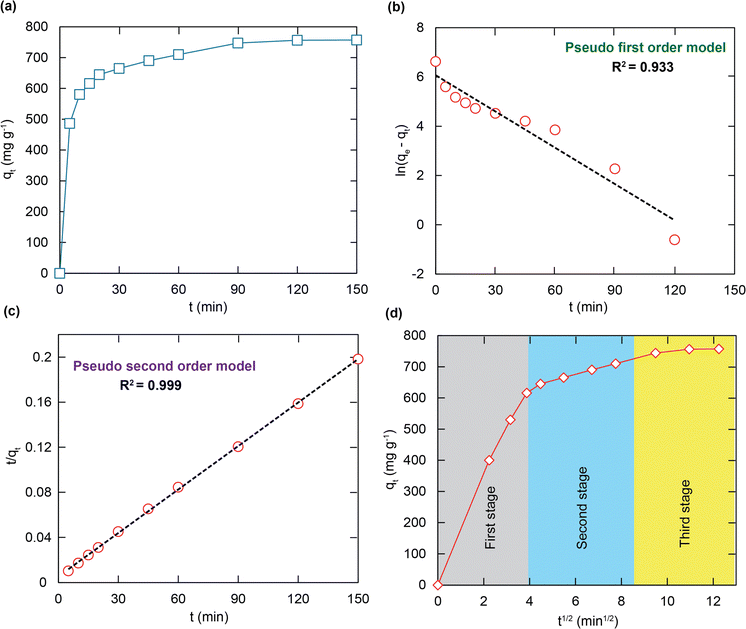
As illustrated in Fig. 6a, the ultra-fast RhB capacity is confirmed through a contact time of 15 minutes to be approximately 620 mg g−1. It is noted that fast removal is promising for overcoming the limitations of traditional adsorbents, leading to a possibility of effectively working in a real aqueous medium. The chemical interaction and diffusion rate are two main elements responsible for the adsorption properties of H+⊂BUT-8(Cr). Consequently, the adsorption capability of this material was surveyed at specific times, with optimum conditions chosen from the previous examination. The gained data were analyzed through pseudo first order, pseudo second order, and intra-particle disffusion models.In general, the pseudo first order model assumes that the adsorption rate is decided by the surface, which can be illustrated in a linear form as follows:
ln(qe − qt) = ln![[thin space (1/6-em)]](https://www.rsc.org/images/entities/char_2009.gif) qe − k1t qe − k1t | (4) |
 | (5) |
The linear equation of the intra-particle diffusion model can be written as follows:
 | (6) |
As shown in Fig. 6b, c and Table 2, it is clear to note that the pseudo first order model is not acceptable for studying the RhB adsorption kinetics onto H+⊂BUT-8(Cr) (R2 = 0.933). Meanwhile, the correlation coefficient of R2 is calculated as 0.999 while fitting to the pseudo second order model, obviously suitable for this adsorption process. Also, the calculated RhB adsorption capacity at equilibrium is 769.2 mg g−1, approximately, which is closely correlated with the experimental value of 811.7 mg g−1. Therefore, the RhB adsorption onto H+⊂BUT-8(Cr) is a chemisorption process through two main interactions: the electrostatic attraction between the RhB+ ions and SO3− components within the framework and the π–π stacking.55–57
| Kinetic models | Parameters | Value |
|---|---|---|
| q e,exp (mg g−1) | 811.7 | |
| Pseudo first order | q e,cal (mg g−1) | 266.1 |
| k 1 (min−1) | 0.014 | |
| R 2 | 0.933 | |
| Pseudo second order | q e,cal (mg g−1) | 769.2 |
| k 2 (g mg−1 min−1) ×10−4 | 3.131 | |
| R 2 | 0.999 |
According to Fig. 6d, the adsorption process can be divided into three stages, with the rate constant values growing from ki1 to ki3. It should be noted that the difference in the RhB diffusion rate was the cause of this decreasing trend. In detail, at the first stage, the RhB molecules diffuse very fast from the solution to the outer surface until becoming fully soaked. Next, the adsorbate molecules turn to move to the inner space surface with an increase in the diffusion resistance. Then, the RhB molecules move inside the pores of H+⊂BUT-8(Cr) at a lower speed, and simultaneously have electrostatic and π–π interaction with the functional groups of the framework until the equilibrium point is reached.40
Regeneration study
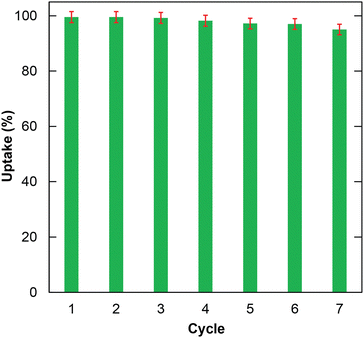
The reusability of the material is considered one of the determining factors for better performance. Herein, the reusability of H+⊂BUT-8(Cr) in the RhB adsorption was investigated for seven cycles. The result in Fig. 7 indicates that the RhB uptake only decreases to 94.5% after seven cycles.In particular, the successful regeneration of H+⊂BUT-8 was proved using the FTIR spectra and PXRD analysis. Accordingly, there is good agreement in the PXRD patterns of H+⊂BUT-8(Cr) products before and after the desorption of RhB (Fig. S6, ESI†). The characteristic bands of H+⊂BUT-8(Cr) after desorption are almost unchanged in comparison with the activated H+⊂BUT-8(Cr) (Fig. S7, ESI†). These findings illustrated that the H+⊂BUT-8(Cr) material could be utilized as a reusable material to eliminate toxic organic dyes from wastewater.
To verify the feasibility of the material, the maximum RhB adsorption capacity of H+⊂BUT-8(Cr) was compared with those of other MOF materials (Table 3). The data reveal that H+⊂BUT-8(Cr) has a larger adsorption capacity than the other materials despite not having a rigid structure via the effective interaction of the cationic RhB ion with the SO3− moieties inside H+⊂BUT-8(Cr). This indicates that the SO3− groups at the internal surface and channel wall of the H+⊂BUT-8(Cr) play a vital role in the RhB capture.
Possible adsorption mechanism
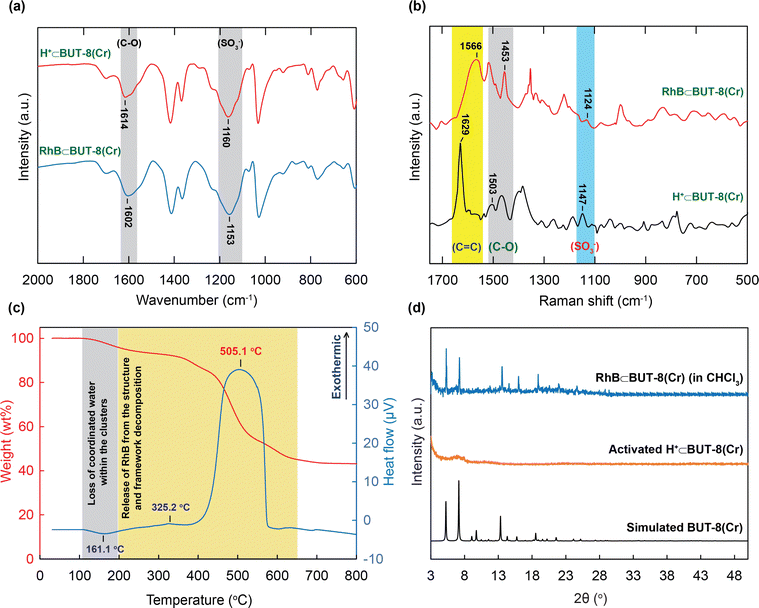
The excellent adsorption performance inspired us to gain a further understanding of the interaction between the active sites within the MOF and the RhB molecules via the analyses of the FT-IR spectra, Raman spectra, PXRD patterns, and TGA-DSC curves.The FT-IR spectrum of RhB⊂BUT-8(Cr) indicates that the characteristic bands of the C–O and S–O shifted to the lower wavenumber ranges at 1604 and 1153 cm−1, respectively (Fig. 8a). These data show efficient attraction between the SO3− groups and the RhB+ ions, driving the generation of the strong ionic bonds of the RhB with sulfonic groups. This situation is in good accordance with the previous studies.19,40,41
Moreover, Raman spectra of RhB⊂BUT-8(Cr) are analyzed and are shown in Fig. 8b. The new vibrational modes are also observed at 1453 and 1124 cm−1, relating to the characteristic frequencies of C–O and S–O, which appear in the RhB⊂BUT-8(Cr) spectrum, but are found at other positions in the H+⊂BUT-8(Cr) sample. This result again demonstrates the effective electrostatic interaction of the positively charged RhB ions and anionic SO3− sites (Scheme 1). In addition, the band derived from the vibration of C![[double bond, length as m-dash]](https://www.rsc.org/images/entities/char_e001.gif) C in the benzene ring of RhB⊂BUT-8(Cr) appears at 1566 cm−1 in comparison with that of H+⊂BUT-8(Cr). This can be accounted for the formation of the π–π stacking attraction via the interaction between the conjugated planar of the benzene rings of the ligands within MOFs and the RhB molecules (Scheme 1).41,65
C in the benzene ring of RhB⊂BUT-8(Cr) appears at 1566 cm−1 in comparison with that of H+⊂BUT-8(Cr). This can be accounted for the formation of the π–π stacking attraction via the interaction between the conjugated planar of the benzene rings of the ligands within MOFs and the RhB molecules (Scheme 1).41,65
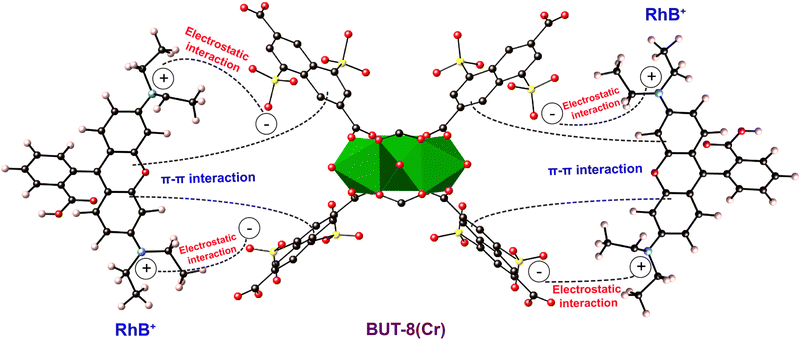 | ||
| Scheme 1 The plausible adsorption mechanism of RhB+ onto BUT-8(Cr). Atom colors: Cr, green polyhedra; C, black; O, red; S, yellow; N, blue. | ||
Besides, the appearance of the RhB dyes inside H+⊂BUT-8(Cr) was verified using the TGA-DSC curve recorded under dry air. As illustrated in Fig. 8c, the TGA-DSC diagram indicates a weight loss of 6.5 wt% from 25 to 250 °C with a specific endothermic peak at 161.1 °C. This is assigned to the loss of coordinated water inside the MOF clusters. From 250 to 700 °C, a huge weight loss is observed and identified for the release of the RhB dyes from the material and the structural decomposition, which are verified using the exothermic peaks appearing at 325.2 and 505.1 °C.
To further prove the mentioned π–π interactions, H+⊂BUT-8(Cr) is soaked in the RhB solution containing a non-polar solvent such as chloroform (CHCl3). Here, using the CHCl3 solvent can support the formation process of the neutral states within BUT-8(Cr) and the RhB molecules. In general, the crystallinity of the activated H+⊂BUT-8(Cr) material disappears after activation. Therefore, we expect that if the RhB dyes are loaded into the structure of BUT-8(Cr), the structural order of the material will retain upon activation. Consequently, the PXRD patterns are collected to inspect whether the RhB molecules have entered into the architecture of BUT-8-Cr. As expected, the PXRD analysis of activated RhB⊂BUT-8(Cr) (immersed in CHCl3) is in good accordance with the simulated BUT-8(Cr). This can demonstrate that the neutral RhB dyes are anchored over the structure of H+⊂BUT-8(Cr) through π–π stacking interactions (Fig. 8d).
4. Conclusion
In summary, a sulfonic-functionalized Cr-based metal–organic framework was successfully synthesized and studied for its adsorption performance in the RhB capture process. It is clear to note that the maximum adsorption capacity for the RhB dye over H+⊂BUT-8(Cr) is gained to be 811.7 mg g−1. This obtained result is much higher than those of the previously reported MOF materials. The data from the adsorption isotherm and kinetic investigations indicate that the RhB adsorption is a chemical process and can be described using the Langmuir isotherm and the pseudo second order models. Moreover, the regeneration experiments show a high removal rate in recycling the material for at least seven cycles. Notably, the adsorption mechanism is elucidated by the experimental analyses. The result reveals that the adsorption mechanism can be depicted in the formation of the chemical bonds via electrostatic attraction between the negatively charged sulfonate moieties and the cationic RhB ions and π–π stacking interaction of the conjugated π planar in the system of benzene rings. This exploration demonstates that the Cr-sulfonic-based MOF exhibits remarkable potential for employment in the removal of the RhB dye from wastewater.Author contributions
M. V. N. formulated this project. M. V. N., K. M. V. N., A. V. N. P, N. T. D., T. Q. T., H. K. D., and H. N. N. synthesized the compounds and collected isotherms, powder X-ray diffraction patterns, FT-IR spectra, and TGA-DSC curves. M. V. N. wrote the paper and all authors contributed to revising it. All authors have given approval to the final version of the manuscript.Conflicts of interest
The authors maintain that they have no conflict of interest for this communication.Acknowledgements
My V. Nguyen gratefully acknowledges the support of this work under the funding of the Ministry of Education and Training, Vietnam, through Grant No. B2023-SPS-07. The project entitled: “Synthesis and evaluation of the adsorption and photocatalytic ability of water-stable MOFs material” (Tong hop và danh gia kha nang hap phu, quang xuc tac cua vat lieu MOFs ben nuoc).References
- A. K. Al-Buriahi, A. A. Al-Gheethi, P. S. Kumar, R. M. S. R. Mohamed, H. Yusof, A. F. Alshalif and N. A. Khalifa, Chemosphere, 2022, 287, 132162 CrossRef CAS PubMed.
- M. Soylak, Y. Unsal, E. Yilmaz and M. Tuzen, Food Chem. Toxicol., 2011, 49, 1796–1799 CrossRef CAS PubMed.
- H. Tong, Q. Jiang, X. Zhong and X. Hu, Environ. Sci. Pollut. Res., 2021, 28, 4209–4215 CrossRef CAS PubMed.
- M. T. Yagub, T. K. Sen, S. Afroze and H. M. Ang, Adv. Colloid Interface Sci., 2014, 209, 172–184 CrossRef CAS PubMed.
- H. Xue, Q. Chen, F. Jiang, D. Yuan, G. Lv, L. Liang, L. Liu and M. Hong, Chem. Sci., 2016, 7, 5983–5988 RSC.
- Y. C. Wong, Y. S. Szeto, W. H. Cheung and G. McKay, Process Biochem., 2004, 39, 693–702 CrossRef CAS.
- D. R. Sulistina and S. Martini, Am. J. Public Health Res., 2020, 9, 101–104 Search PubMed.
- R. Jain, M. Mathur, S. Sikarwar and A. Mittal, J. Environ. Manage., 2007, 85, 956–964 CrossRef CAS PubMed.
- E. Baldev, D. MubarakAli, A. Ilavarasi, D. Pandiaraj, K. A. S. S. Ishack and N. Thajuddin, Colloids Surf., B, 2013, 105, 207–214 CrossRef CAS PubMed.
- S. Jonjana, A. Phuruangrat, N. Ekthammathat, S. Thongtem and T. Thongtem, J. Electron. Mater., 2019, 48, 4789–4796 CrossRef CAS.
- A. I. Adeogun and R. B. Balakrishnan, Appl. Water Sci., 2017, 7, 1711–1723 CrossRef CAS.
- G. Yang, D. Zhang, G. Zhu, T. Zhou, M. Song, L. Qu, K. Xiong and H. A. Li, RSC Adv., 2020, 10, 8540–8547 RSC.
- B. Cuiping, X. Xianfeng, G. Wenqi, F. Dexin, X. Mo, G. Zhongxue and X. Nian, Desalination, 2011, 278, 84–90 CrossRef.
- R. Rathinam and S. Pattabhi, Indian J. Ecol., 2019, 46, 167–174 Search PubMed.
- K. Rokesh, S. C. Mohan, S. Karuppuchamy and K. Jothivenkatachalam, J. Environ. Chem. Eng., 2018, 6, 3610–3620 CrossRef CAS.
- J. Ji, Y. Liu, X. Yang, J. Xu and X. Li, J. Environ. Manage., 2018, 218, 300–308 CrossRef CAS PubMed.
- A. Baddouh, G. G. Bessegato, M. M. Rguiti, B. E. Ibrahimi, L. Bazzi, M. Hilali and M. V. B. Zanoni, J. Environ. Chem. Eng., 2018, 6, 2041–2047 CrossRef CAS.
- Y. Miyah, A. Lahrichi, M. Idrissi, A. Khalil and F. Zerrouq, Surf. Interfaces, 2018, 11, 74–81 CrossRef CAS.
- M. V. Nguyen, H. N. Nguyen, T. A. T. Nguyen and K. M. V. Nguyen, RSC Adv., 2022, 12, 30201–30212 RSC.
- N. Wang, Y. F. Wang, A. M. Omer and X. K. Ouyang, Anal. Bioanal. Chem., 2017, 409, 6643–6653 CrossRef CAS PubMed.
- T. Wu, X. Cai, S. Tan, H. Li, J. Liu and W. Yang, Chem. Eng. J., 2011, 173, 144–149 CrossRef CAS.
- L. Huang, X. Weng, Z. Chen, M. Megharaj and R. Naidu, Spectrochim. Acta, Part A, 2014, 130, 295–301 CrossRef CAS PubMed.
- T. M. Alslaibi, I. Abustan, M. A. Ahmad and A. A. Foul, J. Chem. Technol. Biotechnol., 2013, 88, 1183–1190 CrossRef CAS.
- P. K. Malik, J. Hazard. Mater., 2004, 113, 81–88 CrossRef CAS PubMed.
- K. Porkodi and K. V. Kumar, J. Hazard. Mater., 2007, 143, 311–327 CrossRef CAS PubMed.
- K. Y. Kumar, H. B. Muralidhara, Y. A. Nayaka, J. Balasubramanyam and H. Hanumanthappa, Powder Technol., 2013, 246, 125–136 CrossRef CAS.
- S. K. Das, J. Bhowal, A. R. Das and A. K. Guha, Langmuir, 2006, 22, 7265–7272 CrossRef CAS PubMed.
- S. Ranjbari, A. Ayati, B. Tanhaei, A. Al-Othman and F. Karimi, Environ. Res., 2022, 204, 111961 CrossRef CAS PubMed.
- S. M. Khoshkho, B. Tanhaei, A. Ayati and M. Kazemi, J. Mol. Liq., 2021, 324, 115118 CrossRef CAS.
- S. H. Tabrizi, B. Tanhaei, A. Ayati and S. Ranjbari, Environ. Res., 2022, 204, 111965 CrossRef CAS PubMed.
- X. Wang, Y. Guo, Z. Jia, H. Ma, C. Liu, Z. Liu, Q. Shi, B. Ren, L. Li, X. Zhang and Y. Hu, Desalination, 2021, 516, 115220 CrossRef CAS.
- E. Alver and A. Ü. Metin, Chem. Eng. J., 2012, 200, 59–67 CrossRef.
- Q. L. Zhu and Q. Xu, Chem. Soc. Rev., 2014, 43, 5468–5512 RSC.
- H. C. Zhou, J. R. Long and O. M. Yaghi, Chem. Rev., 2012, 112, 673–674 CrossRef CAS PubMed.
- L. M. Wang, W. Y. Liu, M. L. Hu, J. S. Yao, P. Wang, J. H. Liu, M. He, Y. Gao and Z. X. Li, Rare Met., 2022, 41, 2701–2710 CrossRef CAS.
- Y. M. Lin, H. S. Fan, C. Z. Zhu and J. Xu, Rare Met., 2022, 41, 4104–4115 CrossRef CAS.
- Y. F. Ren, Z. L. He, H. Z. Zhao and T. Zhu, Rare Met., 2022, 41, 830–835 CrossRef CAS.
- C. Hu, P. Pan, H. Huang and H. Liu, Biosensors, 2022, 12, 813 CrossRef CAS PubMed.
- R. M. Rego, G. Sriram, K. V. Ajeya, H. Y. Jung, M. D. Kurkuri and M. Kigga, J. Hazard. Mater., 2021, 416, 125941 CrossRef CAS PubMed.
- T. T. M. Bui, L. T. Nguyen, N. P. H. Pham, C. C. Tran, L. T. Nguyen, T. A. Nguyen, H. N. Nguyen and M. V. Nguyen, RSC Adv., 2021, 11, 36626–36635 RSC.
- C. C. Tran, H. C. Dong, V. T. N. Truong, T. T. M. Bui, H. N. Nguyen, T. A. T. Nguyen, N. N. Dang and M. V. Nguyen, Dalton Trans., 2022, 51, 7503–7516 RSC.
- Z. Hasan and S. H. Jhung, J. Hazard. Mater., 2015, 283, 329–339 CrossRef CAS PubMed.
- M. S. Khan, M. Khalid and M. Shahid, Mater. Adv., 2020, 1, 1575–1601 RSC.
- D. K. Yoo, G. Lee, Md. M. H. Mondol, H. J. Lee, C. M. Kim and S. H. Jhung, Coord. Chem. Rev., 2023, 474, 214868 CrossRef CAS.
- H. Yang, F. Peng, A. N. Hong, Y. Wang, X. Bu and P. Feng, J. Am. Chem. Soc., 2021, 143, 14470–14474 CrossRef CAS PubMed.
- B. Wang, Y. Ma, W. Xu and K. Tang, Langmuir, 2022, 38, 8954–8963 CrossRef CAS PubMed.
- N. Abdolrahimi and A. Tadjarodi, Proceedings, 2019, 41, 51 Search PubMed.
- H. He, K. Chai, T. Wu, Z. Qiu, S. Wang and J. Hong, Materials, 2022, 15, 4058 CrossRef CAS PubMed.
- F. Yang, G. Xu, Y. Dou, B. Wang, H. Zhang, H. Wu, W. Zhou, J. Li and B. Chen, Nat. Energy, 2017, 2, 877–883 CrossRef CAS.
- A. Sonnauer, F. Hoffmann, M. Fröba, L. Kienle, V. Duppel, M. Thommes, C. Serre, G. Férey and N. Stock, Angew. Chem., 2009, 121, 3849–3852 CrossRef.
- M. J. Uddin, R. E. Ampiaw and W. Lee, Chemosphere, 2021, 284, 131314 CrossRef CAS PubMed.
- I. Arbeloa and P. Ojeda, Chem. Phys. Lett., 1981, 79, 347–350 CrossRef CAS.
- H. Zhu, J. Wu, M. Fang, L. Tan, C. Chen, N. Alharbi, T. Hayat and X. Tan, RSC Adv., 2017, 7, 36231–36241 RSC.
- Z. He, Y. Yang, P. Bai and X. Guo, J. Ind. Eng. Chem., 2019, 77, 262–272 CrossRef CAS.
- J. A. S. Costa, V. H. Sarmento, L. P. Romão and C. M. Paranhos, Biomass Convers. Biorefin., 2020, 10, 1105–1120 CrossRef CAS.
- C. X. Yu, K. Z. Wang, X. J. Li, D. Liu, L. F. Ma and L. L. Liu, Cryst. Growth Des., 2020, 20, 5251–5260 CrossRef CAS.
- H. Wang, D. B. Jiang, J. Gu, L. Ouyang, Y. X. Zhang and S. Yuan, Ind. Eng. Chem. Res., 2020, 59, 6065–6077 CrossRef CAS.
- J. Zhang, F. Li and Q. Sun, Appl. Surf. Sci., 2018, 440, 1219–1226 CrossRef CAS.
- H. Liu, X. Ren and L. Chen, J. Ind. Eng. Chem., 2016, 34, 278–285 CrossRef CAS.
- H. Tian, J. Peng, T. Lv, C. Sun and H. He, J. Solid State Chem., 2018, 257, 40–48 CrossRef CAS.
- B. Li, W. Jiang, Y. Xu, Z. Xu, Q. Yan and G. Yong, Dyes Pigm., 2020, 174, 108017 CrossRef CAS.
- L. Zeng, L. Xiao, Y. Long and X. Shi, J. Colloid Interface Sci., 2018, 516, 274–283 CrossRef CAS PubMed.
- H. Guo, F. Lin, J. Chen, F. Li and W. Weng, Appl. Organomet. Chem., 2015, 29, 12–19 CrossRef CAS.
- C. Yang, S. Wu, J. Cheng and Y. Chen, J. Alloys Compd., 2016, 687, 804–812 CrossRef CAS.
- G. Vijayakumar, R. Tamilarasan and M. Dharmendirakumar, J. Mater. Environ. Sci., 2012, 3, 157–170 CAS.
Footnote |
| † Electronic supplementary information (ESI) available. See DOI: https://doi.org/10.1039/d3ma00123g |
| This journal is © The Royal Society of Chemistry 2023 |

