Tracing the reactivity of single atom alloys for ethanol dehydrogenation using ab initio simulations†
Jayendran
Iyer
 a,
Fatima
Jalid
 b,
Tuhin S.
Khan
 *c and
M. Ali
Haider
 *a
*a
aRenewable Energy and Chemicals Laboratory, Department of Chemical Engineering, Indian Institute of Technology Delhi, Hauz Khas, Delhi, 110016, India. E-mail: haider@iitd.ac.in; Fax: +91 11 2658 2037; Tel: +91 11 26591016
bDepartment of Chemical Engineering, National Institute of Technology Srinagar, Srinagar, Jammu and Kashmir 190006, India
cLight Stock Processing Division, CSIR-Indian Institute of Petroleum, Dehradun, Uttarakhand 248005, India. E-mail: tuhins.khan@iip.res.in
First published on 23rd November 2021
Abstract
An ab initio micro-kinetic model (MKM) is constructed to understand the reactivity trend of the single atom alloys (SAAs) of Cu and Au for non-oxidative dehydrogenation (NODH) of ethanol to produce acetaldehyde. The model utilizes well-known scaling relations between the transition state (TS) and final state (FS) structures to calculate product formation rates. The turnover frequencies (TOFs) of the product are plotted with respect to the two descriptors: carbon and oxygen binding energies on the catalyst surface. The resulting MKM has predicted no significant change in the activity of NODH on the NiCu SAA (TOF ∼ 10−4 s−1) as compared to that on Cu (111) (TOF ∼ 10−4 s−1). This stands in contrast to the experimental reports. A similar erroneous trend is calculated for NiAu, PtCu and PdCu SAAs using the scaling MKM. In parallel, an attempt is made to utilize a machine learning (ML) approach to augment descriptor prediction for the Cu based SAAs in the scaling MKM; however, the resulting trend remained similar and contradictory to experiments. The underlying reason for this discrepancy is unraveled in density functional theory (DFT) calculations of the NODH reaction over SAA surfaces, wherein a clear departure from scaling relations is observed, resulting in significant reduction in the activation barriers of the initial O–H or α-C–H activation steps in ethanol. Following which, a full-DFT parameterized non-scaling MKM is considered essential to estimate the reactivity trend of SAAs. Consistent with the experimental reports, the non-scaling ab initio MKM predicted the trend of the Cu based alloys as NiCu > PtCu ∼ PdCu > Cu at 400 K and Au based alloy as NiAu > Au at 500 K. The non-scaling MKM has further revealed the dominant mechanistic route for the NODH reaction via the initial O–H or α-C–H activation in ethanol. Except for PtCu, all other prominent SAAs (NiCu, PdCu and NiAu) are expected to follow the initial O–H scission route to produce acetaldehyde, while in the case of PtCu, both the mechanistic routes are likely to compete.
Introduction
For decades, researchers in reaction engineering have been intrigued by the idea of rational catalyst design to achieve the desired catalytic activity.1–5 The century old Sabatier principle6 has guided this quest in heterogeneous catalysis, wherein the key reaction descriptors are sought after on the catalyst surface, so as to design the surface for optimum binding of the descriptor species, yielding maximum turnovers. Towards this, in silico catalyst design is propelled by ab initio quantum mechanical simulations, to map turnover frequencies (TOFs) with simplified descriptors, such as the binding energy of the carbon or oxygen atoms on the transition metal catalyst surface.7 The inherent approach is augmented by the applicability of linear scaling relations, which are generally derived from the Brønsted–Evans–Polanyi (BEP) relations, describing the energetics of the transition state with respect to the reactant or the product states of the elementary reaction steps.8,9 This in-turn has allowed the reduction of the descriptor-space, enabling simplified screening of transition metal catalysts with the help of an ab initio micro-kinetic model (MKM).9,10 Moreover, recent implementations of machine learning (ML) methods have promulgated efforts for accelerated catalyst screening by faster prediction of reaction descriptors with significantly reduced computational resources.11–13 However, in this entire process, aberrations are expected, primarily arising due to the departure from scaling relations as reported in the reactivity of single metal atoms (e.g. Pt, Pd, Ni, etc.), which are generally alloyed to an inactive metal (e.g. Cu, Ag, Au) host.14,15 This departure from scaling relations is attributed to the differences between the adsorption sites of reactant, product and transition state structures resulting in differential interactions with the surface.14 For example, in hydrogen dissociation on the NiCu SAA, it has been proposed that adsorbed H2 in atop mode on the Ni single atom is dissociated and spilled over as an H atom on the neighboring Cu atom resulting in significantly higher activity.15 Herein, as a case study, we analyze the reactivity of such single atom alloys (SAAs) for the non-oxidative dehydrogenation (NODH) reaction of ethanol for in silico catalyst screening. For this purpose, two different approaches are adapted. For one, SAAs are screened for the NODH reaction using a scaling MKM. For two, a full DFT-parameterized ab initio MKM is constructed.The NODH reaction of alcohols to produce aldehydes is studied with great interest to develop new catalytic materials.16–19 As compared to its oxidative counterpart, the NODH reaction is of paramount importance in the chemical industry, with improved process safety and product selectivity,18 offering higher yield and reduced catalyst deactivation.20 Our group has studied this reaction to develop novel bimetallic alloys of Cu, Pt and Ni, using an ab initio MKM, focusing on the reactivity of the step sites for the NODH of ethanol.16,17 Recent experiments by Flytzani-Stephanopoulos and co-workers have explored the reactivity of SAAs for the NODH reaction of ethanol.18,21,22 The authors have measured a significant decrease in the apparent activation energy (Eapp = 42 ± 2 kJ mol−1) of the reaction over the NiCu SAA as compared to pure Cu nanoparticles (Eapp = 70 ± 5 kJ mol−1).18,21 Similarly, using the model Cu (111) surface, Sykes and co-workers have measured six-fold enhancement in catalytic activity for ethanol dehydrogenation on the PtCu SAA surface as compared to the pure Cu (111) surface.23 In a parallel experiment to test the reactivity of SAAs based on Au, Flytzani-Stephanopoulos and co-workers reported a similar decrease in measured activation energies, with the addition of Ni single atoms (Eapp = 59 ± 5 kJ mol−1 on the NiAu SAA as compared to 96 ± 3 kJ mol−1 on Au).22 This consistent improvement in the reactivity offered by SAAs opens up potential avenues for rational design of novel SAA surfaces for the NODH reaction.
In order to model the reactivity of SAAs, Sykes and co-workers have proposed a mechanistic pathway in which the O–H bond of ethanol is activated first on the SAA surface followed by the α-C–H bond, resulting into the formation of acetaldehyde.23 The hypothesis is derived from the experiments on the model Cu (111) surface,24,25 where the O–H bond is observed to activate at a significantly low (160 K) temperature. Our group has developed a comprehensive ab initio MKM to understand ethanol decomposition and dehydrogenation reactions on transition metal surfaces, including all possible mechanistic routes such as O–H, α-C–H, C–C, and C–O activation in ethanol.9,16 From the analysis of the MKM, we have concluded the O–H activation in ethanol as the most feasible pathway for aldehyde formation on monometallic and bimetallic surfaces.9,16 Interestingly, recent theoretical studies by Henkelman and co-workers have asserted α-C–H activation in ethanol as the first step in ethanol activation on SAAs of Pt, Pd, Rh and Ir with coinage metals.26 The authors have considered the single metal atoms doped on the Cu surface to participate directly in O–H or α-C–H activation, while the reactant molecule is adsorbed on the doped single metal atom in Cu. In contrast, calculations by Sykes and co-workers for PtCu have highlighted the fact that the oxygen atom is generally more stable on Cu as compared to Pt, so ethoxy species formed upon O–H activation is likely to be adsorbed on Cu and may consequently activate its α-C–H bond on the neighboring Cu atoms to yield acetaldehyde.23 On Au, the mechanistic route on the SAA could be different since Au is known to be inactive for both O–H (ref. 27) and α-C–H activation19 in ethanol.
Without relying on a specific rate-determining step and solving the rate equations of all the elementary steps at the steady state, an ab initio MKM is expected to clearly discern the contributions of different mechanistic routes considered in the NODH reaction. Towards this, in our previous work, we have demonstrated the applicability of an ML approach based on the gradient boosting regressor (GBR) algorithm to screen Cu based bimetallic surfaces for the ethanol NODH reaction.11 The same GBR algorithm is also applied to predict the binding energies of the terrace sites of Cu based SAAs.11 With the help of scaling relations, we attempt to utilize the ML-derived descriptors in the ab initio MKM and thereby fast-track the screening of SAAs. This thought resonates well with several studies which have pursued ML approaches for catalytic trends.13,28,29 However, catalytic turnovers estimated from ML predicted descriptors and scaling relations may not provide an ideal platform, since departure from scaling relations is reported in the reactivity of SAAs.14,15 Therefore, an attempt is made here to estimate reactivity trends at the reaction temperature from a complete ab initio parameterized MKM with the adsorption and transition state energies derived from density functional theory (DFT) calculations. More specifically, the reactivity trends for NiCu, PtCu, PdCu and NiAu SAAs, obtained from the scaling MKM and non-scaling MKM, are compared with the experimentally reported trends of the SAAs. Overall, the results highlight the predominant mechanistic routes and importance of a comprehensive modeling approach in determining the reactivity trend of SAAs for the NODH reaction of ethanol.
Methodology
Periodic DFT calculations are performed on SAAs and monometallic catalyst surfaces using the plane-wave Vienna ab initio simulation package (VASP) version 6.2.0.30 Henkelman and co-workers26 have reported the dehydrogenation reaction of ethanol on SAAs using the Perdew–Burke–Ernzerhof (PBE) exchange-correlation functional.31 Following which, a similar potential and method is applied to benchmark some of the calculations in this study and to construct the MKM. Pseudopotential approximation fitting the wavefunction of the core electrons is applied in the realm of the projector augmented wave (PAW) method.32 In the reciprocal space, calculations are performed within the irreducible Brillouin zone using the 3 × 3 × 1 Monkhorst–Pack k-point grid. The basis set is expanded to an energy cutoff of 396 eV. Dispersive interactions of the molecules on the catalyst surface are included with DFT-D3 correction using Becke–Jonson damping.33 In order to draw the initial coordinates of the metal surface, available structures in the Materials Studio (version 2020 Dassault Systemes, USA) database are drawn by cleaving the bulk structure to expose the (111) terrace surface. SAA surfaces are formed by introducing a dopant atom (i.e., Ni, Pt, and Pd) in the host metal (i.e., Cu, Ag, and Au). A supercell of size 4 × 4 having 4 atomic layers of the metal catalyst is applied to model the catalyst surface with a vacuum size of at least 12 Å in the direction perpendicular to the surface. In the supercell, the bottom two layers are kept at fixed coordinates to represent the bulk region of the catalyst while the coordinates of the top two layers are allowed to relax to represent the restructuring of the surface and sub-surface layers in the catalytic reaction. The initial structure is subjected to geometry optimization using the DFT protocol to converge the force and energy of the structure to 0.05 eV Å−1 and 10−6 eV, respectively. For SAAs having Ni atoms (NiCu, NiAg and NiAu), spin-polarized calculations are applied. In addition, spin-polarized settings are introduced for geometry optimization of gas-phase species.The transition state (TS) structure on the reaction coordinate is located by constructing an initial guess of the minimum energy path (MEP) connecting the initial and final state structures on the potential energy surface. A total of 16 images along the reaction coordinate are optimized using the nudged elastic band (NEB) method.34 The TS structure with one imaginary frequency along the reaction coordinate is identified using the climbing image NEB method.35 The force and energy of each structure along the MEP are converged to 0.05 eV Å−1 and 10−4 eV, respectively.
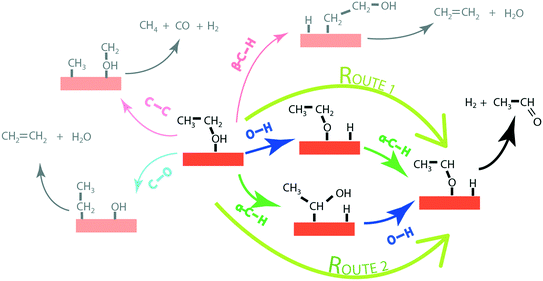
In order to construct an ab initio MKM over the terrace sites of the catalysts, the descriptor based analysis tool CatMAP36 is employed. The MKM is built for transition metals such as Pt, Ag, Au, Co, Ni, Cu, Ru, Rh, Pd, Re and SAAs like NiCu, PtCu, PdCu, NiAu, PtAu, PdAu, NiAg, PtAg and PdAg. It is evaluated for two possible decomposition routes of ethanol (as shown in Fig. 1) viz. the O–H bond scission (route 1) and the α-C–H abstraction (route 2) in the NODH reaction to yield acetaldehyde. The steady state solutions of the governing kinetic equations are calculated using the mean field microkinetic approach, whereby the TOFs of the reactant consumption and product formation are mapped with respect to the reaction descriptors. The TOFs are determined by the multi-dimensional Newton's root finding method from the python mpmath library,37 using the required inputs of reaction conditions, gas phase energetics, binding energies of the adsorbates and activation energy of the elementary reaction steps. In this regard, two separate approaches to construct MKMs are applied and both models are evaluated separately. In one of the ab initio MKMs, well-known scaling relations are applied as mentioned in the works of Nørskov and co-workers38 to determine the energies of the activated complex.39,40 These relations express the energy of transition state species linearly with respect to the final state of the elementary step. Universal relations for transition state scaling for dehydrogenation reactions established by Wang et al. have been used in this study.40 Since the DFT method applied in this study is similar to the one used by Henkelman and co-workers,41 some of the reaction energetics are directly applied in constructing the scaling MKM (Table SI.1†). Following are the scaling relations employed in the MKM for the cleavage of O–H and α-C–H bonds, respectively:
| ETS = (0.47 ± 0.01)ΔEdiss + (0.99 ± 0.07) eV |
| ETS = (0.92 ± 0.05)ΔEdiss + (0.8 ± 0.08) eV |
For both the scaling and non-scaling MKM, the energies of all the intermediate and TS structures are referenced with respect to the gas phase energies of hydrogen, water and methane. The binding energy (ECxHyOz) of the intermediate (CxHyOz) is calculated using the following formula:
The adsorbed entities involved are known to bind with the catalyst surface predominantly via the oxygen and the carbon atoms.42–44 Thus, the entire reaction kinetics is evaluated using the oxygen (EO) and carbon (EC) binding energies as descriptors. In order to solve the kinetic equations at the steady state, the equilibrium constant (Keqi) and forward (kfi) and backward (kbi) reaction rates of the elementary reaction step involved in the MKM are calculated using the following equations:
where kB is the Boltzmann constant, T is the temperature of the reaction, h is Planck's constant, ΔGai(T) is the Gibbs free energy barrier and ΔGi(T) is the reaction Gibbs free energy of the ith elementary reaction, respectively. The free energy barrier, ΔGai(T), and the reaction free energy, ΔGi(T), are obtained from the following equations:
| ΔGai(T) = GTSi(T) − GISi(T) |
| ΔGi(T) = GFSi(T) − GISi(T) |
For solving the MKM, fixed entropy assumption45 is used to define the gas phase thermochemistry. The Gibbs free energy of the same is determined using the equation:
| Gn(T) = En + ZPEn + ΔUn(T) − TSn(T) |
Frozen adsorbate approximation36 is employed to define the thermochemistry of surface species. The model considers a separate hydrogen reservoir site, with an equal number of hydrogen sites to the other sites, as it does not compete with other adsorbates owing to its small size. This is considered similarly in other studies involving an ab initio MKM.43,46–49 The MKM is solved for steady state solutions under the reaction conditions of 1 bar total pressure, reaction temperature in the range 350–500 K and an initial conversion of 0.1% of ethanol towards the NODH route. The obtained steady state rates are plotted as 2-dimensional volcano plots, correlating TOFs to the descriptors—EC and EO.
In a separate study, EC and EO on Cu based SAAs are estimated using an ML approach, developed in our earlier work.11 The ML-based approach employed a gradient boosting regression (GBR) algorithm, wherein the descriptors are represented with 12 chemical properties of the single atoms as features (density, atomic number, atomic mass, group, period, atomic radius, heat of fusion, melting point, boiling point, surface energy, electronegativity, and ionization enthalpy). The GBR algorithm from the open-source Scikit Learn library50 utilizes a set of hyperparameters11 to predict the descriptors on the catalyst surface.
Results
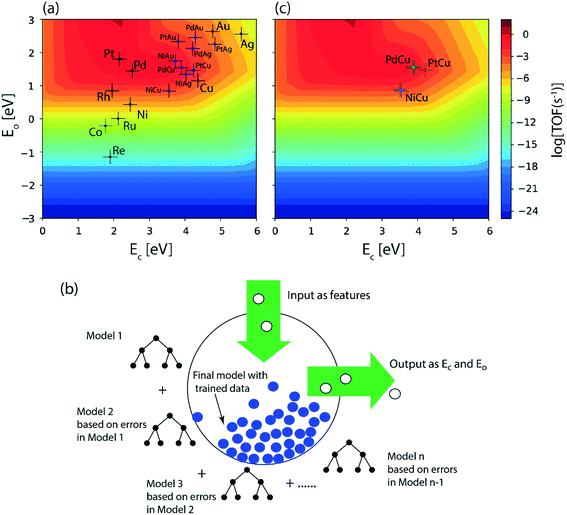
In order to produce acetaldehyde, ethanol may undergo dehydrogenation via O–H or α-C–H scission, Fig. 1. In addition, β-C–H, C–C and C–O bond activations in ethanol may lead to the formation of other products (C2H4, CO2, CH4, CO). Elementary reaction pathways for all such possible mechanistic routes are analyzed in our previous work,17 wherein we calculated the negligible reaction rate via β-C–H, C–O and C–C activation steps. This was likely due to the relatively low temperature (423 K) applied for the NODH reaction. Therefore, here we have focused only on the mechanistic routes originating from O–H or α-C–H activation to produce acetaldehyde, represented as route 1 and route 2, respectively, in Fig. 1.From the analysis of the scaling MKM, the TOFs of ethanol conversion is plotted in the form of a volcano plot (Fig. 2) with respect to the descriptors—EO and EC—on the metal surface. As shown in Fig. 2, Pt and Pd have exhibited the highest rate of ethanol conversion of the order of 10−1 s−1. Compared to Pt and Pd, Rh shows a two order of magnitude lower conversion of ethanol (10−3 s−1). The TOF over Cu, Ag and Ni is calculated to be 10−4 s−1, 10−5 s−1 and 10−6 s−1, respectively. The rest of the screened metal catalysts are calculated to show negligible (<10−7 s−1) ethanol turnovers. The reactivity order towards ethanol conversion is noted as: Pt ∼ Pd > Rh > Cu > Ag > Ni > Au > Ru > Co > Re. Based on this MKM, the reactivity of the SAAs of Cu, Ag and Au are evaluated. As observed in Fig. 2, upon introducing a single atom of Ni, Pd, and Pt into Cu, the turnover of ethanol increases as compared to the pure Cu catalyst, with the reactivity trend being – PdCu (10−2 s−1) > PtCu (10−3 s−1) > NiCu (10−4 s−1). The increase in the TOFs of Au based SAAs is manifold as compared to pure Au with NiAu (10−2 s−1) and PtAu (10−3 s−1) showing a four order of magnitude enhancement and PdAu (10−4 s−1) by three orders. Lastly, Ag upon being alloyed with Ni and Pd has a calculated TOF of 10−2 s−1 and 10−3 s−1, respectively, whereas the addition of Pt to Ag (PtAg ∼ 10−5 s−1) does not seem to alter the NODH activity.
In order to fast-track the screening of SAAs, an ML model based on the GBR algorithm is applied.51Fig. 2(b) shows the schematic representation of the GBR model which helps in predicting descriptors from a relatively small dataset.11,52,53 The model predicted EO and EC with a test error of 0.36 eV and 0.37 eV, respectively.11 The trend in the ML predicted EO and EC for the SAAs of Cu (PdCu, PtCu and NiCu) is shown in Table SI.2.† These values are utilised along with the scaling MKM to calculate the TOFs for the NODH reaction, Fig. 2(c). Interestingly, ethanol consumption turnovers estimated by ML as well as DFT are the same (PdCu > PtCu > NiCu), since the binding energies of the SAAs of Cu as predicted by ML are close to those calculated by DFT calculations.
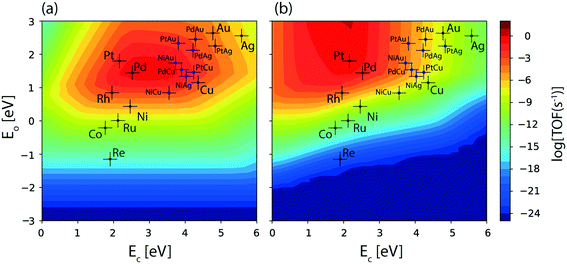
In order to gain mechanistic insights into the preferred route (1 or 2, Fig. 1) for acetaldehyde formation, the turnover rates of initial O–H scission and α-C–H scission are analysed in the form of a volcano plot shown in Fig. 3(a) and (b), respectively. Pd has a higher calculated rate (10−1 s−1, Fig. 3(a)) for initial O–H bond scission of ethanol forming ethoxy species as compared to α-C–H scission (10−2 s−1, Fig. 3(b)). Similarly, Cu, Au, Ag and Ni have significantly higher O–H calculated activation rates as compared to α-C–H. In contrast to all other metals, Pt has higher estimated activity for α-C–H (TOF ∼ 10−1 s−1, Fig. 3(b)) as compared to O–H scission (TOF ∼ 10−2 s−1, Fig. 3(a)). The mechanistic interpretations for ethanol NODH on the SAAs of Cu, Ag and Au are noteworthy as shown in Fig. 3. On comparing Fig. 3(a) and (b), it can be deduced that all of the SAAs show higher O–H activation rates as compared to α-C–H activation. This indicates that route 1 is the prevailing mechanism for NODH on all SAAs studied. Therefore, the trends shown for the overall ethanol consumption rate represented in Fig. 2(a) are similar to those for the ethanol O–H activation rates (Fig. 3(a)).
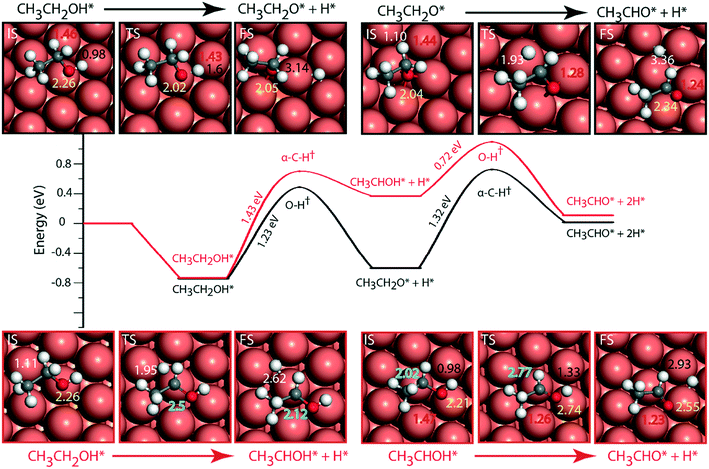
The reaction diagram for ethanol conversion to acetaldehyde via routes 1 and 2 on the Cu (111) surface is drawn from the DFT calculated energetics, Fig. 4. Ethanol binds to the Cu atom through the oxygen at the atop site with a binding energy of −0.74 eV (Table SI.5†). Neurock and co-workers have shown a similar binding site for propanol adsorption on the Cu surface via the oxygen atom.54 A similar geometry (binding energy = −0.66 eV) via the binding of the oxygen atom of ethanol on the Cu surface is reported by Sykes and co-workers, using the PBE functional, ZPE and dispersive corrections.23,25 Using the same method, Henkelman and co-workers have reported an energy value of −0.82 eV for ethanol binding on the Cu surface.41
The activation barrier for O–H scission of ethanol on Cu is calculated to be 1.23 eV, Fig. 4. This is similar to the activation energy (Ea = 1.1 eV) of ethoxy formation on Cu (111), as reported by Henkelman and co-workers.41 On the reaction coordinate, the O–H bond is significantly elongated from 0.98 Å in the initial state (CH3CH2OH*) to 3.14 Å in the final state (CH3CH2O* + H*). The resultant structure of the ethoxy species shows binding via the oxygen atom at the 3-fold sites of the Cu (111) surface at a distance of 2.05 Å from the nearest Cu atom and this structure is consistent with the reports of Hoyt et al. (O–Cu distance = 2.02 Å).25 A similar 3-fold structure is reported, using the PW91 functional, for the propoxide species (CH3CH2CH2O*) on Cu (111), which is formed via O–H activation of propanol with an intrinsic barrier of 0.88 eV.54 Our group has studied propanol dehydrogenation via O–H activation on the Cu (111) surface and calculated a barrier of 1 eV using the RPBE functional.55 In subsequent dehydrogenation reactions, the α-C–H bond of the ethoxy intermediate is activated with an intrinsic barrier of 1.32 eV. The binding mode of ethoxy changes from a 3-fold Cu site to a bridge site in the TS structure. The distance between the oxygen and the nearest Cu atom increases from 2.04 Å in ethoxy to 2.34 Å in acetaldehyde (Fig. 4). A similar increase in the Cu–O bond distance from 2.02 Å to 3.08 Å is also noticed for ethoxy conversion to acetaldehyde on the Cu surface.25
Alternatively, via route 2, α-C–H activation in ethanol is calculated on the Cu (111) surface and the results are shown in Fig. 4. The activation barrier is estimated at around 1.43 eV which is 0.2 eV higher than O–H scission. The structure (CH3CHOH*) of the intermediate obtained from α-C–H scission is adsorbed via the carbon atom at a distance of 2.12 Å from the surface, Fig. 4. Interestingly, during α-C–H activation, the binding of the adsorbed structure via the oxygen atom is shifted to carbon, as evident in the TS and FS structures of the reaction step (Fig. 4). A similar structure for CH3CHOH* species on the Cu surface is reported before,41 which is formed from ethanol via α-C–H activation, with an intrinsic activation energy of 1.63 eV. On comparing O–H scission versus α-C–H activation barriers in ethanol, the authors concluded O–H activation to be the prevailing route for ethanol dehydrogenation on the Cu (111) surface.41 This is consistent with our assessment. As compared to the ethoxy species, CH3CHOH* is calculated to show a weaker binding (Fig. 4), leading to a differential stabilization of the TS and consequent reduction in the following O–H activation barrier (0.72 eV, Fig. 4).
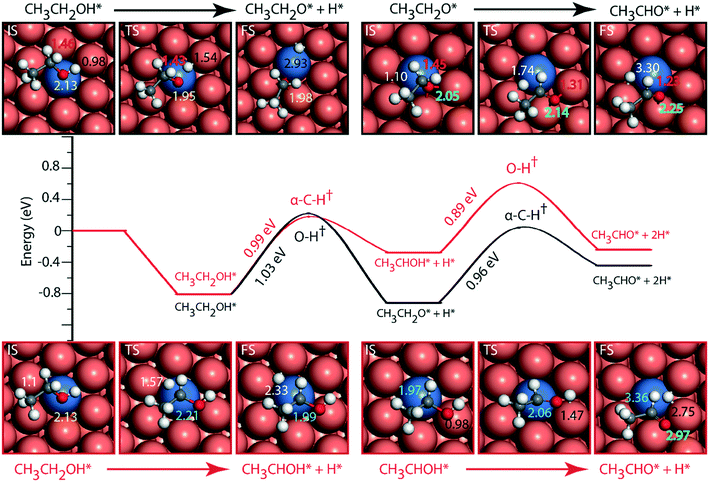
Doping the Cu surface with an active dehydrogenating metal (e.g. Ni) is expected to improve the activity of the surface for dehydrogenation reactions. Following which, the NiCu SAA surface is analyzed for ethanol dehydrogenation via routes 1 and 2, and the results are presented in Fig. 5. Ethanol binding on NiCu is strongest on the Ni atom via the oxygen atom at a distance of 2.13 Å, with a binding energy of −0.81 eV, Fig. 5. Interestingly, using the optB86b-vdW functional, Papanikolaou and Stamatakis56 have calculated a similar energy (−0.74 eV) for the surface adsorbed oxygen atom binding atop the Ni single atom on the NiCu SAA catalyst. Due to the presence of Ni single atoms on the Cu surface, the O–H activation energy (route 1) is significantly reduced from 1.27 eV on Cu to 1.03 eV on the NiCu SAA surface. The TS structure of the O–H activation step indicates the active participation of the Ni single atom, wherein the O–H bond is elongated to 1.54 Å. The resultant ethoxy species is adsorbed at the 3-fold site interacting with the Ni atom and two Cu atoms. The ethoxy species is further dehydrogenated via α-C–H scission with an intrinsic activation energy of 0.96 eV, which is significantly reduced as compared to the Cu surface, likely due to the participation of Ni in C–H bond activation. Our work on ethanol decomposition on NiCu bimetallic alloys has alluded towards the higher dehydrogenation activity of the surface as compared to Cu.16 In α-C–H activation, the ethoxy intermediate which was adsorbed at the 3-fold site of the Cu and Ni atoms is transformed into acetaldehyde species which are bound atop the Cu atom via the oxygen functionality. The O–Cu distance is increased from 2.05 Å (at the three-fold site of Cu and Ni atoms) in ethoxy to 2.25 Å (at the atop Cu site) in adsorbed acetaldehyde. This distinct difference in the participation of Ni atoms with the initial, final and TS structures of the C–H activation step is likely to introduce departure from scaling relations as pointed out in other studies.14,15
Following route 2 on the NiCu SAA, α-C–H cleavage of ethanol takes place with an activation energy of 0.99 eV (Fig. 5, Table SI.6†) which is close to the O–H scission barrier in route 1. The resulting product (CH3CHOH) structure is bound to the Ni atom on the surface at a distance of 1.99 Å. Further dehydrogenation of the CH3CHOH intermediate via O–H activation takes place with an activation barrier of 0.89 eV. The product aldehyde shifted more towards Cu atoms on the surface as compared to the reactant. Overall, it is difficult to ascertain from the reaction diagram (Fig. 5) the prevailing mechanistic route (1 or 2) in ethanol NODH on the NiCu SAA. However, a clue is provided in the experiments by Flytzani-Stephanopoulos and co-workers, wherein ethoxy species are observed in the diffuse reflectance Fourier transform spectroscopy (DRIFTS) analysis of the catalyst surface,18 suggesting route 1 to be dominant on NiCu surface. A similar reaction diagram for PtCu and PdCu SAAs is presented in the ESI† (Fig. SI.7 and SI.8). Since PtCu and PdCu are observed to be not as active as the NiCu SAA,18 the reaction diagram is not discussed in detail.
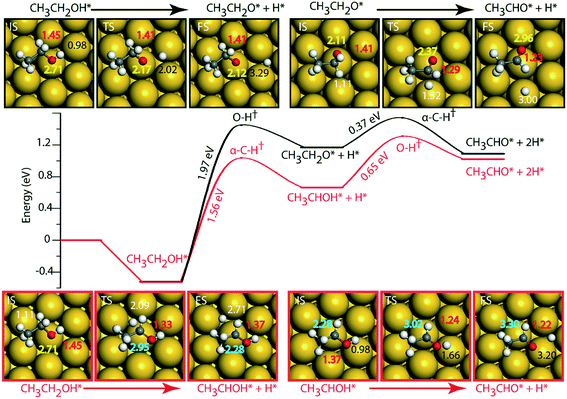
On the Au (111) surface (Fig. 6), ethanol is adsorbed via the oxygen atom (O–Au distance = 2.71 Å) with a binding energy of −0.52 eV. In a similar fashion, Li and Henkelman reported an ethanol binding energy on the Au atom of −0.59 eV.41 Since Au is known to be non-reactive,57 the activation energy for dehydration of ethanol via O–H activation (route 1) is calculated to be significantly high, i.e., 1.97 eV. A similar activation barrier (2.11 eV) for direct metal catalyzed O–H activation in ethanol is reported by Neurock, Davis and co-workers27 using the PW91 functional. However, once ethanol is activated to form ethoxy, the subsequent α-C–H activation of the intermediate (CH3CH2O) to produce acetaldehyde is relatively low (Ea = 0.37 eV), Fig. 6 and Table SI.5.† Neurock and co-workers have reported a similar low activation energy (0.47 eV) for Au catalyzed ethoxy dehydrogenation via α-C–H bond cleavage.27 Following route 2, α-C–H activation in adsorbed ethanol on the Au (111) surface appears to be equally difficult (Ea = 1.56 eV). Here also, the dehydrogenation of the intermediate (CH3CHOH) is facilitated with a significantly lower barrier (Ea = 0.65 eV). Surprisingly, we see an opposite trend in the stability of CH3CH2O and CH3CHOH intermediates when compared on Cu and Au surfaces. The CH3CHOH intermediate binds strongly on Au compared to CH3CH2O, whereas on Cu, CH3CH2O (ethoxy) is more stable.
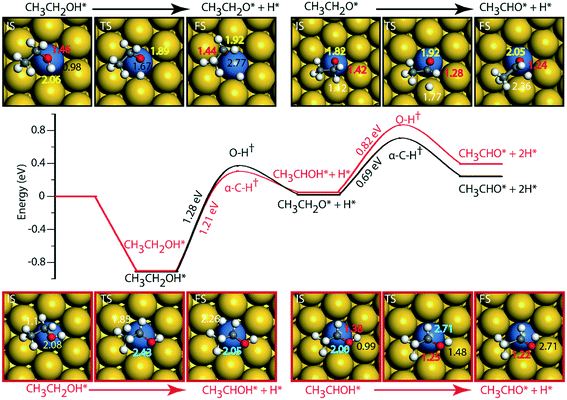
Since Au (111) appears to be inactive for the NODH reaction, the addition of Ni single atoms is expected to facilitate O–H or C–H activation.22Fig. 7 shows the reaction diagrams for both routes 1 and 2 on the NiAu SAA. With the introduction of Ni single atoms on Au (111), the activation barrier for O–H activation in ethanol reduces from 1.97 eV on Au to 1.28 eV on the NiAu SAA (Fig. 7). The resultant ethoxy species binds atop the Ni center (O–Ni distance = 2.06 Å). Hydrogen, on the other hand, is stable at the bridge site shared between Ni and Au atoms at a distance 2.77 Å away from ethoxy. In the second dehydrogenation step, C–H scission is facilitated with a lower activation energy (0.69 eV, Fig. 7 and Table SI.5†) and the product acetaldehyde binds atop the Ni atom (O–Ni = 2.05 Å). The α-C of ethoxy loses its H on Au in the TS (α-C–H distance 1.77 Å). The product acetaldehyde is bound on the Ni atom while H moves towards the bridge site of Au and Ni, Fig. 7. Following route 2, α-C–H cleavage requires an activation energy of 1.21 eV, Fig. 7. Like the trends on NiCu, a narrow gap between the O–H cleavage (route 1) and α-C–H cleavage (route 2) are observed on the NiAu SAA, i.e., around 0.07 eV. Route 2 shows a slightly higher barrier (0.82 eV) for the second dehydrogenation step than α-C–H activation in route 1 (0.69 eV). The CH3CHOH intermediate loses its H to the bridge site between Ni and Au atoms (O–H distance of 2.71 Å) with the acetaldehyde adsorbed through the O atom on Ni.
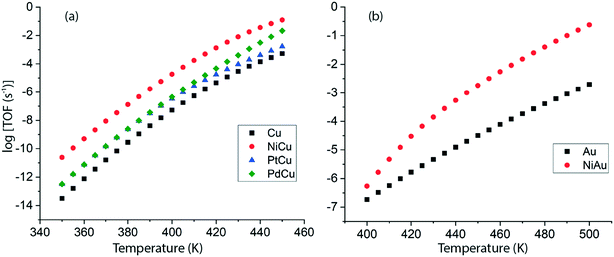
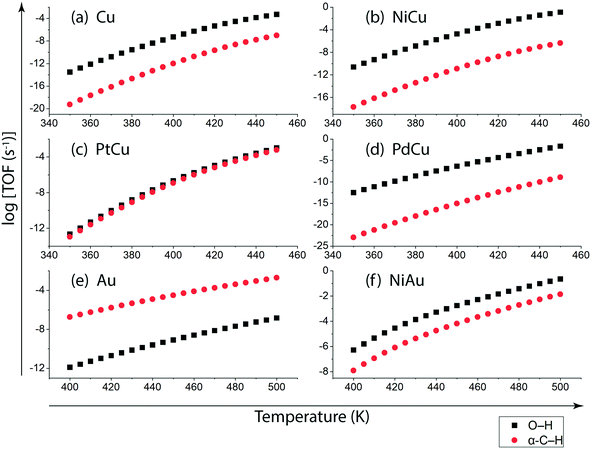
Following DFT calculations for the NODH reaction of ethanol on Cu (Fig. 4), NiCu (Fig. 5), PtCu (Fig. SI.7†), PdCu (Fig. SI.8†), Au (Fig. 6) and NiAu (Fig. 7), a separate MKM is constructed without using any scaling relations to calculate ethanol turnovers for acetaldehyde production via reaction routes 1 and 2. For Cu and Cu based SAAs, the MKM is analysed to estimate the turnover rates in the temperature range: 350–450 K, Fig. 8(a). On Cu (111), the TOFs of ethanol conversion is calculated to be ∼10−4 s−1 at 450 K. On introducing Ni single atoms on the Cu surface, an increase of three orders of magnitude in the turnover rate is observed i.e., ∼10−1 s−1 at 450 K. Also, the activity of ethanol NODH on the PtCu SAA is calculated to be slightly improved compared to Cu. In contrast to NiCu, PdCu has a similar calculated TOF to PtCu at 350 to 400 K. In this temperature range, the NODH rates trend with the highest activity on the NiCu SAA followed by nearly equal rates on PtCu and PdCu and low activity on Cu as NiCu > PtCu ∼ PdCu > Cu. Further, the TOFs of NODH on Au and NiAu SAAs using the same non-scaling MKM approach are estimated, Fig. 8(b). Since Au catalyzes the ethanol dehydrogenation reaction at a higher temperature (around 500 K),22 the reaction rates on Au and NiAu are calculated at 400 K to 500 K. On Au, ethanol dehydrogenation TOFs are calculated up to 10−3 s−1 at 500 K. The addition of the Ni single atom increases the turnovers to about two orders of magnitude (∼10−1 s−1) at 500 K.
On understanding the reactivity trends among Cu, Au and their SAAs, the TOFs of the initial O–H and α-C–H activation step in ethanol are compared. Fig. 9 presents the calculated TOFs of ethanol consumption via the initial O–H or α-C–H activation on Cu, NiCu, PtCu and PdCu at 350–450 K and of Au and NiAu in the temperature range 400–500 K. On Cu, the ethanol consumption through initial O–H activation is calculated up to 10−4 s−1 at 450 K, Fig. 9(a). In comparison, the ethanol consumption via α-C–H cleavage is estimated to be negligible (∼10−8 s−1) suggesting O–H activation to dominate on Cu. This is also implied in the work of Henkelman and co-workers, where the authors have reported from ab initio calculations that the O–H activation of ethanol is favored on the Cu surface.41 As expected, with the addition of reactive Ni single atom dopant on the Cu host, the consumption rate of ethanol is increased. The TOF of ethanol consumption via O–H cleavage is estimated to be 10−1 s−1 at 450 K, which is around four orders of magnitude higher than that observed on Cu, as shown in Fig. 9(a) and (b), while the ethanol consumption via α-C–H activation is calculated to be negligible (10−7 s−1 at 450 K). Overall, on NiCu, the rate of ethanol consumption via O–H activation dominates with at least seven orders of magnitude higher rates than α-C–H. Instead, when Pt singe atoms are added to Cu (111), the rates of O–H activation of ethanol are not affected in the temperature range from 350 K to 450 K, Fig. 9(c). In contrast, the α-C–H bond activation rates in ethanol are increased to ∼10−3 s−1 at 450 K, which is significantly higher than the α-C–H activation rates on the Cu catalyst. This indicates that the Pt atoms significantly increase the rates of ethanol consumption via α-C–H scission, while keeping the rates via O–H activation unaffected and both routes are suggested to be competitive. On PdCu, O–H activation rates in ethanol are increased by two orders of magnitude while α-C–H activation rates are decreased by four orders of magnitude as compared to Cu, Fig. 9(a) and (d). Therefore, the addition of Pd single atoms has reduced ethanol conversion rates via α-C–H cleavage, while increasing the ethanol turnover rates via O–H activation, hence O–H scission dominates in the NODH reaction conducted on the PdCu SAA. A similar analysis for ethanol NODH calculated through initial O–H and α-C–H activation on Au (111) and NiAu SAAs is shown in Fig. 9(e) and (f). The Ni single atom on the Au host shows accelerated rates of ethanol to acetaldehyde conversion through initial O–H activation with TOFs calculated up to 10−1 s−1 at 500 K. Here also the O–H scission rates in ethanol are significantly higher than α-C–H activation over the entire range of temperature, 400–500 K, Fig. 9(f).
In order to understand the discrepancies in the scaling MKM vis-à-vis to the non-scaling MKM, linear scaling relations correlating the energies of the TS versus the FS of the initial O–H and α-C–H activation in ethanol via the NODH reaction are plotted in Fig. 10. Since these two distinct dehydrogenation steps lead to two different mechanistic pathways in the NODH reaction, it is essential to analyze the reactivity of the SAA surface as compared to the host metal (Cu, Ag and Au) surface. A linear relationship is constructed from the calculated energetics of the host metal, Fig. 10. The scaling analysis for ethanol O–H activation over Cu, Ag, Au, and their SAAs is presented in Fig. 10(a). Here a clear departure from the linear scaling is observed for all of the SAAs, and all of them lie below the linear scaling line. A similar departure from linear scaling to lower Ea is also observed for the α-C–H scission step on most of the SAAs, Fig. 10(b), except for that of PtCu, PdCu and PtAg which lie slightly above the scaling relation line. Overall, this departure from linear scaling is more pronounced for O–H scission as compared to α-C–H activation.
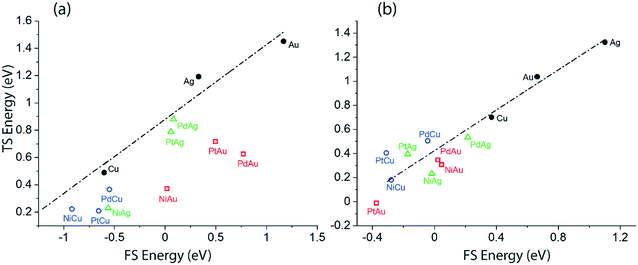 | ||
| Fig. 10 Transition state (TS) energy scaling with respect to the final state (FS) energy of the product for (a) O–H activation via route 1 (b) α-C–H activation via route 2. | ||
Discussion
An MKM using linear scaling relations has been applied to study the trends in catalytic reactivity and to come up with in silico design of SAAs for the NODH reaction. The MKM developed in this manner for the NODH reaction conducted at 450 K is unable to predict the reactivity trend of SAAs (Fig. 2(a)), since the NiCu SAA shows similar reactivity to Cu for ethanol conversion, while PtCu and PdCu SAAs show 2–3-fold higher activity as compared to Cu, Fig. 2. This is strikingly different from the experimental results of Flytzani-Stephanopoulos and co-workers,18 where the authors have reported a significantly higher ethanol conversion rate (0.2 μmol H2 m−2 s−1) at 450 K for the NiCu SAA as compared to PtCu (0.05 μmol H2 m−2 s−1) or PdCu (0.045 μmol H2 m−2 s−1). The higher conversion on NiCu for the NODH reaction is estimated to have a significantly reduced apparent activation energy (Eapp = 47 ± 2 kJ mol−1) as compared to PtCu (Eapp = 63 ± 6 kJ mol−1) or PdCu (Eapp = 69 ± 4 kJ mol−1) in the temperature range, 425 K to 475 K. Calculations for the Au based SAA indicate several orders of magnitude higher TOF of ethanol conversion on the NiAu SAA as compared to pure Au, which resonates well with the experimental trend that NiAu is better in reactivity than Au for ethanol NODH. However, calculations at the same temperature (450 K) for NiAu and NiCu indicate a higher reactivity of NiAu as compared to NiCu, and this is opposite to the experimental trend (Eapp = 59 ± 5 kJ mol−1 on NiAu as compared to 47 ± 2 kJ mol−1 on NiCu).18,22Another approach for accelerated prediction of the reactivity trend of SAAs is attempted by employing ML tools. Recently, much emphasis has been placed on building a large dataset of descriptors (e.g., binding energies of key elements) for SAAs,13 which in-turn provides a comprehensive evaluation of turnover rates using linear scaling.28,29 Our group has demonstrated the application of an ML method in predicting turnover rates for the NODH reaction of ethanol over the bimetallic alloys of Cu.11 On applying the same ML method, the binding energies of carbon and oxygen atoms for NiCu, PtCu and PdCu SAAs are estimated.11 On mapping the ML predicted binding energies with the MKM estimated TOFs, (Fig. 2(b)), it can be discerned that the reactivity trend of Cu based SAAs remains the same as predicted in Fig. 2(a) since the ML augmented screening method essentially relies on the same linear scaling relations. In this regard, we raise a caution on ML methods that predicting descriptors alone for SAAs may not be sufficient for accurate estimation of reactivity and these methods should be explored for building larger datasets of reaction energetics, including the binding energy of adsorbates and activation energies of the elementary steps.
Interestingly, from the analysis of the scaling MKM (Fig. 3), it appears that the rates for initial O–H scission in ethanol on the terrace sites of the catalyst are dominant in all SAAs, as compared to the α-C–H scission. This is similar to our previous observation for the reactivity of the step sites of the monometallic and bimetallic catalysts for the NODH reaction of ethanol.16 Here also, we expect that the mechanistic interpretations could be erroneous in the case of SAAs, as also observed in the reactivity trend and this requires further deliberation using DFT calculations on the energetics of the two mechanistic routes (1 and 2). For this purpose, reaction diagrams (Fig. 4 to Fig. 7 and SI.7 and SI.8†) are drawn to represent the energetics of elementary steps in the NODH reaction of ethanol to produce acetaldehyde. In addition, DFT calculations for the NODH reaction on several other combinations (NiAg, PtAg, PdAg, PtAu and PdAu) of SAAs are presented in Table SI.5 and SI.6 and Fig. SI.1–SI.6.† Here, we observe that the analysis of the reaction diagrams (e.g., Fig. 5 and 7) alone for the NODH reaction on SAAs (e.g., NiCu and NiAu) is unable to discern a clear mechanistic route (O–H scission versus α-C–H scission) since the initial ethanol dehydrogenation route is highly competitive with negligible difference in activation energies on SAAs. This might be the reason that the authors have previously suggested different mechanistic routes for ethanol dehydrogenation on the SAA surface.23,26 For example, Sykes and co-workers23 have asserted O–H activation (route 1) as the predominant route for the NODH reaction, on observing the ethoxy intermediate at temperatures as low as 160 K. The ethoxy route is also suggested in the experiments on the NiCu SAA,18 while Henkelman and co-workers26 have argued from theoretical calculations about facile α-C–H activation on the SAA surface due to the presence of highly active single atoms of Pt, Pd, Rh, etc. which are well-known for C–H activation.
More clarity on the mechanistic routes is discerned from rate calculations. It has to be noted that the reaction energetics alone for the NODH reaction on SAAs is unable to elucidate the differences in the reactivity trend, since the reaction diagrams for PtCu (Fig. SI.7†), PdCu (Fig. SI.8†) and NiCu (Fig. 5) appear to be similar with comparable activation energies of the corresponding reaction steps. Since the higher ethanol dehydrogenation activity of NiCu compared to PtCu and PdCu could be ascribed to the higher adsorption energies of CH3CH2OH and higher exothermicity of the O–H bond scission (Table SI.3 and SI.5†), the need for a full DFT-parameterized MKM is emphasized here. Fig. 8 shows the TOFs for the NODH reaction of ethanol calculated on SAAs using DFT simulations of the reaction energetics. Indeed, the non-scaling and full DFT parameterized MKM picks up the right trend in catalyst reactivity as reported in experiments.18,22 Following which, Fig. 9 shows the dominant mechanistic routes on the SAAs. While NiAu, PtCu and PdCu produce acetaldehyde at much higher turnovers via the O–H scission, PtCu is likely to utilize both O–H and α-C–H dehydrogenation routes. This mechanistic understanding on SAAs obtained from the non-scaling MKM stands in contrast to the analysis from the scaling MKM (Fig. 3), which is expected since the scaling MKM does not incorporate the unique reactivity features of SAAs.
The underlying reason for the differences in the reactivity trend and mechanistic routes analysed from the scaling and non-scaling MKMs is further elucidated as shown in Fig. 10, which shows the scaling relations for the initial O–H scission and α-C–H scission in ethanol. Since most of the SAA surfaces calculated in this work lie below the linear correlation of the host metal (Cu, Ag, Au), it is likely that they show significantly high activity for the NODH reaction with reduced activation barriers for ethanol dehydrogenation steps. From Fig. 10, while it appears that activation energies for O–H scission are significantly reduced as compared to α-C–H bond activation on corresponding SAA surfaces, the α-C–H activation route may still stand competitive for ethanol NODH on the PtCu SAA, as observed from the kinetic analysis in Fig. SI.7.† Interestingly, Henkelman and co-workers have observed consistency in linear scaling relations for α-C–H activation in ethanol on SAAs and have considered these scaling relations to be largely applicable in the case of SAAs.26 In contrast, Stamatakis and co-workers have probed the nature of the transition state structures interacting with the doped single metal atom in hydrogen dissociation on the PtCu SAA surface, and observed it to be significantly different than the product state of dissociated hydrogen atoms interacting with the host Cu atoms.14 This has resulted in broken scaling relations on SAAs, something which is seen consistently in the works of Sykes and co-workers.14,15 In our previous studies, we have also relied on scaling relations to construct MKMs, so as to explain the reactivity trends of bimetallic alloys.16,17 However, in this work on SAAs, it can be asserted that the broken scaling relations will have certain consequences on mechanistic and reactivity interpretations, which cannot be ignored.
Conclusion
Reactions occurring on SAAs offer a unique mechanistic insight into the reactivity of the SAA surface which is different from previously studied bimetallic alloys. The heterogeneity of the surface structure combined with highly reactive single metal atoms has allowed the differential interaction with the TS structures as compared to the initial or final states on the reaction coordinate. This has led to the departure from scaling relations with significantly high reduction in activation energies of the dehydrogenation steps in the NODH reaction of ethanol. The ab initio MKM, which has relied on scaling relations, is unable to pick up such reactivity shift in SAAs and thus provides an erroneous reactivity trend. ML approaches, which have shown potential for fast-track prediction of descriptors, may require further improvisation to estimate the entire reaction energetics. This paradigm shift therefore calls for a comprehensive modeling approach in accessing the reactivity of SAAs without relying on scaling relations. This is specifically demonstrated in modeling the NODH reaction of ethanol on the SAA surface, wherein a full-DFT parameterized MKM is observed to accurately predict the reactivity trend of SAAs, elucidating the dominant mechanistic route for ethanol dehydrogenation.Conflicts of interest
There are no conflicts of interest to declare.Acknowledgements
The authors thank the high performance computing facility at IIT Delhi for computational resources. T. S. K. would like to acknowledge the Director, CSIR-IIP, for his continuous help and encouragement. The authors also greatly appreciate the financial support from the Department of Science and Technology (CRG/2019/006176), Government of India. The authors would like to acknowledge the help of Mr. Asjad Maswood in designing the cover art.References
- R. M. Watwe, R. D. Cortright, J. K. Nørskov and J. A. Dumesic, Theoretical Studies of Stability and Reactivity of C2 Hydrocarbon Species on Pt Clusters, Pt(111), and Pt(211), J. Phys. Chem. B, 2000, 104(10), 2299–2310 CrossRef CAS.
- J. K. Nørskov, T. Bligaard, A. Logadottir, S. Bahn, L. B. Hansen and M. Bollinger, et al., Universality in Heterogeneous Catalysis, J. Catal., 2002, 209(2), 275–278 CrossRef.
- M. A. Haider, M. R. Gogate and R. J. Davis, Fe-promotion of supported Rh catalysts for direct conversion of syngas to ethanol, J. Catal., 2009, 261(1), 9–16 CrossRef CAS.
- S. Gupta, T. S. Khan, B. Saha and M. A. Haider, Synergistic Effect of Zn in a Bimetallic PdZn Catalyst: Elucidating the Role of Undercoordinated Sites in the Hydrodeoxygenation Reactions of Biorenewable Platforms, Ind. Eng. Chem. Res., 2019, 58(35), 16153–16163 CrossRef CAS.
- S. Gupta, M. I. Alam, T. S. Khan and M. A. Haider, Mechanistic Approaches toward Rational Design of a Heterogeneous Catalyst for Ring-Opening and Deoxygenation of Biomass-Derived Cyclic Compounds, ACS Sustainable Chem. Eng., 2019, 7(12), 10165–10181 CrossRef CAS.
- M. Che, Nobel Prize in chemistry 1912 to Sabatier: Organic chemistry or catalysis?, Catal. Today, 2013, 218–219, 162–171 CrossRef CAS.
- P. Ferrin, D. Simonetti, S. Kandoi, E. Kunkes, J. A. Dumesic and J. K. Nørskov, et al., Modeling ethanol decomposition on transition metals: A combined application of scaling and brønsted-evans-polanyi relations, J. Am. Chem. Soc., 2009, 131(16), 5809–5815 CrossRef CAS PubMed.
- J. K. Nørskov, T. Bligaard, B. Hvolbæk, F. Abild-Pedersen, I. Chorkendorff and C. H. Christensen, The nature of the active site in heterogeneous metal catalysis, Chem. Soc. Rev., 2008, 37(10), 2163–2171 RSC.
- F. Jalid, T. S. Khan, F. Q. Mir and M. A. Haider, Understanding trends in hydrodeoxygenation reactivity of metal and bimetallic alloy catalysts from ethanol reaction on stepped surface, J. Catal., 2017, 353, 265–273 CrossRef CAS.
- A. J. Medford, A. Vojvodic, J. S. Hummelshøj, J. Voss, F. Abild-Pedersen and F. Studt, et al., From the Sabatier principle to a predictive theory of transition-metal heterogeneous catalysis, J. Catal., 2015, 328, 36–42 CrossRef CAS.
- S. Saxena, T. S. Khan, F. Jalid, M. Ramteke and M. A. Haider, In silico high throughput screening of bimetallic and single atom alloys using machine learning and ab initio microkinetic modelling, J. Mater. Chem. A, 2020, 8(1), 107–123 RSC.
- S. Ma and Z. P. Liu, Machine Learning for Atomic Simulation and Activity Prediction in Heterogeneous Catalysis: Current Status and Future, ACS Catal., 2020, 10(22), 13213–13226 CrossRef CAS.
- Z. K. Han, D. Sarker, R. Ouyang, A. Mazheika, Y. Gao and S. V. Levchenko, Single-atom alloy catalysts designed by first-principles calculations and artificial intelligence, Nat. Commun., 2021, 12(1), 1–9 CrossRef PubMed.
- M. T. Darby, M. Stamatakis, A. Michaelides and E. C. H. Sykes, Lonely Atoms with Special Gifts: Breaking Linear Scaling Relationships in Heterogeneous Catalysis with Single-Atom Alloys, J. Phys. Chem. Lett., 2018, 9(18), 5636–5646 CrossRef CAS PubMed.
- M. T. Darby, R. Réocreux, E. C. H. Sykes, A. Michaelides and M. Stamatakis, Elucidating the Stability and Reactivity of Surface Intermediates on Single-Atom Alloy Catalysts, ACS Catal., 2018, 8(6), 5038–5050 CrossRef CAS.
- T. S. Khan, F. Jalid and M. A. Haider, First-Principle Microkinetic Modeling of Ethanol Dehydrogenation on Metal Catalyst Surfaces in Non-oxidative Environment: Design of Bimetallic Alloys, Top. Catal., 2018, 61(18–19), 1820–1831 CrossRef CAS.
- F. Jalid, T. S. Khan and M. A. Haider, In-silico screening of Pt-based bimetallic alloy catalysts using ab initio microkinetic modeling for non-oxidative dehydrogenation of ethanol to produce acetaldehyde, MRS Commun., 2019, 9(1), 107–113 CrossRef CAS.
- J. Shan, J. Liu, M. Li, S. Lustig, S. Lee and M. Flytzani-Stephanopoulos, NiCu single atom alloys catalyze the C–H bond activation in the selective non- oxidative ethanol dehydrogenation reaction, Appl. Catal., B, 2018, 226, 534–543 CrossRef CAS.
- Y. Guan and E. J. M. Hensen, Ethanol dehydrogenation by gold catalysts: The effect of the gold particle size and the presence of oxygen, Appl. Catal., A, 2009, 361(1–2), 49–56 CrossRef CAS.
- N. Janvelyan, M. A. Van Spronsen, C. H. Wu, Z. Qi, M. M. Montemore and J. Shan, et al., Stabilization of a nanoporous NiCu dilute alloy catalyst for non-oxidative ethanol dehydrogenation, Catal. Sci. Technol., 2020, 10(15), 5207–5217 RSC.
- J. Shan, N. Janvelyan, H. Li, J. Liu, T. M. Egle and J. Ye, et al., Selective non-oxidative dehydrogenation of ethanol to acetaldehyde and hydrogen on highly dilute NiCu alloys, Appl. Catal., B, 2017, 205, 541–550, DOI:10.1016/j.apcatb.2016.12.045.
- G. Giannakakis, A. Trimpalis, J. Shan, Z. Qi, S. Cao and J. Liu, et al., NiAu Single Atom Alloys for the Non-oxidative Dehydrogenation of Ethanol to Acetaldehyde and Hydrogen, Top. Catal., 2018, 61(5–6), 475–486 CrossRef CAS.
- Z. T. Wang, R. A. Hoyt, M. El-Soda, R. J. Madix, E. Kaxiras and E. C. H. Sykes, Dry Dehydrogenation of Ethanol on Pt–Cu Single Atom Alloys, Top. Catal., 2018, 61(5–6), 328–335 CrossRef CAS.
- Z. T. Wang, Y. Xu, M. El-Soda, F. R. Lucci, R. J. Madix and C. M. Friend, et al., Surface Structure Dependence of the Dry Dehydrogenation of Alcohols on Cu(111) and Cu(110), J. Phys. Chem. C, 2017, 121(23), 12800–12806 CrossRef CAS.
- R. A. Hoyt, M. M. Montemore, E. C. H. Sykes and E. Kaxiras, Anhydrous Methanol and Ethanol Dehydrogenation at Cu(111) Step Edges, J. Phys. Chem. C, 2018, 122(38), 21952–21962 CrossRef CAS.
- H. Li, W. Chai and G. Henkelman, Selectivity for ethanol partial oxidation: The unique chemistry of single-atom alloy catalysts on Au, Ag, and Cu(111), J. Mater. Chem. A, 2019, 7(41), 23868–23877 RSC.
- B. N. Zope, D. D. Hibbitts, M. Neurock and R. J. Davis, Reactivity of the gold/water interface during selective oxidation catalysis, Science, 2010, 330(6000), 74–78 CrossRef CAS PubMed.
- A. Dasgupta, Y. Gao, S. R. Broderick, E. B. Pitman and K. Rajan, Machine Learning-Aided Identification of Single Atom Alloy Catalysts, J. Phys. Chem. C, 2020, 124(26), 14158–14166 CrossRef CAS.
- A. Kumar, J. Iyer, F. Jalid, M. Ramteke, S. Tuhin and M. A. Haider, Machine Learning Enabled Screening of Single Atom Alloys : Predicting Reactivity Trend for Ethanol Dehydrogenation, ChemCatChem, 2021 DOI:10.1002/cctc.202101481.
- G. Kresse and J. Furthmüller, Efficiency of ab-initio total energy calculations for metals and semiconductors using a plane-wave basis set, Comput. Mater. Sci., 1996, 6(1), 15–50 CrossRef CAS.
- J. P. Perdew, K. Burke and M. Ernzerhof, Generalized gradient approximation made simple, Phys. Rev. Lett., 1996, 77(18), 3865–3868 CrossRef CAS PubMed.
- P. E. Blöchl, Projector augmented-wave method, Phys. Rev. B: Condens. Matter Mater. Phys., 1994, 50(24), 17953–17979 CrossRef PubMed.
- S. Grimme, S. Ehrlich and L. Goerigk, Effect of the Damping Function in Dispersion Corrected Density Functional Theory, J. Comput. Chem., 2012, 32(7), 1456–1465 CrossRef PubMed.
- D. Sheppard, R. Terrell and G. Henkelman, Optimization methods for finding minimum energy paths, J. Chem. Phys., 2008, 128(13), 1–10 CrossRef PubMed.
- G. Henkelman, B. Uberuaga and H. Jonsson, A climbing image nudged elastic band method for finding saddle points and minimum energy paths, J. Chem. Phys., 2000, 113(22), 9901–9904 CrossRef CAS.
- A. J. Medford, C. Shi, M. J. Hoffmann, T. Bligaard and J. K. Nørskov, CatMAP: A Software Package for Descriptor-Based Microkinetic Mapping of Catalytic Trends, 2015, pp. 794–807 Search PubMed.
- F. Johansson, Others, mpmath: a Python library for arbitrary-precision floating-point arithmetic (version 0.18), 2013, Available from: http://mpmath.org/ Search PubMed.
- S. Wang, B. Temel, J. Shen, G. Jones, L. C. Grabow and F. Studt, et al., Universal Brønsted-Evans-Polanyi relations for C-C, C-O, C-N, N-O, N-N, and O-O dissociation reactions, Catal. Lett., 2011, 141(3), 370–373 CrossRef CAS.
- H. Falsig, J. Shen, T. S. Khan, W. Guo, G. Jones and S. Dahl, et al., On the structure sensitivity of direct NO decomposition over low-index transition metal facets, Top. Catal., 2014, 57(1–4), 80–88 CrossRef CAS.
- S. Wang, V. Petzold, V. Tripkovic, J. Kleis, J. G. Howalt and E. Skúlason, et al., Universal transition state scaling relations for (de)hydrogenation over transition metals, Phys. Chem. Chem. Phys., 2011, 13, 20760 RSC.
- H. Li and G. Henkelman, Dehydrogenation Selectivity of Ethanol on Close-Packed Transition Metal Surfaces: A Computational Study of Monometallic, Pd/Au, and Rh/Au Catalysts, J. Phys. Chem. C, 2017, 121(49), 27504–27510 CrossRef CAS.
- J. K. Norskov, F. Abild-Pedersen, F. Studt and T. Bligaard, Density functional theory in surface chemistry and catalysis, Proc. Natl. Acad. Sci. U. S. A., 2011, 108(3), 937–943 CrossRef CAS PubMed.
- A. C. Lausche, A. J. Medford, T. Suvra, Y. Xu, T. Bligaard and F. Abild-pedersen, et al., On the effect of coverage-dependent adsorbate – adsorbate interactions for CO methanation on transition metal surfaces, J. Catal., 2013, 307, 275–282 CrossRef CAS.
- A. J. Medford, A. C. Lausche, B. Temel, N. C. Schjødt, J. K. Nørskov and F. Studt, Activity and Selectivity Trends in Synthesis Gas Conversion to Higher Alcohols, Top. Catal., 2014, 57(1–4), 135–142 CrossRef CAS.
- L. C. Grabow, F. Studt, F. Abild-Pedersen, V. Petzold, J. Kleis and T. Bligaard, et al., Descriptor-based analysis applied to HCN synthesis from NH3 and CH4, Angew. Chem., Int. Ed., 2011, 50(20), 4601–4605 CrossRef CAS PubMed.
- A. J. Medford, A. C. Lausche, F. Abild-Pedersen, B. Temel, N. C. Schjødt and J. K. Nørskov, et al., Activity and selectivity trends in synthesis gas conversion to higher alcohols, Top. Catal., 2014, 57(1–4), 135–142 CrossRef CAS.
- B. Hammer, Coverage dependence of N2 dissociation at an N, O, or H precovered Ru(0001) surface investigated with density functional theory, Phys. Rev. B: Condens. Matter Mater. Phys., 2001, 63(20), 205423 CrossRef.
- A. Groß, Coverage effects in the adsorption of H2 on Pd(100) studied by ab initio molecular dynamics simulations, J. Chem. Phys., 2011, 135(17), 174707 CrossRef PubMed.
- M. Alam, T. Khan and M. Haider, Alternate Biobased Route To Produce δ-Decalactone: Elucidating the Role of Solvent and Hydrogen Evolution in Catalytic Transfer Hydrogenation, ACS Sustainable Chem. Eng., 2018, 7(3), 2894–2898 CrossRef.
- F. Pedregosa, G. Varoquaux, A. Gramfort, V. Michel, B. Thirion, O. Grisel, M. Blondel, P. Prettenhofer, R. Weiss, V. Dubourg, J. Vanderplas, A. Passos, D. Cournapeau, M. Brucher, M. Perrot and E. D. Scikit-learn, J. Mach. Learn. Res., 2011, 12, 2825–2830 Search PubMed.
- J. H. Friedman, Stochastic gradient boosting, Comput. Stat. Data Anal., 2002, 38(4), 367–378 CrossRef.
- J. Jiang, R. Wang, M. Wang, K. Gao, D. D. Nguyen and G. W. Wei, Boosting Tree-Assisted Multitask Deep Learning for Small Scientific Datasets, J. Chem. Inf. Model., 2020, 60(3), 1235–1244 CrossRef CAS PubMed.
- M. Mukherjee, S. Satsangi and A. K. Singh, A Statistical Approach for the Rapid Prediction of Electron Relaxation Time Using Elemental Representatives, Chem. Mater., 2020, 32(15), 6507–6514 CrossRef CAS.
- M. Neurock, Z. Tao, A. Chemburkar, D. D. Hibbitts and E. Iglesia, Theoretical insights into the sites and mechanisms for base catalyzed esterification and aldol condensation reactions over Cu, Faraday Discuss., 2017, 197, 59–86 RSC.
- F. Jalid, T. S. Khan and M. A. Haider, Insights into the activity and selectivity trends in non-oxidative dehydrogenation of primary and secondary alcohols over the copper catalyst, Catal. Today, 2021, 370, 151–160 CrossRef CAS.
- K. G. Papanikolaou and M. Stamatakis, On the behaviour of structure-sensitive reactions on single atom and dilute alloy surfaces, Catal. Sci. Technol., 2020, 10(17), 5815–5828 RSC.
- B. Hammer and J. K. Norskov, Why gold is the noblest of all the metals, Nature, 1995, 376, 238–240 CrossRef CAS.
Footnote |
| † Electronic supplementary information (ESI) available. See DOI: 10.1039/d1re00396h |
| This journal is © The Royal Society of Chemistry 2022 |

