
Investigation of the effect of microflow reactor diameter on condensation reactions in L-proline-immobilized polymer monoliths†
Seiya
Nonaka
,
Hikaru
Matsumoto
,
Masanori
Nagao
 ,
Yu
Hoshino
and
Yoshiko
Miura
*
,
Yu
Hoshino
and
Yoshiko
Miura
*
Department of Chemical Engineering, Kyushu University, 744 Motooka, Nishi-ku, Fukuoka 819-0395, Japan. E-mail: miuray@chem-eng.kyushu-u.ac.jp
First published on 23rd November 2021
Abstract
The effect of monolith structure and monolith reactor inner diameter on the residence time distribution (RTD), and the relationship between RTD and the catalytic efficiency of the asymmetric aldol addition reaction between p-nitrobenzaldehyde and cyclohexanone were examined. A monolith column containing L-proline as a catalyst was prepared using poly(ethylene glycol) (PEG) as the porogen. The monolith column prepared with PEG with a molecular weight of 6000 Da displayed a narrow pore size distribution and showed a controlled RTD. The performance of monolith reactors with different inner diameters (micro- and millireactors, 0.53 and 4.00 mm) was compared: the microreactor displayed a narrower RTD and a higher turnover number for the asymmetric aldol addition reaction than the millireactor. The different linear flow velocities in the microreactor did not affect the catalytic reaction efficiency and enantioselectivity, demonstrating that the RTDs can be controlled regardless of the flow velocity.
In recent years, there has been considerable interest in continuous flow technology in the chemical industry, and the development of practical and highly efficient flow systems has been actively pursued for further applications in pharmaceutical chemistry and drug discovery, nanomaterials, agrochemicals, fragrance and petrochemicals.1–4 Among the flow systems examined, microflow reactors employed for the production of fine chemicals have shown potential and offer several advantages over conventional batch reactors, as follows.5,6 A small inner diameter (i.d.) ensures short-time radial diffusion, resulting in a narrow residence time distribution (RTD). A high surface-to-volume ratio provides a high specific surface area, which can prevent the formation of hot spots and limit undesirable side reactions.7,8
In general, catalysts are often used in reactions performed in microflow reactors to promote reactions and improve selectivity. In addition, the increased frequency of catalyst–substrate contact in the microfluidic channel can effectively enhance catalytic reactivity. Specifically, heterogeneous catalysts do not require the separation of the catalyst from the reaction solution by filtration or other means, thereby allowing the development of environmentally friendly and safe synthetic technologies for various catalytic reactions.9,10 The immobilization of catalysts in microflow reactors is achieved via (i) wall coating, or the use of (ii) packed beds or (iii) porous monoliths.11 Wall coating can significantly reduce mass transfer resistance.12,13 However, a lower catalyst loading is achieved when compared with that obtained with the other two immobilization methods.11 Packed beds have been widely used owing to their high specific surface areas and small mass transfer resistance. However, packed bed columns suffer from high pressure drops because of their small through-pore size/skeleton size ratio (i.e., ∼0.25–0.40).14 In contrast, porous monoliths have structures with three-dimensional penetrating pores15 and are characterized by a large through-pore size/skeleton size ratio of ∼1.0–2.2.14 The pore size and porosity of the monoliths can be controlled by changing the composition and type of the cross-linker, porogen, and initiator.16
For application in microflow reactors, porous polymer monoliths with frameworks made of acrylamide,17 methacrylate,18 and styrene19 were developed, and their catalytic reactivities were studied. The findings demonstrated the enhancement of catalytic reactions by micronization of the flow reactors containing the porous monoliths. However, the effects of flow phenomena on chemical reaction yields in monolithic microflow reactors are yet to be addressed. Understanding flow phenomena in process equipment, such as monolithic reactors, is important for overall process control and improvement of equipment design.20 RTD is a useful parameter to characterize flow phenomena in a reactor and is used to study deviations from the ideal plug flow.21,22 There have been very few studies on RTDs in flow reactors, and RTDs in monolithic microflow reactors have yet to be measured. This report is the first study to clarify the characteristics of monolithic microflow reactors in terms of RTD. In the present work, monolith flow reactors with an immobilized organocatalyst L-proline were engineered. The effect of the pore structure of the monolith and the i.d. of the reactor on the RTD was investigated. Clarification of the relationship between the RTD and the progress of the L-proline-catalyzed asymmetric aldol addition reaction between p-nitrobenzaldehyde and cyclohexanone enabled optimal design of the monolith flow reactors developed herein.
Methacrylate-type polymers were employed in the preparation of supported-catalyst monoliths. The pore structures of these monoliths were prepared by polymerization-induced phase separation with porogen molecules. By changing the molecular weight of poly(ethylene glycol) (PEG), which was employed as the porogen, the size of the primary particles was controlled.23 To determine the optimal composition, methacrylate-based monoliths were prepared with PEG with a molecular weight of 2000, 4000, 6000 or 10![[thin space (1/6-em)]](https://www.rsc.org/images/entities/char_2009.gif) 000 Da (thereafter denoted as PEG-2000, PEG-4000, PEG-6000, and PEG-10000, respectively). Monoliths with different pore sizes were obtained by radical polymerization of methyl methacrylate, ethylene glycol dimethacrylate, o-methacryloyl-trans-4-hydroxy-L-proline hydrochloride (Pro cat.), and azobisisobutyronitrile in dimethyl sulfoxide (DMSO) solution. The pore size of the monoliths was characterized by both scanning electron microscopy (SEM) observation and mercury intrusion porosimetry (MIP) analysis.
000 Da (thereafter denoted as PEG-2000, PEG-4000, PEG-6000, and PEG-10000, respectively). Monoliths with different pore sizes were obtained by radical polymerization of methyl methacrylate, ethylene glycol dimethacrylate, o-methacryloyl-trans-4-hydroxy-L-proline hydrochloride (Pro cat.), and azobisisobutyronitrile in dimethyl sulfoxide (DMSO) solution. The pore size of the monoliths was characterized by both scanning electron microscopy (SEM) observation and mercury intrusion porosimetry (MIP) analysis.
The SEM images in Fig. 1 reveal that all prepared monoliths were porous with macropores observed between aggregates of particles and the particle size increased with the use of higher molecular weight PEG. The pore size distributions of the prepared monoliths were obtained from MIP (Table 1 and Fig. 2). These monoliths featured a unimodal and narrow pore distribution. The monoliths prepared with PEG-6000 and -10000 showed a similar distribution that was centered at 1–3 μm, whereas broad distributions centered at 0.05–3 μm were observed for the monoliths prepared with PEG-2000 and -4000. The mode and median diameters of the pores are shown in Table 1. These results corresponded with the structures of monoliths in the SEM images. The difference in the pore size and the specific surface area of the monoliths was related to the length of the polymer chains of PEG. Longer polymer chains of PEG induced more steric hindrance in the solvation system, resulting in larger pores and smaller specific surface areas.24,25 However, the porosity of the monoliths was determined only by the composition (e.g., volume percentage of monomers) of the polymerization solution, and thus, the difference between the porosity of each monolith was slight (76, 69, 67, and 75%, respectively).
 | ||
| Fig. 1 SEM images of the monoliths prepared with (A) PEG-2000, (B) PEG-4000 (C) PEG-6000, and (D) PEG-10000 as porogens. | ||
| Entry | Porogen | Specific surface area [m2 g−1] | Pore mode diameter [nm] | Pore median diameter [nm] | Porosity [%] |
|---|---|---|---|---|---|
| For MIP analysis, the monoliths prepared in glass vials were crushed into small pieces (about 1 cm3). | |||||
| 1 | PEG-2000 | 97 | 159 | 272 | 76 |
| 2 | PEG-4000 | 96 | 297 | 304 | 69 |
| 3 | PEG-6000 | 45 | 2593 | 2660 | 67 |
| 4 | PEG-10000 |
22 | 2599 | 2718 | 75 |
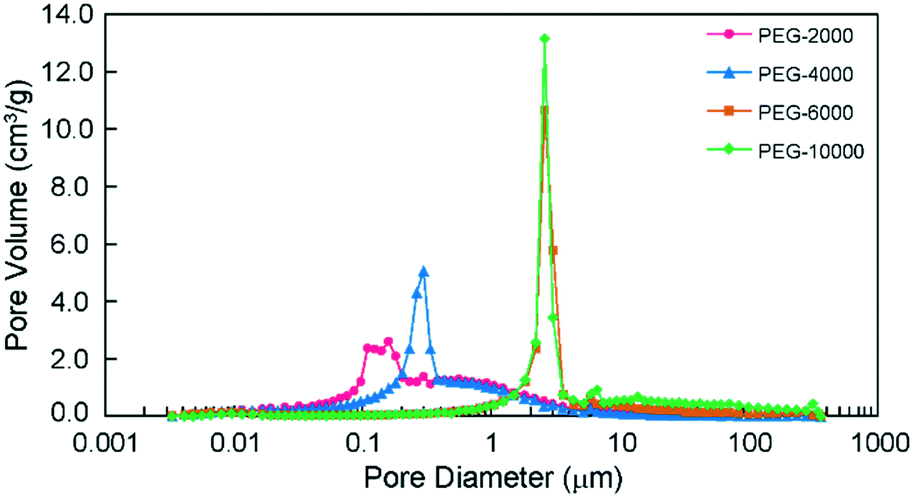 | ||
| Fig. 2 Pore size distribution of the monoliths prepared with PEG-2000, -4000, -6000 and -10000 as porogens, as determined by MIP. | ||
The monoliths with different pore structures were polymerized in stainless steel columns (4.0 mm i.d.). After washing the porogen with methanol, the permeability coefficients from the Darcy equation were measured using a mixture of DMSO:water (80:20 v/v) as an eluent and were determined as 7.9 × 10⁻¹⁵ and 2.1 × 10⁻¹³ m2 for the PEG-4000-based monoliths and PEG-6000-based monoliths, respectively. For the monolith columns prepared with PEG-2000 and -10000, the eluent did not pass through. The PEG-2000-based monoliths featured the smallest pore mode diameter (159 nm), which resulted in a too small permeability coefficient to measure. The monolithic column prepared with PEG-10000, which had the largest pore size, generated high back pressure upon permeation of organic solvents because of the low solubility of PEG-10000 in methanol (washing solvent), causing the low permeability. Therefore, monoliths prepared with PEG-2000 and PEG-10000 were inappropriate as column packing materials.
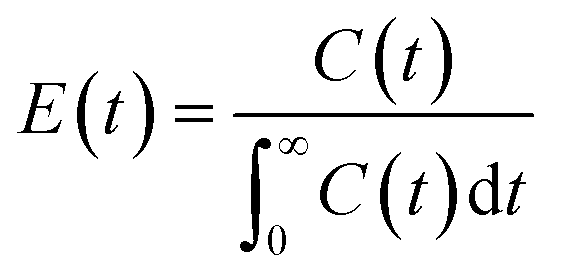
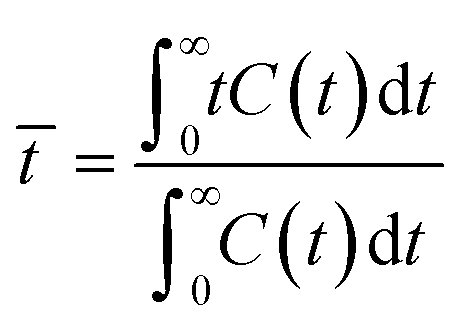
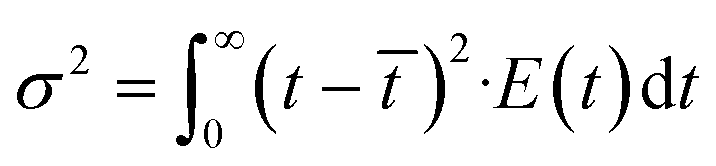
A pulse tracer experiment was performed to determine the RTD of the monolith column reactors. In this experiment, an inert tracer pulse is injected into the solvent stream flowing through the reactor and analyzed at the reactor outlet by monitoring changes in the concentration of the tracer by UV-vis spectroscopy. From the elution curve obtained from the tracer experiment, the RTD function E(t) and the average residence time (![[t with combining macron]](https://www.rsc.org/images/entities/i_char_0074_0304.gif) ) were calculated using eqn (1) and (2), respectively:
) were calculated using eqn (1) and (2), respectively:
 | (1) |
 | (2) |
) as shown in eqn (3): | θ = t/ | (3) |
| E(θ) = E(t) | (4) |
 | (5) |
 | ||
| Fig. 3 Dimensionless RTD curves obtained for the monolith columns with different pore sizes. The variance values of the RTDs were 0.48 and 0.30 for PEG-4000 and -6000, respectively. | ||
To investigate the effect of column i.d. on RTD, the PEG-6000-based monoliths were polymerized in either fused silica capillaries (microreactor, 0.53 mm i.d.) or stainless-steel columns (millireactor, 4.0 mm i.d.). The RTDs of the tracer passing through the PEG-6000-based monolith packed reactors with different i.d. values are shown in Fig. 4A. In the pulsed tracer test, the variance values of the RTD for the micro- and millireactors were 0.038 and 0.30, respectively. Therefore, the microreactor had a RTD closer to that of the ideal plug flow. The different variance values obtained are attributed to differences in radial diffusivity in the reactors owing to the different i.d. sizes. Radial diffusion is larger in the millireactor, resulting in a radial concentration distribution of the tracer. In contrast, the effect of radial diffusion is smaller in the microreactor. Therefore, the concentration distribution in the radial direction is small and the dispersion value of RTD is small. Similar results were observed for micro- and millireactors without packing materials,22 indicating that the characteristics of microreactors can be used in monolith packed reactors. These results reveal that the the i.d. of monolith reactors has a significant effect on the RTD variance as a result of the extent of radial diffusion. Consequently, in a monolith flow reactor, the radius influences the concentration distribution in the radial direction, and a smaller i.d. reduces the effect of concentration distribution, thus providing an RTD close to that of the ideal plug flow.
 | ||
| Fig. 4 (A) Dimensionless RTD curves of the PEG-6000-based monolith reactors of different inner diameter (i.d.) values. The variance values of the RTDs were 0.038 and 0.30 for 0.53 and 4.00 mm i.d., respectively. (B) TON profiles of the aldol addition reaction between cyclohexanone and p-nitrobenzaldehyde performed in PEG-6000-based monolith reactors of different i.d. values. | ||
The asymmetric aldol addition reaction was examined under flow conditions in the PEG-6000-based monolith column micro- and millireactors (Fig. 5). p-Nitrobenzaldehyde (0.20 mmol, 1 eq.) and cyclohexanone (1.0 mmol, 5 eq.) in DMSO/water (8:2 v/v, 1 mL) were passed through the column with a retention time of 30 min. The eluent was continuously collected, and the product yield was determined by high-performance liquid chromatography (HPLC). The enantiomeric excess (ee) values of the reaction performed in the micro- and millireactors were 96% and 95%, respectively. Both reactors afforded high reaction selectivity and a sustained L-proline catalytic activity. The turnover number (TON) values at 15 bed volumes were 10 and 8 for the micro- and millireactors, respectively (Fig. 4B). The higher TON achieved in the microreactor was due to the smaller RTD variance, as measured in the tracer experiments. The substrate passing through the microreactor is eluted within the set residence time and a small error range, which provides enough time for the reaction. In contrast, in the millireactor, the RTD is broad and the error in the residence time is large. Therefore, substrates in the millimeter reactor are eluted in a shorter time than the set residence time, resulting in shorter reaction times and lower yields. Inhibition of the reaction by the product generated in the L-proline-catalyzed asymmetric aldol addition reaction has also been observed.26 Conversely, in a plug flow, there is no residual material in the reactor and the residence time is constant. The microflow reactor provides a pseudo plug flow, leading to precise control of the residence time. This feature enables excellent productivity in heterogeneous catalytic flow systems.
 | ||
| Fig. 5 Schematic illustration of the continuous-flow system for asymmetric aldol addition reaction between cyclohexanone and p-nitrobenzaldehyde. | ||
The linear flow velocity is expressed as the distance moved by the solution per unit time relative to the direction of movement. The negative impact of back mixing, which is a factor of tailing in RTD, can be improved by increasing the linear flow velocity in a conventional monolith flow reactor.17 The effect of linear flow velocity on reactivity in microreactors was investigated. Microreactors of different lengths were prepared in the range of 50–125 mm to maintain a residence time of 30 min regardless of the linear velocity. The PEG-6000-based monoliths were used as the packing material for all columns. The linear velocities were 10, 15, 20, and 25 cm h−1 for the columns examined (Table 2). The permeability values of the monolith columns with lengths of 50, 75, 100, and 125 mm were 3.4, 3.9, 3.6, and 3.4 × 10⁻¹³ m2, respectively (Table 2), allowing for elaborate scale-up. Each monolith column with different lengths showed similar dimensionless RTD curves with a narrow variance (Fig. 6A).
 | ||
| Fig. 6 (A) Dimensionless RTD curves of the PEG-6000-based monolith microreactors of different lengths (red line: 50 mm L, blue line: 100 mm L, green line: 125 mm L, orange line: 150 mm L). (B) Product yield of the asymmetric aldol addition reaction between cyclohexanone and p-nitrobenzaldehyde performed in PEG-6000-based monolith microreactors of different lengths (red circle: 50 mm L, blue triangle: 100 mm L, green rhombus: 125 mm L, orange square: 150 mm L). | ||
Asymmetric aldol addition reactions and tracer experiments were performed in the prepared microreactors. The TON values in 20 bed volumes measured for the asymmetric aldol addition reaction performed in the PEG-6000-based monolith microreactors were comparable (i.e., TON 12–13) across the different microreactor column lengths studied (Fig. 6B and Table 2). The ee values were also comparable (95–96%), indicating high selectivity (Table 2). The pulse tracer experiments revealed the small variance of the RTD (i.e., 0.026–0.038; Table 2) regardless of the column length of the microreactors. Existing reports have shown that the symmetry of the RTD increases and the dispersion value decreases with increasing linear velocity in monolith millireactors (10 mm i.d.).21 In contrast, this effect was not observed in the current microflow system (0.53 mm i.d.). This indicates that the negative effect of back mixing in the millireactors was not observed in the microflow reactor. In addition, the linear velocity did not exert any apparent effects on the catalytic reaction, suggesting that the catalytic reaction was rate-limiting. The yield of the asymmetric aldol addition reactions decreased with the bed volume, and a sequential decrease was observed until 40 bed volume (Fig. S5†). This deactivation of the catalyst was due to the unavoidable decomposition of the L-proline catalyst.27 When the residence time was changed to 60 min, the reaction yield improved (but still decreased with the bed volume), indicating that the rate-limiting step in this system was the catalytic reaction (Fig. S6†).
In conclusion, the effects of monolith structure, reactor i.d., and linear velocity on RTD were investigated. The pore structure of the monolith was altered by changing the molecular weight of PEG, employed as a porogen. The MIP and tracer studies of the prepared monoliths demonstrated that the pore size distribution of the monoliths was an important factor for the RTD and that a uniform pore size distribution reduced the RTD variance. The micro- and millireactors showed RTD variance values of 0.029 and 0.30, respectively, and the microreactor showed a more controlled RTD. The microreactors also showed higher yields of the target product in the asymmetric aldol addition reaction between p-nitrobenzaldehyde and cyclohexanone when compared with the millireactors, indicating the importance of RTD control in reactor performance. The difference in the linear velocity in the microreactors did not affect the target product yield and enantioselectivity, and the RTD variance values were comparable. The microreactors exhibited excellent RTD control and stable target production regardless of the linear velocity. To the best of our knowledge, the current investigation is the first study on the effects of RTD in a monolithic microreactor; the findings demonstrate that a microreactor with advanced RTD control affords superior reactor performance.
Author contributions
S. Nonaka, H. Matsumoto and Y. Miura designed the experiments. S. Nonaka performed the experiments. S. Nonaka and M. Nagao wrote the manuscript. M. Nagao and Y. Hoshino made contributions to the discussions during the work. All authors have given approval to the final version of the manuscript.Conflicts of interest
There are no conflicts to declare.Acknowledgements
This work was supported by a Grant-in-Aid for Scientific Research on Innovative Areas (JP20H04825 and JP19H02766).References
- S. V. Ley, Y. Chen, A. Robinson, B. Otter, E. Godineau and C. Battilocchio, Org. Process Res. Dev., 2021, 25, 713–720 CrossRef CAS.
- A. Gioiello, A. Piccinno, A. M. Lozza and B. Cerra, J. Med. Chem., 2020, 63, 6624–6647 CrossRef CAS PubMed.
- G. Gambacorta, J. S. Sharley and I. R. Baxendale, Beilstein J. Org. Chem., 2021, 17, 1181–1312 CrossRef CAS.
- O. Długosz and M. Banach, React. Chem. Eng., 2020, 5, 1619–1641 RSC.
- N. Kockmann, M. Gottsponer, B. Zimmermann and D. M. Roberge, Chem. – Eur. J., 2008, 14, 7470–7477 CrossRef CAS.
- P. M. Jonathan and K. F. Jensen, Org. Process Res. Dev., 2011, 15, 398–407 CrossRef.
- K. Gunther and V. Hessel, Chem. Eng. J., 2004, 98, 1–38 CrossRef.
- K. M. Lioubov and A. Renken, Catal. Today, 2005, 110, 2–14 CrossRef.
- K. Masuda, T. Ichitsuka, N. Koumura, K. Sato and S. Kobayashi, Tetrahedron, 2018, 74, 1705–1730 CrossRef CAS.
- T. Tsubogo, H. Oyamada and S. Kobayashi, Nature, 2015, 520, 329–332 CrossRef CAS.
- R. Munirathinam, J. Huskens and W. Verboom, Adv. Synth. Catal., 2015, 357, 1093–1123 CrossRef CAS.
- R. Ricciardi, R. Munirathinam, J. Huskens and W. Verboom, ACS Appl. Mater. Interfaces, 2014, 6, 9386–9392 CrossRef CAS.
- S. Jang, S. Vidyacharan, B. T. Ramanjaneyulu, K. W. Gyak and D. P. Kim, React. Chem. Eng., 2019, 4, 1466–1471 RSC.
- A.-M. Siouffi, J. Chromatogr. A, 2006, 1126, 86–94 CrossRef CAS.
- V. Chiroli, M. Benaglia, A. Puglisi, R. Porta, R. P. Jumde and A. Mandoli, Green Chem., 2014, 16, 2798–2806 RSC.
- A. Namera, A. Nakamoto, T. Saito and S. Miyazaki, J. Sep. Sci., 2011, 34, 901–924 CrossRef CAS.
- F. G. Adly and A. Ghanem, Tetrahedron Lett., 2016, 57, 852–857 CrossRef CAS.
- J. Krenkova, N. A. Lacher and F. Svec, J. Chromatogr. A, 2009, 1216, 3252–3259 CrossRef CAS PubMed.
- A. Gömann, J. A. Deverell, K. F. Munting, R. C. Jones, T. Rodemann, A. J. Canty, J. A. Smith and R. M. Guijt, Tetrahedron, 2009, 65, 1450–1454 CrossRef.
- É. S. Siguemoto, L. L. Reche, J. A. W. Gut and M. S. A. Palma, Chem. Eng. Technol., 2020, 43, 429–435 CrossRef.
- V. Sans, N. Karbass, M. I. Burguete, E. García-Verdugo and S. V. Luis, RSC Adv., 2012, 2, 8721–8728 RSC.
- S. R. L. Gobert, S. Kuhn, L. Braeken and L. C. J. Thomassen, Org. Process Res. Dev., 2017, 21, 531–542 CrossRef CAS.
- M. L. Chen, L. M. Li, B. F. Yuan, Q. Ma and Y. Q. Feng, J. Chromatogr. A, 2012, 1230, 54–60 CrossRef CAS.
- M. Chen, Y. Lu, Q. Ma, L. Guo and Y. Q. Feng, Analyst, 2009, 134, 2158–2164 RSC.
- J. Courtois, E. Byström and K. Irgum, Polymer, 2006, 47, 2603–2611 CrossRef CAS.
- K. Sakthivel, W. Notz, T. Bui and C. F. Barbas, J. Am. Chem. Soc., 2001, 123, 5260–5267 CrossRef CAS.
- N. Zotova, A. Franzke, A. Armstrong and D. G. Blackmond, J. Am. Chem. Soc., 2007, 129, 15100–15101 CrossRef CAS PubMed.
Footnote |
| † Electronic supplementary information (ESI) available: Materials, experimental conditions, and 1H NMR spectrum of the compound. See DOI: 10.1039/d1re00386k |
| This journal is © The Royal Society of Chemistry 2022 |