 Open Access Article
Creative Commons Attribution 3.0 Unported Licence
Straintronic effect for superconductivity enhancement in Li-intercalated bilayer MoS2†
Poobodin
Mano
 a,
Emi
Minamitani
*b and
Satoshi
Watanabe
*a
aDepartment of Materials Engineering, The University of Tokyo, 7-3-1 Hongo, Bunkyo, Tokyo 113-8656, Japan. E-mail: watanabe@cello.t.u-tokyo.ac.jp
bInstitute for Molecular Science, 38 Nishigo-Naka, Myodaiji, Okazaki, Aichi 444-8585, Japan. E-mail: eminamitani@ims.ac.jp
First published on 6th July 2020
Abstract
In this study, ab initio calculations were performed to show that the superconductivity in Li-intercalated bilayer MoS2 could be enhanced by applying either compressive or tensile strain. Moreover, the mechanism for superconductivity enhancement for the tensile strain case was found to be different than that of the compressive strain case. Enhanced electron phonon coupling (EPC) under tensile strain could be explained by an increase in the nesting function involved with the change in the Fermi surface topology in a wide range of Brillouin zones. The superconducting transition temperature Tc of 0.46 K at zero strain increased up to 9.12 K under a 6.0% tensile strain. Meanwhile, the enhancement in compressive strain was attributed to the increase in intrinsic electron phonon matrix elements. Furthermore, the contribution from interband scattering was large, which suggested the importance of electron pockets on the Fermi surface. Finally, 80% of the total EPC (λ = 0.98) originated from these pockets and the estimated Tc was 13.50 K.
Layered materials have been investigated for a long time owing to their tunable features, which enable various applications. Amongst them, superconductivity has recently attracted considerable attention, and various mechanisms have been proposed to explain the emergence or enhancement of superconductivity in these layered materials.1 Graphene is a representative example of such materials. However, the small band gap in graphene limits its practical applications. Hence, MoS2, which is a transition metal dichalcogenide (TMD) with a band gap, has recently attracted significant attention.2–6 MoS2 becomes a metal by the intercalation of alkali metals.7–9 Furthermore, the intercalated bilayer MoS2 has been predicted to be a superconductor; the values of superconducting transition temperature (Tc) estimated by the McMillan–Allen–Dynes formula using ab initio calculation were 10, 2.9, and 13.3 K for Li,10 Na,11 and Ca12 intercalation cases, respectively. Superconductivity has been explained by the increase in the electron density of states (DOS) at the Fermi level, phonon softening owing to the screening effect,10 and the enhancement in electron phonon coupling.10,12
Furthermore, the change in electron and phonon energy band structures induced by strain provide tunability to the properties of MoS2.13–15 In the case of ultrathin MoS2, it is noteworthy that a strain of 6–11% can be induced with an average breaking strength of 15 ± 3 Nm−1.16,17 Enhanced superconductivity in a Na-intercalated bilayer with tensile strain was predicted by ab initio calculations.11 A relatively low Tc of 2.9 K at zero strain can be increased up to Tc = 10 K at 7% tensile strain, while superconductivity is suppressed under compressive strains.
In this study, we investigate the effect of strain on the superconductivity of Li-intercalated bilayer MoS2 for both compressive and tensile strain cases. In contrast to the Na-intercalation case, we discovered that superconductivity can be enhanced under both compressive and tensile strains. The emergence of superconductivity under compressive strain can be attributed to the significant softening of phonons at a specific q-wave vector in the Brillouin Zone, which does not appear in the Na-intercalation case. Consequently, Tc is predicted to increase to 13.50 K at a 5.5% compressive strain.
The electron and phonon structures were calculated based on density functional theory (DFT)18 and density functional perturbation theory using Quantum Espresso19 combined with Wannier interpolation implemented in the Electron–Phonon Wannier (EPW)20 package. Local density approximation was used as an exchange-correlation functional with the norm-conserving pseudopotential21,22 distributed on the Quantum Espresso website. Furthermore, van der Waals interactions were considered using the Grimme-D2 method.23 A plane-wave basis set with an energy cutoff of 60 Ry was adopted to describe the electronic wave functions. The Methfessel–Paxton method24 with a smearing parameter of 0.01 Ry was used to obtain the charge density. A 24 × 24 × 1 Monkhorst–Pack25k-mesh was used for the electronic states and a 12 × 12 × 1 q-mesh for dynamical matrix calculations.
Superconductivity was studied based on the electron phonon coupling mechanism. First, we calculated the phonon linewidth as follows:
 | (1) |
 | (2) |
 | (3) |
 | (4) |
 | (5) |
The estimate for Tc was further confirmed by evaluating the temperature dependence of the superconducting gap obtained by anisotropic Eliashberg equations.28 The convergence was achieved at 48 × 48 × 1 k-mesh and a 48 × 48 × 1 q-mesh (for details, see Section 5 in ESI†). Here, the Coulomb repulsion parameter μ* was set to 0.1. The nesting function, expressed as
 | (6) |
was analyzed to understand the relationship between the Fermi surface topology and the behavior of EP interaction.
Fig. 1 shows the model structure of the Li-intercalated bilayer MoS2 in this study. The stacking of MoS2 layers and the position of the intercalated Li have been reported as the most stable structure in a previous study.10 In the z-direction, we imposed a periodic boundary condition with a 15 Å vacuum layer. The in-plane lattice parameter of the Li-intercalated equilibrium bilayer structure was optimized to 3.16 Å, which agreed well with the experimental value of 3.16 Å in pristine bulk.29 A biaxial strain was induced by changing the in-plane lattice parameter up to ±8% with respect to the equilibrium one, whereas the out-of-plane direction was maintained. The atomic positions of all the strain-induced structures were relaxed with convergence thresholds of 0.5 meV Å−1 on the forces and 0.03 meV on the total energy. The relaxation caused the distances between the Mo-layer and S-layers to decrease under tensile strain and increase under compressive strain. This indicates a positive Poisson's ratio in the out-of-plane direction, which corresponds well to that reported in a previous study.30
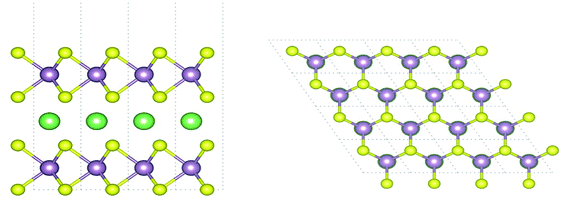 | ||
| Fig. 1 Side view (left) and top view (right) of the Li-intercalated bilayer MoS2 structure. Purple, yellow, and green spheres denote Mo, S, and Li, respectively. | ||
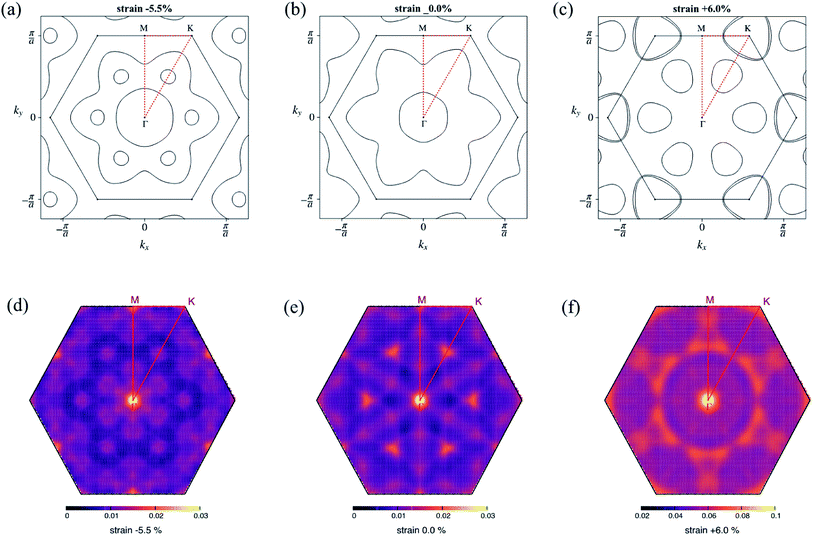
The evolution of the electronic band structure under strain is presented in Fig. S1 ESI.† In all cases, Li intercalation caused a semiconductor–metal transition, and the original MoS2 conduction band crossed the Fermi level. The bands near the Fermi level comprised of Mo dxy, dx2−y2, and dz2 orbitals hybridized with S p-orbitals. Without strain, the two valleys, one located at the middle of the Γ–K path and the other at the middle of the Γ–M path, formed two Fermi surfaces with circular and lily-like shapes, respectively (Fig. 2b). As the compressive strain increased, the bandwidth increased owing to stronger hybridization, and the additional band crossed the Fermi level. This appeared as an excess small electron pocket, as shown in Fig. 2a. In contrast, as the tensile strain increased, the valleys that contributed to the Fermi surface differed. Instead of the valley in the middle of the Γ–M path, the valley at the k point formed an electron pocket. In addition, the Fermi surface formed by the valley in the middle of the Γ–K path is reduced. This resulted in a completely different Fermi surface compared to that in the zero-strain case (Fig. 2c). The above-mentioned changes in the Fermi surface topology are reflected in the nesting function shown in Fig. 2d–f. The value of the nesting function under compressive strain remained in the same order as that in the zero-strain case, while it increased under tensile strain.
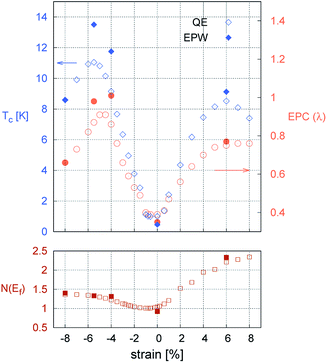
Fig. 3 shows the strain dependence of the calculated superconductivity Tc together with those of the EPC constant (λ) and DOS at the Fermi level (N(εF)). Thus, Tc can be increased by both tensile and compressive strains in the Li-intercalated bilayer MoS2 system. This point is consistent with the data estimated from the temperature dependence of the superconducting gap obtained by anisotropic Eliashberg equations28 shown in Fig. 4. The estimated Tc under zero strain was 0.46 K, which was considerably lower than that estimated in a previous study, that is, 10 K.10 This discrepancy may be caused by the different choice in lattice parameter or computation conditions (as shown in Fig. S4 in ESI†), as the Tc depends significantly on the choice of k- and q-meshes and Gaussian broadening σ.
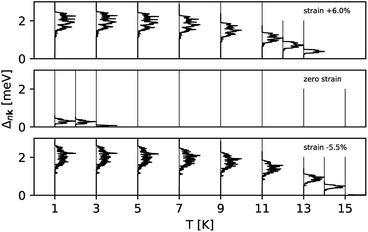 | ||
| Fig. 4 The superconducting gap obtained by the anisotropic Eliashberg equations as a function of temperature at strains 6, 0, and −5.5%. | ||
At 6.0% tensile strain, the Tc reached a maximum at 9.12 K with an EPC constant λ = 0.77. The enhancement in λ can be partly explained by the strong intensity in the double-delta function term in eqn (1), which is of the same form as that of the nesting function. As shown in Fig. 2f, the change in the Fermi surface topology caused the nesting function to increase in the wide range of the Brillouin zone.
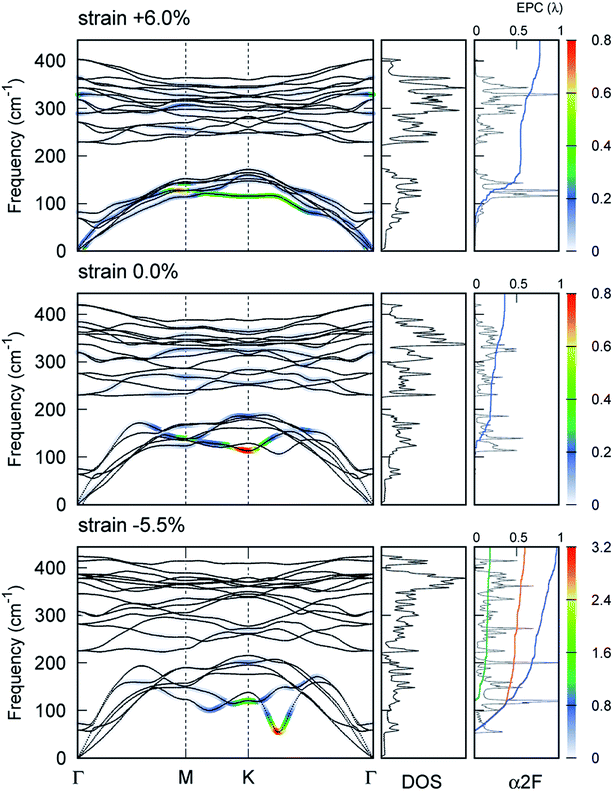
However, the explanation above based on the nesting function is not applicable to the compressive strain case where the intensity of the nesting function remains in the same order as that of the zero-strain case. Instead, we discovered a significant softening of the phonon,  accompanied by a large intensity in momentum and mode-resolved λqν (Fig. 5). Note that similar phonon behaviors have been observed in Li-intercalated bilayer SnS2 (ref. 31) and NaSn5,32 while significant enhancement in nesting function seen in these studies was not observed in the present study. This mode and the lowest phonon mode at the k point produce intensive peaks in the Eliashberg function and contribute 57% of the total EPC constant (λ = 0.98).
We discovered that the appearance of the soft mode originated from the strong intrinsic EP matrix element. Considering the electron–phonon self-energy, Π(qν), the renormalized phonon frequency ωqν can be described as33
| (ℏωqν)2 = (ℏω(0)qν)2 + 2(ℏω(0)qν)|gqν|2Re[Π(qν)], | (7) |
 and substituting
  , where nF(εk) is the Fermi–Dirac distribution function at the corresponding energy level, into the real part of the phonon's self-energy. The distribution of the factor |gqν|2Re[Π(qν)] shows an enhancement in the intrinsic EP matrix element at a specific momentum
  and mode (see Section 6 in ESI†).
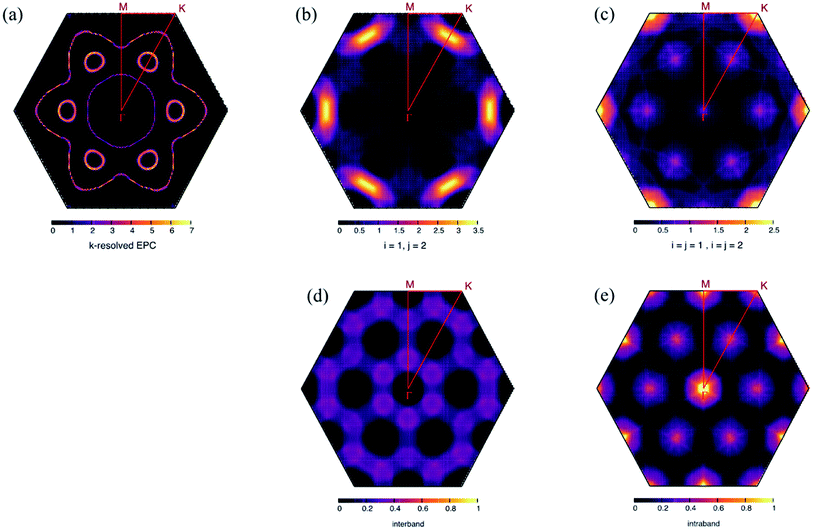
The soft mode above involves only a specific scattering process on the Fermi surface. In the compressive strain case, two bands crossed the Fermi level. We herein denote them as band (1) and (2). The decomposition of λqν into an intraband and interband shows that the interband process involving a small electron pocket that appeared at  formed by band (2) was important. The calculation results of each contribution are shown in Fig. 6b and c together with the nesting function limited to the dxy, dx2−y2, and dz2 orbitals of the Mo atoms (Fig. 6d and e) that primarily contributed to the EPC at the Fermi surface (see Section 8 in ESI†). λ(i=j) has a similar distribution to the corresponding nesting function for the significantly high contribution from the wave vectors Γ,
  , and
, and  . The integrated values of λ(i=j) for bands (1) and (2) were estimated to be 20% and 19% of the total EPC, respectively. Meanwhile, λ(i≠j) was enhanced at
  , where phonon softening occurred. The EPC integrated over the interband process becomes 61% of the total EPC. Therefore, interband scattering mediated by the soft mode dominates Tc.
An increase in EPC with phonon softening in TMDs is typically discovered in systems involving charge density waves (CDWs).33,35–37 Although CDWs have not been reported in doped MoS2 systems, their existence has been confirmed in other metal TMDs, such as NbSe2,38 TaSe2,35 and TiSe2.39 Recently, NbS2, a TMD, has been discovered to possess latent CDWs owing to its phonon behaviors and DOS at the Fermi level.40 Although a phase transition from an ordered structure to a distorted structure accompanied by a negative frequency did not appear in phonons, a significant phonon softening with enhanced intrinsic EP matrix elements under its metallic nature can be regarded as a precursor to the CDW transition. This seems consistent with a recent study on TaS2.41
In conclusion, we demonstrated that the superconductivity in Li-intercalated bilayer MoS2 can be enhanced by both compressive and tensile strains. In contrast to Na-intercalation, where the superconductivity is suppressed only under compressive strain, both tensile and compressive strains enhanced the superconductivity, whose Tc increased from 0.46 to 9.12 and 13.50 K under tensile and compressive strains, respectively. Under tensile strain, the enhancement was partly driven by an increase in the nesting function, which was related to the Fermi surface topology. However, in the compressive strain case, a significant phonon softening that occurred at a specific wave vector was found to be related to high intrinsic EP matrix elements. This indicates that the precursor state of CDW instability in layered materials can enhance superconductivity.
Conflicts of interest
There are no conflicts of interest to declare.Acknowledgements
The following financial support is acknowledged: JST PRESTO JPMJPR17I7 (E. M.) and JSPS KAKENHI 17H05215 and 19H02544 (S. W. and E. M.). The calculations were performed using the SGI Rackable C2112-4GP3/C1102-GP8 (Reedbush-U/H/L) at the Information Technology Center, University of Tokyo.References
- Y. Saito, T. Nojima and Y. Iwasa, Nat. Rev. Mater., 2016, 2, 16094 CrossRef.
- A. D. Yoffe and J. A. Wilson, Adv. Phys., 1969, 18, 193 CrossRef.
- K. K. Kam and B. A. Parkinson, J. Phys. Chem., 1982, 86, 463 CrossRef CAS.
- J. Gusakova, et al. , Phys. Status Solidi A, 2017, 214, 1700218 CrossRef.
- K. F. Mak, C. Lee, J. Hone, J. Shan and T. F. Heinz, Phys. Rev. Lett., 2010, 105, 136805 CrossRef PubMed.
- S. Ahmad and S. Mukherjee, Graphene, 2014, 3, 50633 CrossRef.
- N. V. Petrova, I. N. Yakovkin and D. A. Zeze, Appl. Surf. Sci., 2015, 353, 333 CrossRef CAS.
- A. N. Enyashin and G. Seifert, Comput. Theor. Chem., 2012, 999, 13 CrossRef CAS.
- J. A. Woollam and R. B. Somoano, Mater. Sci. Eng., 1977, 31, 289 CrossRef CAS.
- G. Q. Huang, Z. W. Xing and D. Y. Xing, Phys. Rev. B, 2016, 93, 104511 CrossRef.
- J. J. Zhang, B. Gao and S. Dong, Phys. Rev. B, 2016, 93, 155430 CrossRef.
- R. Szczesniak, A. P. Durajski and M. W. Jarosik, Front. Phys., 2018, 13, 137401 CrossRef.
- R. Frisenda, et al. , npj 2D Mater. Appl., 2017, 1, 10 CrossRef.
- X. Meng, et al. , Phys. Rev. Lett., 2019, 122, 155901 CrossRef CAS PubMed.
- C. H. Chang, et al. , Phys. Rev. B: Condens. Matter Mater. Phys., 2013, 88, 195420 CrossRef.
- S. Bertolazzi, J. Brivio and A. Kis, ACS Nano, 2011, 5, 9703 CrossRef CAS PubMed.
- J. N. Coleman, et al. , Science, 2011, 331, 6017 CrossRef PubMed.
- W. Kohn and L. J. Sham, Phys. Rev., 1965, 140, A1133 CrossRef.
- P. Giannozzi, et al. , J. Phys.: Condens. Matter, 2009, 21, 39 CrossRef PubMed.
- S. Ponce, et al. , Comput. Phys. Commun., 2016, 209, 116 CrossRef CAS.
- D. R. Hamann, M. Schluter and C. Chiang, Phys. Rev. Lett., 1979, 43, 1494 CrossRef CAS.
- C. Hartwigsen, S. Goedecker and J. Hutter, Phys. Rev. B: Condens. Matter Mater. Phys., 1998, 58, 3641 CrossRef CAS.
- S. Grimme, J. Comput. Chem., 2006, 27, 1787 CrossRef CAS PubMed.
- M. Methfessel and A. T. Paxton, Phys. Rev. B: Condens. Matter Mater. Phys., 1989, 40, 3616 CrossRef CAS PubMed.
- H. J. Monkhorst and P. D. James, Phys. Rev. B: Solid State, 1976, 13, 5188 CrossRef.
- M. Wierzbowska, S. de Gironcoli and P. Giannozzi, arXiv:cond-mat/0504077, 2005.
- P. B. Allen and R. C. Dynes, Phys. Rev. B: Solid State, 1975, 12, 905 CrossRef CAS.
- E. R. Margine and F. Giustino, Phys. Rev. B: Condens. Matter Mater. Phys., 2013, 87, 024505 CrossRef.
- P. A. Young, J. Phys. D: Appl. Phys., 1968, 1, 936 CrossRef.
- S. Woo, H. C. Park and Y. W. Son, Phys. Rev. B, 2016, 93, 075420 CrossRef.
- Z. Y. Wand, W. Xia and G. Q. Huang, Phys. C, 2017, 543, 52 CrossRef.
- C. M. Hao, et al. , Inorg. Chem., 2020, 59, 484 CrossRef CAS.
- X. Zhu, et al. , Proc. Natl. Acad. Sci. U. S. A., 2015, 112, 2367 CrossRef CAS PubMed.
- S. Piscanec, et al. , Phys. Rev. Lett., 2004, 93, 185503 CrossRef CAS.
- C. S. Lian, et al. , J. Phys. Chem. Lett., 2019, 10(14), 4076 CrossRef CAS PubMed.
- F. Flicker and J. Van Wezel, Nat. Commun., 2015, 6, 7034 CrossRef CAS PubMed.
- M. M. Ugeda, et al. , Nat. Phys., 2016, 12, 92 Search PubMed.
- F. Weber, et al. , Phys. Rev. Lett., 2011, 107, 107403 CrossRef CAS PubMed.
- D. L. Duong, M. Burghard and J. C. Schon, Phys. Rev. B: Condens. Matter Mater. Phys., 2015, 92, 245131 CrossRef.
- C. Heil, et al. , Phys. Rev. Lett., 2017, 119, 087003 CrossRef PubMed.
- Y. Yang, et al. , Phys. Rev. B, 2018, 98, 035203 CrossRef CAS.
Footnote |
| † Electronic supplementary information (ESI) available. See DOI: 10.1039/d0na00420k |
| This journal is © The Royal Society of Chemistry 2020 |

