
 Open Access Article
 This Open Access Article is licensed under a Creative Commons Attribution-Non Commercial 3.0 Unported Licence
Fe2O3–rice straw carbon dot composite for simultaneous electrochemical detection of dopamine and salbutamol
Nguyen
Van Hop
 a,
Nguyen
Le My Linh
b,
Vo Chau
Ngoc Anh
ac,
Do Mai
Nguyen
*a and
Tran Thanh
Tam Toan
*d
a,
Nguyen
Le My Linh
b,
Vo Chau
Ngoc Anh
ac,
Do Mai
Nguyen
*a and
Tran Thanh
Tam Toan
*d
aUniversity of Sciences, Hue University, 530000, Vietnam. E-mail: dmnguyen.dhkh23@hueuni.edu.vn
bUniversity of Education, Hue University, 530000, Vietnam
cUniversity of Medicine and Pharmacy, Hue University, 530000, Vietnam
dDong A University, Danang City, 550000, Vietnam. E-mail: toanttt@donga.edu.vn
First published on 7th March 2025
Abstract
A novel electrochemical sensor was developed using a composite of iron oxide (Fe2O3) and rice straw-based carbon dots (RSCD) for the simultaneous detection of dopamine (DPM) and salbutamol (SBT). By modifying a glassy carbon electrode (GCE) with the synthesized composite, the sensor achieved detection limits of 0.02 μM for DPM and 0.03 μM for SBT, with a linear range extending from 0.1 to 92 μM. Differential pulse voltammetry (DPV) demonstrated the sensor's enhanced sensitivity, selectivity, and resolution of overlapping oxidation peaks, overcoming key limitations of existing methods. Practical applications in neurotransmitter monitoring and food safety were validated using actual samples, highlighting the sensor's accuracy and reliability. This study introduces a scalable and cost-effective solution for electrochemical sensing with significant potential for broader societal impact.
Introduction
The growing importance of advanced analytical techniques in health diagnostics and food safety has prompted significant efforts to develop innovative materials for electrochemical sensing. Dopamine (DPM), a neurotransmitter with a critical role in human physiology, is essential for regulating motor control, mood, and cognitive functions. Abnormal DPM levels have been linked to severe neurological conditions, including Parkinson's disease, schizophrenia, and depression.1,2 The normal concentration of dopamine varies depending on the biological fluid, species, and physiological state. Reported plasma dopamine levels in mammals typically range from 0.33 μg L−1 (≈2.15 nM), while urinary dopamine concentrations fluctuate based on factors such as metabolic activity, stress levels, and dietary intake.3 Urinary dopamine excretion has been widely used as a biomarker for neurological function and catecholamine metabolism, with concentrations influenced by physiological and environmental factors. Given that urine samples were analyzed in this study, the dopamine levels detected align with previously reported physiological values, confirming the reliability of the developed electrochemical sensor for real-world applications.1,3,4 Prolonged deviations in dopamine levels can disrupt neural communication, leading to irreversible damage to brain function and quality of life.5Similarly, salbutamol (SBT), a β2-adrenergic agonist commonly prescribed for asthma and chronic obstructive pulmonary disease (COPD), has been widely misused as a growth promoter in livestock to increase lean muscle mass.6–8 This misuse violates food safety regulations and poses significant risks to human health, including cardiovascular complications, muscle tremors, and metabolic disorders when consumed through contaminated food.9,10 Regulatory authorities, including the European Medicines Agency (EMA) and the United States Food and Drug Administration (FDA), have established maximum residue limits (MRLs) for salbutamol (SBT) in animal-derived products. The MRL in urine is set at 1 μg L−1 (≈4 nM), while in muscle tissue, the limit is 0.5 μg kg−1 (≈2 nM).6,11,12 These limits serve as critical regulatory standards to prevent the illicit use of β2-agonists in livestock production.
Conventional methods such as high-performance liquid chromatography (HPLC) and mass spectrometry have been employed to detect these compounds. However, these techniques are often criticized for being time-consuming, costly, and requiring extensive sample preparation.13–16 As a result, electrochemical sensing has gained attention for its simplicity, rapid response, and potential for simultaneous detection of analytes. The challenge, however, lies in resolving overlapping oxidation peaks of DPM and SBT, which often complicates simultaneous detection.2,17
The simultaneous electrochemical detection of dopamine (DPM) and salbutamol (SBT) using a Fe2O3–RSCD-modified glassy carbon electrode (GCE) has not been previously reported. Prior studies have primarily focused on the individual detection of these analytes using various nanomaterial-based sensors.
A range of nanomaterials has been employed for dopamine detection to enhance sensitivity and selectivity. Graphene-based materials such as graphene quantum dots (GQDs) and reduced graphene oxide (RGO) have been widely utilized due to their high conductivity and large surface area.18,19 Additionally, metal oxides such as CuSe, FeOOH/Fe2O3 and Cu@ZnO nanoparticles have been incorporated into sensor platforms to facilitate electron transfer and improve redox signal resolution.20–22
For salbutamol detection, transition metal oxides and composites such as Tb4O7/RGO, UiO-66/RGO, and WS2/activated carbon (AC) have been explored, with significant improvements in detection limits achieved via differential pulse voltammetry (DPV).13,15,23 However, these materials have typically been optimized for single-analyte detection rather than the simultaneous detection of DPM and SBT.
In contrast, integrating Fe2O3 nanoparticles with rice straw-derived carbon dots (RSCDs) in this study provides a synergistic enhancement of electrochemical properties, allowing for highly selective and sensitive dual-analyte detection. The Fe2O3 component contributes excellent electrocatalytic activity, while the RSCDs enhance conductivity and increase the available active surface area. This novel electrode design effectively resolves overlapping oxidation peaks, a key limitation in previous detection methods. Thus, this work introduces a new sensing platform that overcomes prior challenges associated with simultaneous dopamine and salbutamol detection, making it a pioneering contribution to the field of electrochemical sensing.
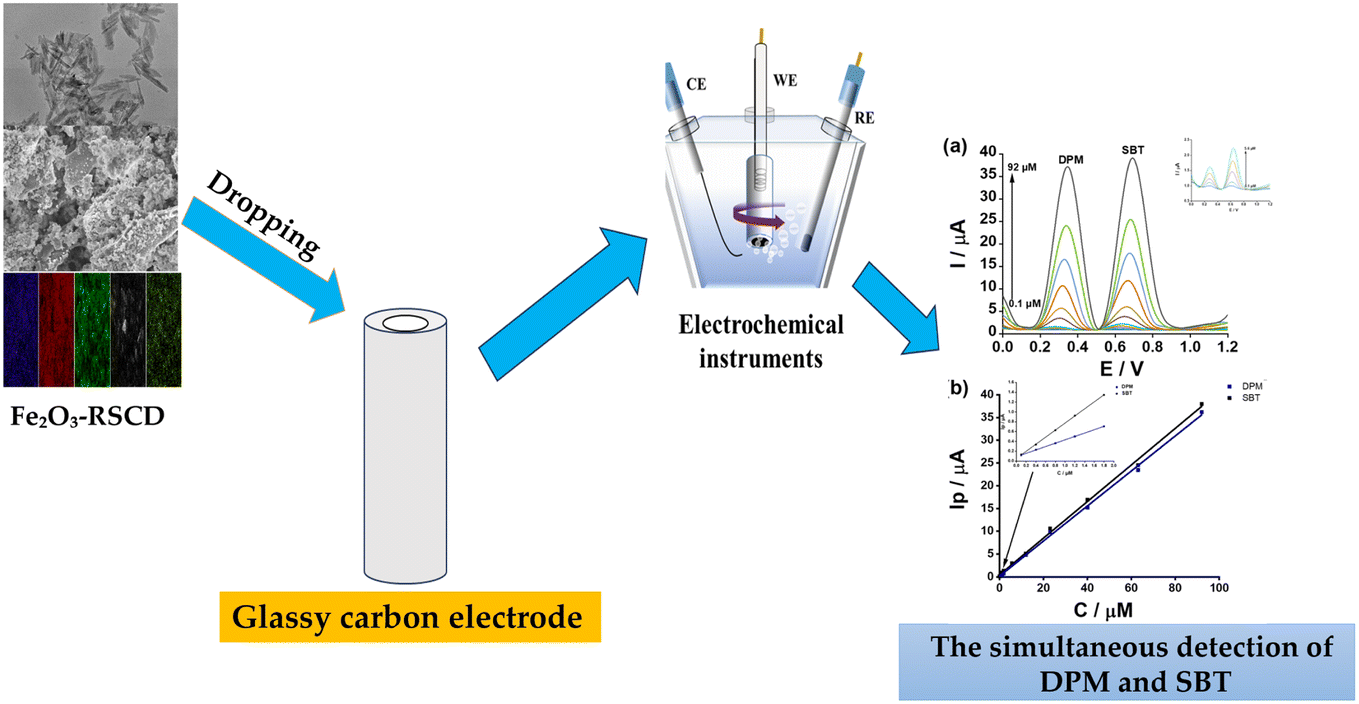
Nanomaterials have been incorporated into sensor designs to address these limitations to improve sensitivity and selectivity. Among these, Fe2O3 has been recognized for its catalytic properties, environmental friendliness, and low-cost.17,24 The utilization of rice straw-derived carbon dots (RSCDs) as electrode modifiers in electrochemical sensing remains limited, with only a few studies exploring their application in biosensing. CDs synthesized from biomass waste, including agricultural residues, have been recognized for their high conductivity, biocompatibility, and tunable surface chemistry.25,26 The integration of Fe2O3 with RSCD has been proposed to enhance electrochemical performance further. RSCD's high conductivity, biocompatibility, and chemical versatility make them an ideal complement to Fe2O3, leading to improved electron transfer kinetics and increased active surface area.18,24 In this study, a Fe2O3–RSCD composite was synthesized and applied to modify a GCE. The electrode was modified by dropping onto the GCE surface, forming a stable and homogeneous layer. Differential pulse voltammetry was employed to evaluate the electrochemical performance of the modified electrode for simultaneous detection of DPM and SBT. The composite-modified GCE exhibited enhanced sensitivity, lower detection limits, and better resolution of oxidation peaks compared to the bare electrode.2,24
This research introduces a novel approach to the simultaneous detection of DPM and SBT by combining the electrocatalytic properties of Fe2O3 and RSCD. The proposed sensor design addresses key limitations of existing methods and provides a scalable, cost-effective solution. Practical applications of this sensor include neurotransmitter monitoring for medical diagnostics and food safety assurance by detecting illegal residues of SBT. Utilizing a simple and reproducible electrode modification technique, this study advances nanomaterial-based electrochemical sensing and demonstrates the potential for broader societal impact.
Experimental
Chemicals
All employed chemicals in all tests within this study (dopamine hydrochloride, salbutamol, NaOH, HNO3, ascorbic acid, clenbuterol, uric acid, NaCl, Ca(NO3)2, (NH4)2SO4, FeCl3) bought in research-grade groups from Merck company (Germany) with the purity ≥99%. All aqueous solutions are also dissolved in deionized (DI) double-distilled water (abbreviated to DI water). A 0.20 M Britton–Robison buffer solution/BRBS buffer (pH = 7.0) was prepared using 0.5 M boric acid, 0.5 M acetic acid (99%) and 0.5 M phosphoric acid (99%).Instruments
The X-ray diffraction (XRD) patterns of RSCD were meticulously obtained using a D8 Advance Bruker diffractometer fitted with a Cu-Kα radiation source operating at a wavelength of 1.5406 Å. Meanwhile, infrared spectra covering the range from 4000 cm−1 to 400 cm−1 were recorded using a Fourier mid-IR InfraLUM FT-08 instrument provided by Horiba (Japan). The material's morphology was examined in detail through Raman microscopy conducted on the XploRA Plus system, also by Horiba. For elemental composition analysis, energy-dispersive X-ray spectroscopy (EDX) was performed on the Horiba EMAX ENERGY EX-400 analyzer (Japan). High-resolution transmission electron microscopy (HR-TEM) analysis was conducted using a JEM2100 instrument manufactured by Jeol (Japan). Additionally, ultraviolet-visible (UV-Vis) spectra were collected with the UV-2600 spectrophotometer from Shimadzu.Electrochemical investigations were performed using the CPA-HH5 computerized polarography analyzer, designed and produced in Vietnam. In these experiments, a conventional three-electrode setup was employed, comprising an Ag/AgCl electrode saturated with 3.0 M KCl as the reference electrode, a platinum wire serving as the auxiliary electrode, and the working electrode, which was either a bare glassy carbon electrode (GCE) with a diameter of 2.8 mm or an RSCD-modified GCE. EIS was recorded on an Autolab PGSTAT302N instrument.
The synthesis of Fe2O3–RSCD
First, RSCD was synthesized by producing the following: rice straw was collected from a local agricultural area approximately 20 km from Hue City, Vietnam. The rice straw was treated using a hydrothermal method. Initially, the straw was washed with DI water, dried at 80 °C, and finely cut. A specific amount of the prepared rice straw was immersed in DI water and stirred to create a uniform dispersion. This mixture was then transferred into a digestion vessel and subjected to hydrothermal treatment at an elevated temperature in a drying oven for 24 hours. After cooling, the reaction mixture was centrifuged to remove solid residues, resulting in a light yellow solution identified as RSCD.26The synthesized RSCD was utilized as the carbon source for the preparation of Fe2O3–RSCD composites. The RSCD solution was ultrasonically dispersed in DI water to form a homogeneous suspension. Subsequently, iron precursors (FeSO4·7H2O and CH3COONa) stabilizing agents were added to the solution, and the mixture was stirred vigorously at room temperature for an extended period to ensure complete interaction between the carbon and iron species. The obtained product was washed multiple times with DI water and ethanol to remove impurities and dried under controlled conditions to acquire the desired Fe2O3–RSCD composite.27 To find the suitable composite properties, the ratios of iron to carbon were varied systematically to achieve Fe![[thin space (1/6-em)]](https://www.rsc.org/images/entities/char_2009.gif) :C molar ratios of 1:1, 3:1, and 5:1. The resulting composites were designated as 1Fe2O3–RSCD, 3Fe2O3–RSCD, and 5Fe2O3–RSCD, respectively. These ratios were employed to evaluate the effect of iron loading on the composites' structural, morphological, and electrochemical properties (Scheme 1).
:C molar ratios of 1:1, 3:1, and 5:1. The resulting composites were designated as 1Fe2O3–RSCD, 3Fe2O3–RSCD, and 5Fe2O3–RSCD, respectively. These ratios were employed to evaluate the effect of iron loading on the composites' structural, morphological, and electrochemical properties (Scheme 1).
 | ||
| Scheme 1 The synthesis of Fe2O3–RSCD.27 | ||
Preparation of the working electrode (Fe2O3–RSCD/GCE)
The surface of GCE was polished using Al2O3 powder (particle size 0.05 μm), followed by cleaning in a nitric acid solution 1:2 (v/v) for several hours and rinsing with DI water twice. Further surface cleaning was achieved through ultrasonic waves in an ethanol–water mixture (1:1, v/v). The GCE surface was dried using heat from a tungsten filament lamp (40 °C).
Ten milligrams of Fe2O3–RSCD were poured into 10 mL of DI water and sonicated for approximately 24 hours. Subsequently, 50 μL of 1% Nafion solution (in ethanol) was added to 1.0 mL of 1 mg mL−1 Fe2O3–RSCD, resulting in a homogeneous solution (abbreviated to solution A). Nafion served as a binding agent to modify the GCE surface.28 The GCE was modified by dropping 10 μL of solution A onto its surface and then drying it at room temperature (Scheme 2). The modified electrode, Fe2O3–RSCD/GCE, prepared through modification (Scheme 3), was used as a working electrode for further experiments to detect DPM and SBT.
 | ||
| Scheme 2 Fabrication of Fe2O3–RSCD-modified GCE for electrochemical analysis. | ||
 | ||
| Scheme 3 Flow chart of preparing Fe2O3–RSCD/GCE. | ||
The preparation of actual samples
Five animal urine samples were obtained from three Hue City, Central Vietnam slaughterhouses (Ngoc Anh village, Lai The village, and Chiet Bi village), with two samples collected from each slaughterhouse. To prepare the non-spiked (or blank) sample, 1 mL of the urine sample was combined with 2 mL of BRBS, and DI water was added to achieve a final volume of 10 mL. The resulting solution was centrifuged and filtrated using a membrane with a pore diameter of 0.46 μm.For the spiked sample preparation, 1 mL of the urine sample was fortified with DPM and SBT at a concentration of 20 μM. This mixture was combined with 2 mL of BRBS buffer solution, and DI water was added to reach a final volume of 10 mL. The concentrations of DPM and SBT in the final test solution were 20 μM for each compound. The prepared solution was centrifuged and filtered using the same membrane as the non-spiked sample.
Detection of DPM and SBT in both non-spiked and spiked test solutions was carried out using the proposed DPV method.
The employed techniques
:1 ratio applied.29
Experimental conditions
Results and discussion
The characterization of modification materials
Fig. 1 illustrates the comprehensive characterization of RSCD, Fe2O3, and three synthesized composites (1Fe2O3–RSCD, 3Fe2O3–RSCD, and 5Fe2O3–RSCD) using XRD, Raman, UV-Vis, PL, and FTIR spectra. Each analytical technique contributes to a deeper understanding of the materials' structural, optical, and chemical properties, enabling a logical evaluation of the most suitable composite for the desired application. | ||
| Fig. 1 (a) The XRD pattern of RSCD, Fe2O3, 3 synthesized composites; (b) the Raman spectra of RSCD, Fe2O3 and 3 synthesized composites; (c) the UV-Vis spectra of RSCD and the 3 synthesized composites; (d) the PL spectra of RSCD and the 3 synthesized composites (inset: the PL spectra of three composites); (e) the FTIR spectra of Fe2O3, RSCD and the 3 synthesized composites. | ||
The X-ray diffraction (XRD) patterns (Fig. 1a) confirm the crystalline structure of Fe2O3, with diffraction peaks observed at 2θ values corresponding to the (012), (104), (110), and (116) planes, in agreement with JCPDS card no. 33-0664.30–32 The broad and weak diffuse signal in the RSCD sample indicates its predominantly amorphous carbon structure. In the composite materials, the diffraction peaks of Fe2O3 are retained, confirming the preservation of its crystalline nature.33,34 Additionally, the emergence of minor peaks associated with RSCD suggests successful integration of the carbon structure.
Notably, the 5Fe2O3–RSCD composite exhibits sharper diffraction peaks with enhanced intensity (I), particularly at the (012) and (104) planes, corresponding to I012 = 8.02 and I104 = 5.42 (compared to those of 1Fe2O3–RSCD (I012 = 6.81, I104 = 4.13) and 3Fe2O3–RSCD (I012 = 7.25, I104 = 5.25)), reflecting increased crystallinity and a well-dispersed iron oxide phase. Such enhanced crystallinity is advantageous for electrochemical applications, as it can improve both the stability of the material and the efficiency of charge transfer processes. These observations are consistent with those reported in recent literature, further validating the composites' structural integrity and potential functional properties.17,24
Raman spectra (Fig. 1b) reveal D- and G-bands for RSCD, characteristic of defected and graphitic carbon structures.35 The intensity ratio (ID/IG) increases systematically from 1Fe2O3–RSCD to 5Fe2O3–RSCD (corresponding to 0.84, 0.86 and 0.90), indicating a growing degree of defects with higher Fe loading. These defects create active sites that are advantageous for redox reactions in electrochemical applications. Additionally, the presence of Fe2O3 is confirmed by distinct vibrational modes near 225 cm−1 and 497 cm−1, corresponding to Fe–O stretching and bending vibrations. These characteristic peaks, which have now been explicitly included in the analysis, are most pronounced in 5Fe2O3–RSCD, further verifying the successful incorporation of Fe2O3 into the composite matrix, which is most pronounced in 5Fe2O3–RSCD.36,37 Similar results have been described in the latest reports.17,24 This indicates robust interactions between the Fe2O3 phase and the carbon matrix, enhancing electron mobility. The robust interactions refer to the strong chemical and physical connections between the Fe2O3 nanoparticles and the rice straw-derived carbon dots (RSCD) matrix within the composite material. These interactions are crucial because they facilitate efficient charge transfer, essential for electrochemical sensing applications. Iron oxide (Fe2O3) nanoparticles, known for their electrocatalytic properties, interact effectively with the carbon matrix due to the unique surface characteristics of the RSCDs. The RSCDs, derived from rice straw, provide a highly conductive framework with a high surface area that supports electron transport and the effective immobilization of analytes. The carbon matrix not only serves as a conductive support but also enhances the overall structural stability of the composite. The robust interaction between the Fe2O3 phase and the carbon matrix leads to the formation of a synergistic system that boosts electron mobility in several ways. First, the conductive RSCDs facilitate the fast transfer of electrons between the Fe2O3 particles and the working electrode, minimizing energy losses. Second, the surface functional groups present on the RSCDs enhance the interaction with Fe2O3, contributing to a more efficient electron transfer. These interactions also play a role in reducing the recombination of charge carriers, further enhancing electron mobility.38,39
Fig. 1c presents the absorption spectra of RSCD, 1Fe2O3–RSCD, 3Fe2O3–RSCD, and 5Fe2O3–RSCD composites across the 200–800 nm wavelength range. Strong absorption in the ultraviolet and visible regions is observed, with intensity increasing as Fe content rises. This increase is attributed to the carbon dots (RSCD), known for their light-harvesting efficiency. A peak around 300 nm, typical of π–π* transitions in RSCD, is detected.40,41 Enhanced absorption in the visible region (400–600 nm) is caused by incorporating Fe2O3, indicating successful composite formation.42,43 This result aligns with recent studies on carbon dot-metal oxide composites.17,44
In Fig. 1d, the PL spectra reveal the 400–600 nm emission characteristics. For RSCD, a relatively high emission intensity is observed, indicating efficient recombination of photo-excited electrons and holes. As Fe2O3 is introduced into the composites, significant quenching of PL intensity is observed for 5Fe2O3–RSCD compared to 1Fe2O3–RSCD and 3Fe2O3–RSCD. The quenching is caused by charge separation facilitated by carbon dots and further enhanced by Fe2O3, suppressing electron–hole recombination. This behavior confirms strong interactions between carbon dots and Fe2O3, improving charge transfer properties. These findings are consistent with recent publications.45
FTIR spectra (Fig. 1e) identify functional groups in RSCD, including O–H (3200–3400 cm−1), C![[double bond, length as m-dash]](https://www.rsc.org/images/entities/char_e001.gif) O (1700 cm−1), and C–O–C (1100 cm−1).46–48 The incorporation of Fe introduces Fe–O vibrational modes (confirming the presence of Fe2O3) at 550–600 cm−1, which are most prominent in 5Fe2O3–RSCD. These Fe–O stretching bands align with previously reported spectra for Fe2O3, further validating the successful integration of iron oxide within the composite structure.49 This indicates and confirms a strong interaction between the iron oxide phase and the carbon surface, contributing to the structural stability of the composite.50 The preserved Hoxygen-containing groups on RSCD further enhance their hydrophilicity and potential for effective electrochemical surface reactions. Similar outcomes have been described in the latest scientific literature.17,24 Through systematic characterization, 5Fe2O3–RSCD demonstrates the most suitable balance of electrochemical applications' structural, optical, and chemical properties.
O (1700 cm−1), and C–O–C (1100 cm−1).46–48 The incorporation of Fe introduces Fe–O vibrational modes (confirming the presence of Fe2O3) at 550–600 cm−1, which are most prominent in 5Fe2O3–RSCD. These Fe–O stretching bands align with previously reported spectra for Fe2O3, further validating the successful integration of iron oxide within the composite structure.49 This indicates and confirms a strong interaction between the iron oxide phase and the carbon surface, contributing to the structural stability of the composite.50 The preserved Hoxygen-containing groups on RSCD further enhance their hydrophilicity and potential for effective electrochemical surface reactions. Similar outcomes have been described in the latest scientific literature.17,24 Through systematic characterization, 5Fe2O3–RSCD demonstrates the most suitable balance of electrochemical applications' structural, optical, and chemical properties.
Fig. 2 provides a detailed investigation of the morphological characteristics of Fe2O3-powder, RSCD, and the 5Fe2O3–RSCD composite using SEM and TEM imaging. These analyses are pivotal for understanding the structural and surface properties directly influencing electrochemical performance.
 | ||
| Fig. 2 The SEM images of (a) Fe2O3-powder (inset: the TEM image of Fe2O3), (b) 5Fe2O3–RSCD; The HRTEM of (c and d) RSCD, (e and f) 5Fe2O3–RSCD. | ||
The SEM images (Fig. 2a and b) reveal the distinct morphologies of Fe2O3-powder and 5Fe2O3–RSCD. Fe2O3-powder exhibits a particle-like structure with well-defined edges, reflecting the crystalline nature of Fe2O3. In contrast, the 5Fe2O3–RSCD composite presents a heterogeneous and porous morphology with interconnected carbon matrices decorated by Fe2O3 particles. This porous architecture increases the specific surface area, providing more active sites for electrochemical reactions. Additionally, the uniform dispersion of Fe2O3 particles ensures better contact with the carbon matrix, enhancing electron transport and ionic diffusion during electrochemical processes. The findings are noted to align with those reported in contemporary studies.17,24,51,52 The elemental composition of the 5Fe2O3–RSCD composite is further confirmed by the EDX spectrum (Fig. 3), which demonstrates a homogeneous distribution of carbon (C), oxygen (O), iron (Fe), sulfur (S), and nitrogen (N). The dominant peaks corresponding to carbon and oxygen highlight the carbon-rich and oxygen-containing groups derived from the RSCD base. The pronounced Fe peaks confirm the successful incorporation of Fe2O3 into the composite. Minor contributions from sulfur and nitrogen, originating from the synthesis process or raw materials, indicate the retention of heteroatoms, which are known to enhance electrochemical activity by providing additional active sites and facilitating electron transfer. The absence of impurities in the spectrum demonstrates the high purity of the composite. These observations are found to be similar to those published in recent literature.22,53 The elemental mapping images (Fig. 3b–f) illustrate the spatial distribution of S, Fe, O, C, and N in 5Fe2O3–RSCD. The carbon and oxygen elements are distributed uniformly throughout the matrix, reflecting the homogeneous dispersion of RSCD. The Fe mapping reveals evenly distributed iron species without noticeable agglomeration, ensuring consistent interaction between Fe2O3 and the carbon framework. Nitrogen and sulfur atoms are observed in smaller concentrations but show a uniform distribution, further supporting their effective integration into the structure. This homogeneous distribution of elements is advantageous for maintaining consistent electrochemical performance across the electrode surface. The outcomes are shown to match those reported in recent publications.22,53
 | ||
| Fig. 3 (a) The EDX spectrum of 5Fe2O3–RSCD (inset: EDX spectra of (i) 1Fe2O3–RSCD, (ii) 3Fe2O3–RSCD, (iii) Fe2O3 (iv) Elemental composition of Fe2O3 and Fe2O3–RSCD composites); (b–f) element mapping images of S, Fe, O, C, and N. | ||
The EDX spectra for 1Fe2O3–RSCD, 3Fe2O3–RSCD, and pure Fe2O3 (i, ii, and iii) are provided in the insets of Fig. 3a, which further elucidate the variations in elemental composition as the iron content in the composites increases. These spectra confirm that the iron phase remains consistent and is effectively integrated into the composite structure, a crucial factor for preserving both the structural integrity and electrochemical performance of the material. Additionally, the fourth inset (iv) emphasizes the elemental composition of both Fe2O3 and Fe2O3–RSCD composites, verifying the successful incorporation of iron oxide into the carbon matrix.
The TEM images (Fig. 2c and d) of RSCD confirm the amorphous structure of the carbon dots, appearing as thin, irregular sheets with negligible lattice fringes.54,55 When modified to form 5Fe2O3–RSCD (Fig. 2e and f), clear lattice fringes corresponding to Fe2O3 are observed, confirming successful integration. The Fe2O3 nanoparticles are well-dispersed across the carbon matrix, avoiding agglomeration and preserving the composite's structural integrity. This uniform dispersion facilitates efficient charge transfer pathways and improves the material's stability under electrochemical conditions. The SEM and TEM analyses validate that the morphological features of 5Fe2O3–RSCD are tailored for electrochemical applications. Comparable results have been mentioned in other recent works.17,24
The simultaneous electrochemical determination of dopamine and salbutamol by 5Fe2O3–RSCD/GCE
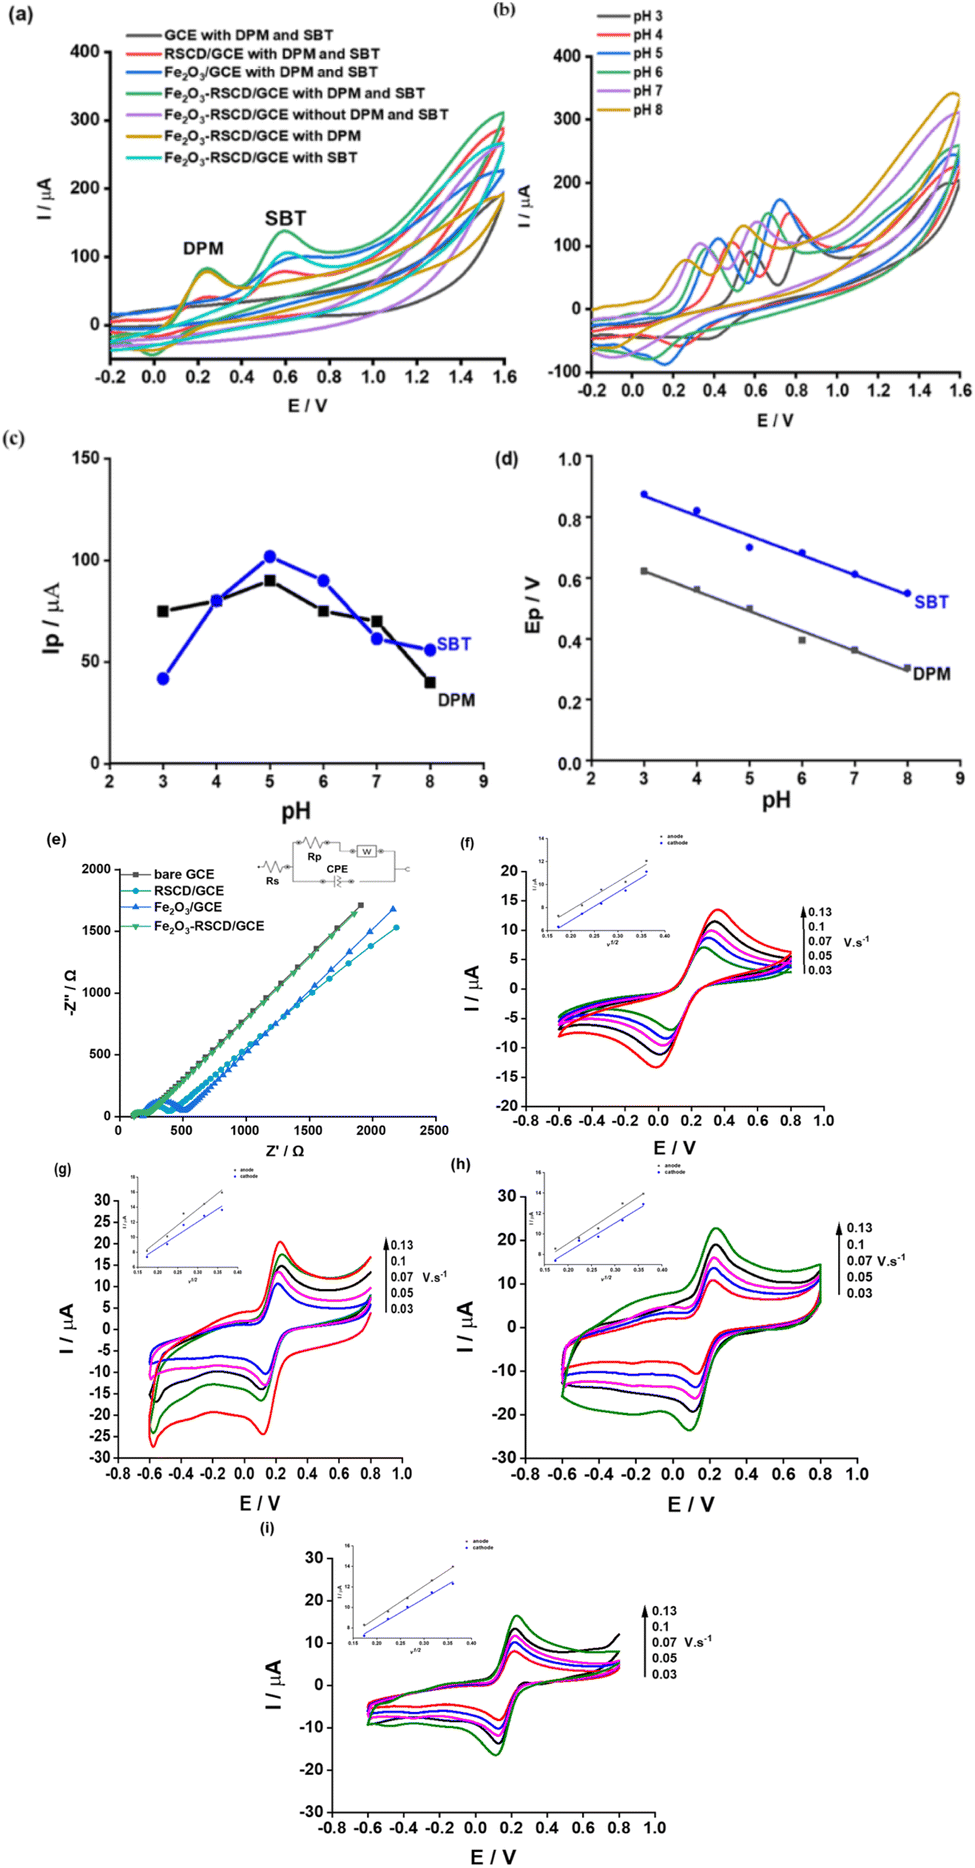 | ||
| Fig. 4 (a) The CVs for DPM and SBT with various electrodes, (b) the CV signals of DPM and SBT at various pH values, (c) the plot between Ep and pH, (d) the plot for the relationship of Ipvs. pH, (e) Nyquist plots recorded from electrochemical impedance spectroscopy of 0.5 mM [Fe(CN)6]3−/4− at a frequency from 100 to 10 MHz recorded on bare GCE, RSCD/GCE, Fe2O3/GCE and Fe2O3–RSCD/GCE in 0.2 M BRBS buffer solution (the inset presents the equivalent circuit model of the electrode/electrolytes), (f–i) the CVs using bare GCE, RSCD, Fe2O3, Fe2O3–RSCD in 1.0 mM [Fe(CN)6]3− solution (0.1 M KCl) (inset: the linear plot between v1/2vs. I). | ||
To distinguish the oxidation peaks of DPM and SBT in Fig. 4a, additional electrochemical investigations were conducted. The individual oxidation behaviors of DPM and SBT were examined by recording CV curves for separate solutions containing only DPM or SBT under identical experimental conditions. It was observed that in the presence of only DPM, a distinct oxidation peak emerged at approximately +0.24 V, confirming its electrochemical oxidation potential.2,56 Likewise, when only SBT was tested, a single oxidation peak appeared at +0.60 V.57,58 Furthermore, the simultaneous presence of both DPM and SBT resulted in two clearly resolved peaks at the same potentials, thereby verifying their individual contributions.
Fig. 4b depicts the impact of buffer pH on the electrochemical peaks. The pH solution significantly influences the electrochemical responses, illustrating a considerable dependence of the electrochemical oxidation process on the number of protons involved. As the pH increases, the Ep shows a linear variation in the range of pH = 3–8 (Fig. 4b). The regression equations corresponding to these observations are provided below.
| Ep.DPM (V) = (−0.065 ± 0.004)pH + (0.818 ± 0.024); R2 = 0.985 | (1) |
| Ep.SBT (V) = (−0.065 ± 0.005)pH + (1.062 ± 0.030); R2 = 0.974 | (2) |
Utilizing the Nernst equation for temperature 298 K (means 25 °C), the obtained plots between the Ep and the pH of a redox–conjugate pair (abbreviated as Ox and R) can be elucidated as follows:
 | (3) |
The slope values of the Epversus pH plot demonstrate values of −0.065 and −0.065, respectively for DPM and SBT, closely approximating the Nernstian value (−0.0592) (Fig. 4c). This alignment responds to an electron-to-proton ratio (n/p) of 1, expressing that the oxidation processes of DPM and SBT on the 5Fe2O3–RSCD/GCE involve an equivalent number of electron and proton, similar to some recent reports.16,21,57,59,60 Notably, for DPM and SBT, the peak current rises within the pH scope of 3.0 to 5.0, reaching its highest value at pH 5.0, followed by a sharp decline with further increases in pH. Consequently, pH 5.0 is selected for subsequent experiments (Fig. 4d). The proposed electrochemical oxidation mechanism of DPM and SBT, predicated upon using the 5Fe2O3–RSCD/GCE, is elucidated in Scheme 4 and is consistent with similar mechanisms proposed in the most recent publications as well as a recent study that identified salbutamol with a comparable mechanism.13,18,20,21,23,58
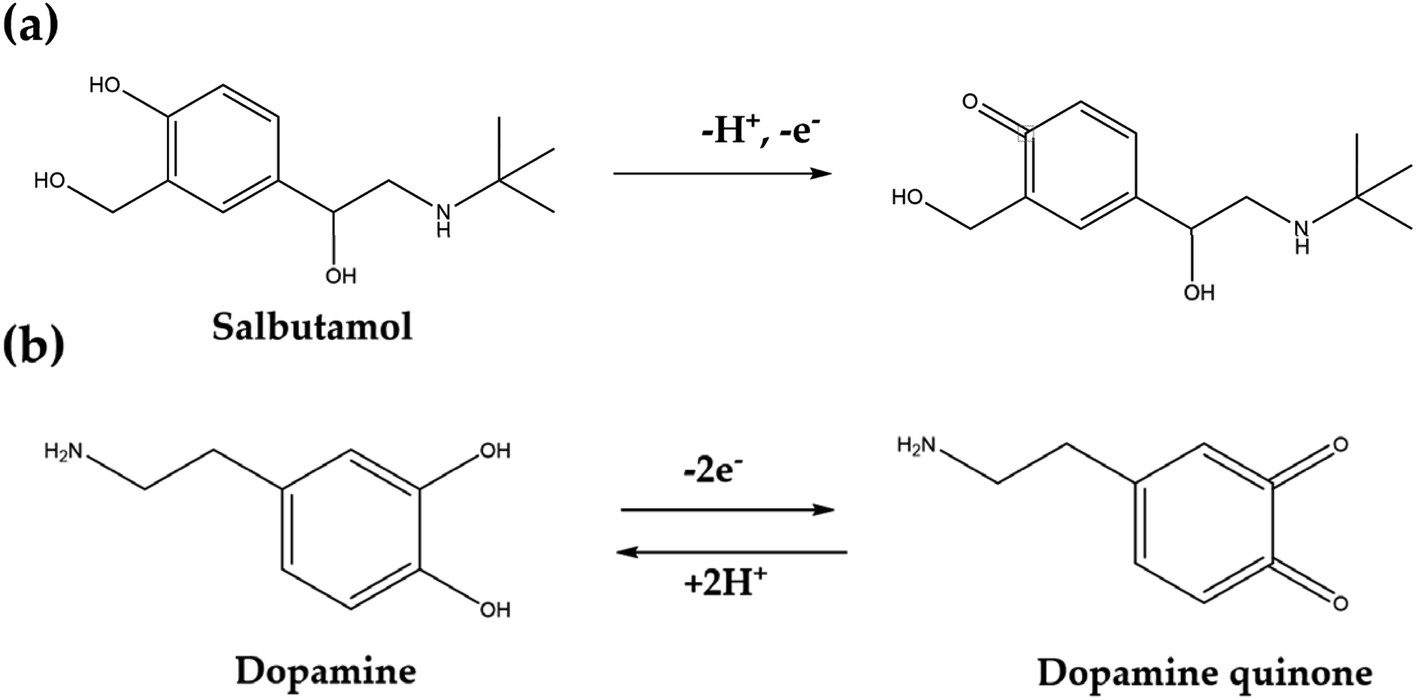 | ||
| Scheme 4 The proposed mechanism of oxidation procedures of DPM and SBT.13,18,20,21,23,58 | ||
Electrochemical impedance spectroscopy (EIS) has been conducted to evaluate charge transfer resistance (Rct) and electrode conductivity. In Fig. 4e, Nyquist plots reveal variations in semicircle diameters, indicating differences in charge transfer kinetics. The extracted Rct values for GCE, RSCD/GCE, Fe2O3/GCE, and Fe2O3–RSCD/GCE are 0.086 kΩ, 0.206 kΩ, 0.294 kΩ, and 0.111 kΩ, respectively. The lower Rct observed for Fe2O3–RSCD/GCE suggests enhanced charge transfer efficiency, likely due to the synergistic effect of Fe2O3 and RSCD, which facilitates electron mobility and reduces interfacial resistance.61 This trend aligns with the previous report on Fe2O3-carbon composites, where improved conductivity has been attributed to increased active surface area and optimized charge transport pathways.61 The observed reduction in Rct further supports the role of Fe2O3–RSCD in enhancing electrode performance, reinforcing its potential for electrochemical sensing applications.
The cyclic voltammetry (CV) method was used to determine the effective surface area of the electrode by recording the peak current signal of a solution containing 1 mM K3[Fe(CN)6]/K4[Fe(CN)6] at varying scan rates (Fig. 4f–i). The relationship between the square root of the scan rate and the peak current intensity follows the Randles–Sevcik equation62 as follows:
| Ipa = (2.69 × 10⁵)n3/2AD01/2Cυ1/2 |
The values of A are found to be 0.048 cm2 for bare GCE and 0.082, 0.059, and 0.060 cm2, respectively, for RSCD/GCE, Fe2O3/GCE, and Fe2O3–RSCD/GCE. The surface area of Fe2O3–RSCD/GCE is notably larger than that of the bare GCE, demonstrating the effectiveness of the Fe2O3–RSCD composite in increasing the electrode's active surface area. This increase in surface area provides more active sites for electrochemical reactions, thereby improving the interaction between the electrode and the analytes (DPM and SBT).
Differential pulse voltammetry (DPV) responses to the DPM and SBT solution with working electrode 5Fe2O3–RSCD/GCE
 | ||
| Fig. 5 The DPV voltammograms at (a) CDPM = 0.1 μM–92 μM and CSBT = 40 μM; (b) CDPM = 40 μM and CSBT = 0.1 μM–92 μM; (c) the linear plot of Ipvs. CDPM, (d) the linear plot of Ipversus CSBT (test conditions: potential scan range 0 V–+1.2 V, pulse amplitude: 0.06 V, scan rate: 20 mV s−1). | ||
The corresponding linear graphs are illustrated in Fig. 5c and d. The respective linear equations are as follows:
| Ip,DPM (μA) = (0.079 ± 0.002) + (0.356 ± 0.009)·CDPM (μM); R2 = 0.994 | (4) |
| Ip,SBT (μA) = (0.177 ± 0.024) + (0.410 ± 0.022)·CSBT (μM); R2 = 0.987 | (5) |
From the above equations, the acquired LODs (3σ formula) were 0.06 μM and 0.07 μM for DPM and SBT, respectively.
Fig. 6a depicts the DPV curves obtained concurrently upon introducing DPM (+0.27 V) and SBT (+0.62 V) within the concentration spectrum spanning 0.1 μM–92 μM. Fig. 6b expresses the graphical representations of Ip,DPM, and Ip,SBT, concerning the varying concentrations of DPM and SBT. The corresponding linear regression equations are delineated therein.
| Ip,DPM (μA) = (0.090 ± 0.002) + (0.343 ± 0.002) CDPM (μM); R2 = 0.999 | (6) |
| Ip,SBT (μA) = (0.056 ± 0.005) + (0.718 ± 0.005) CSBT (μM); R2 = 0.999 | (7) |
 | ||
| Fig. 6 (a) The DPV curves of DPM and SBT at the increasing contents: 0.1, 0.4, 0.8, 1.2, 1.8, 5.6, 12, 23, 40, 63 and 92 μM, (b) the linear relationship between Ipversus CDPM (μM) or CSBT (μM) (test conditions: potential scan range 0 V–+1.2 V, pulse amplitude: 0.06 V, scan rate: 20 mV s−1). | ||
The determined LOD for DPM and SBT orderly are 0.02 μM and 0.03 μM (3σ formula), while the corresponding LOQ values for DPM and SBT are 0.06 μM and 0.09 μM, respectively. The sensitivity of the sensor for DPM and SBT is 0.343 μA μM−1 and 0.718 μA μM−1, indicating its high responsiveness to both analytes within the concentration range of 0.1 μM to 92 μM. The LOD of DPM and SBT in both simultaneous and individual investigations are nearly identical, suggesting that the oxidation procedure of these compounds at the 5Fe2O3–RSCD/GCE occurs independently with no cross-interference. Consequently, the 5Fe2O3–RSCD/GCE electrode demonstrates the potential to analyze DPM and SBT concurrently. Notably, this working electrode exhibits a linear range and LOD for DPM and SBT that compare favorably with those documented in the reference (Table 1).
| No. | Materials | Analyte | Method | LOD (μM) | Linear range (μM) | Ref. |
|---|---|---|---|---|---|---|
| 1 | UiO-66/RGO | SBT | DPV | 0.84 | 1–160 | 15 |
| 2 | WS2/AC | SBT | DPV | 0.52 | 1–210 | 13 |
| 3 | Tb4O7/RGO | SBT | DPV | 0.02 | 1–720 | 23 |
| 4 | N-Gs | DPM | DPV | 0.03 | 0.1–700 | 18 |
| 5 | GQD-MWCNTs | DPM | DPV | 0.10 | 0.25–250 | 2 |
| 6 | Cu–ZnO | DPM | DPV | 0.06 | 0.1–20 | 21 |
| 7 | 5Fe2O3–RSCDs | SBT | DPV | 0.02 | 0.1–92 | This work |
| DPM | 0.03 |
 | ||
| Fig. 7 The DPV curves of DPM and SBT were obtained at varying concentrations, (a) 0.1 μM, (b) 1.8 μM, and (c) 40 μM; (d) the DPV responses of DPM and SBT at the four-time period of modifying 5Fe2O3–RSCD onto one bare GCE; (e) peak current (Ip) variations of dopamine (DPM) and salbutamol (SBT) across four successive modifications of the 5Fe2O3–RSCD/GCE electrode. | ||
The experiment evaluated the reproducibility of 1.0 μM DPM and 1.0 μM SBT concentrations in a 0.2 M BRBS buffer solution at pH 5.0. The DPV profiles of DPM and SBT were captured using 5Fe2O3–RSCD modified on one certain GCE platform and prepared through four iterations of modification. The acquired 5Fe2O3–RSD of DPM and SBT peak responses orderly listed 4.1% and 4.2% across four distinct 5Fe2O3–RSCD/GCE setups, indicating excellent reproducibility of the proposed electrode, as depicted in Fig. 7d. To assess reproducibility, the 5Fe2O3–RSCD-modified GCE was fabricated four times under identical conditions, and the peak currents (Ip) of DPM and SBT were recorded. As shown in Fig. 7e, the Ip values remained stable with minor variations, confirming the consistency of the modification process. The observed fluctuations in peak currents were within acceptable limits, likely due to slight differences in film uniformity or nanomaterial distribution. However, the overall stability indicates that reproducibility is well-maintained. These findings align with the RSD values in Fig. 7d, which remained below 5%, further verifying electrode consistency. The ability to sustain stable electrochemical responses across multiple modifications ensures the sensor's reliability for repeated use. This reproducibility strengthens its potential for practical applications in the simultaneous electrochemical detection of DPM and SBT.
Interferents
The influence of potential interferents on the detection of DPM and SBT was evaluated under controlled conditions to ensure the accuracy and reliability of the proposed electrochemical method. The relative error (RE, %) was utilized as a measure of interference, with values within ±5% considered negligible.65,66Organic and inorganic compounds commonly present in analytical or biological matrices were tested, including ascorbic acid, clenbuterol, uric acid, sodium chloride (NaCl), ferric chloride (FeCl3), calcium nitrate [Ca(NO3)2], and ammonium sulfate [(NH4)2SO4]. These interferents were introduced at varying molar ratios relative to DPM and SBT, with the concentrations of DPM and SBT maintained at 0.1 μM in 0.2 M Britton–Robinson buffer (pH 5.0).
Table 2 shows that ascorbic acid, at a molar ratio of 190 relative to DPM, caused an RE of 3.7%, while at a molar ratio of 10 relative to SBT, the RE was 2.5%. Clenbuterol demonstrated a slightly lower interference, with RE values of 2.9% and −1.3% for DPM and SBT, respectively, at molar ratios of 190 and 100. Uric acid exhibited minimal impact, with RE values of −0.2% for DPM and 3.5% for SBT at molar ratios of 10 and 100, respectively.
| Interferent | Interferent–DPM molar ratio | I p,DPM ± SD (n = 3) | RE (%) | Interferent–SBT molar ratio | I p,SBT ± SD (n = 3) | RE (%) |
|---|---|---|---|---|---|---|
| a The mean value. | ||||||
| Ascorbic acid | 190 | 0.0758 ± 0.0004 | 3.7 | 10 | 0.1046 ± 0.0018 | 2.5 |
| Clenbuterol | 190 | 0.0760 ± 0.0020 | 2.9 | 100 | 0.1069 ± 0.0016 | −1.3 |
| Uric acid | 10 | 0.0778 ± 0.0018 | −0.2 | 100 | 0.1059 ± 0.0013 | 3.5 |
| NaCl | 40 | 0.0738 ± 0.0020 | 0.1 | 100 | 0.1076 ± 0.0014 | −2.2 |
| FeCl3 | 40 | 0.0751 ± 0.0004 | 2.6 | 10 | 0.1061 ± 0.0002 | −4.1 |
| Ca(NO3)2 | 40 | 0.0739 ± 0.0005 | 1.2 | 310 | 0.1011 ± 0.0007 | −3.0 |
| (NH4)2SO4 | 40 | 0.0769 ± 0.0010 | 4.3 | 190 | 0.1051 ± 0.0006 | 2.4 |
The effects of inorganic salts were also assessed. Sodium chloride caused negligible interference, with RE values of 0.1% and −2.2% for DPM and SBT, respectively, at a molar ratio of 40. Similarly, ferric chloride and calcium nitrate demonstrated acceptable interference levels, with RE values of 2.6% and 1.2% for DPM and −4.1% and −3.0% for SBT, respectively, at identical molar ratios. Ammonium sulfate showed the highest RE value for DPM at 4.3% but remained within tolerable limits, with an RE of 2.4% for SBT.
These findings confirm that the developed method is robust and selective for detecting DPM and SBT, even in the presence of significant concentrations of common interferents. This reinforces the method's applicability for practical sample analysis in complex matrices.
Actual sample analysis
DPM and SBT concentrations were determined in animal purine derivatives using the DPV technique, complemented by the conventional standard addition method. In Table 3, the recovery results (rev, %) for both the unaltered animal urine and the spiked samples are meticulously presented. Recovery rates ranging from 96% to 105% have been achieved, underscoring the precision and reliability of the DPV technique when applied to urine samples. A comparative analysis was also performed, incorporating HPLC tests for the practical samples. To evaluate potential differences between the DPV and HPLC methods, a paired t-test analysis was rigorously carried out. With α = 0.05, the obtained performances indicate no statistically significant difference in concentration values between the methods, DPM: t(4) = 0.554, p = 0.609 (>0.05), SBT: t(4) = 1.159, p = 0.311 (>0.05).| Sample | Analyte | DPV | HPLC | ||||
|---|---|---|---|---|---|---|---|
| Original content (μM) | Added (μM) | Found (μM) | Added (μM) | Found (μM) | Rev (%) | ||
| a Not applicable. b Average ± standard deviation (n = 3). | |||||||
| 1 | DPM | —a | 20 | 19.5 ± 1.1b | 20 | 19.2 ± 0.3 | 96.0 |
| SBT | — | 20 | 19.9 ± 0.4 | 20 | 20.7 ± 0.9 | 103.5 | |
| 2 | DPM | — | 20 | 19.8 ± 0.8 | 20 | 19.5 ± 0.9 | 97.5 |
| SBT | — | 20 | 19.2 ± 0.9 | 20 | 20.8 ± 0.7 | 104.0 | |
| 3 | DPM | — | 20 | 19.8 ± 0.5 | 20 | 19.4 ± 1.1 | 97.0 |
| SBT | — | 20 | 19.3 ± 0.7 | 20 | 20.2 ± 0.7 | 101.0 | |
| 4 | DPM | — | 20 | 19.7 ± 0.3 | 20 | 20.4 ± 1.0 | 102.0 |
| SBT | — | 20 | 19.3 ± 1.1 | 20 | 19.7 ± 0.5 | 98.5 | |
| 5 | DPM | — | 20 | 19.8 ± 0.4 | 20 | 21.0 ± 0.6 | 105.0 |
| SBT | — | 20 | 20.4 ± 0.7 | 20 | 19.3 ± 0.8 | 96.5 | |
Conclusions
The study successfully synthesized and applied a Fe2O3–RSCD composite to modify glassy carbon electrodes, enabling simultaneous detection of dopamine and salbutamol with exceptional performance. Detection limits of 0.02 μM for dopamine and 0.03 μM for salbutamol, along with a linear range of 0.1–92 μM, highlight the sensor's sensitivity and versatility. The robust repeatability, reproducibility, and resistance to interferents were validated in real-sample analysis, confirming its practical applicability. This nanomaterial-based sensor offers a reliable, simple, and scalable alternative to conventional techniques, paving the way for medical diagnostics and food safety monitoring advancements. Further optimization may expand its utility in broader analytical contexts.The ability to simultaneously detect dopamine and salbutamol is essential for applications in medical diagnostics and food safety monitoring. Dopamine dysregulation has been associated with neurodegenerative disorders, including Parkinson's disease and schizophrenia, while unauthorized use of salbutamol in livestock has raised significant concerns regarding food safety and public health risks.9,67
By integrating Fe2O3 with rice straw-derived carbon dots, a low-cost, selective, and sensitive sensor was developed. This dual-analyte detection capability facilitates efficient real-time monitoring, reducing the need for time-consuming and expensive chromatographic techniques. These findings highlight the potential for broad applicability in both clinical and agricultural settings.
Data availability
Data are provided within the manuscript.Conflicts of interest
The authors declare no conflict of interest.Acknowledgements
Do Mai Nguyen was funded by the Master, PhD Scholarship Programme of Vingroup Innovation Foundation (VINIF), code VINIF.2024.TS.032.References
- H. Jin, C. Zhao, R. Gui, X. Gao and Z. Wang, Anal. Chim. Acta, 2018, 1025, 154–162 CrossRef CAS.
- S. K. Arumugasamy, S. Govindaraju and K. Yun, Appl. Surf. Sci., 2020, 508, 145294 CrossRef CAS.
- N. J. Christensen, C. J. Mathias and H. L. Frankel, Eur. J. Clin. Invest., 1976, 6, 403–409 CrossRef CAS.
- T. F. Davies, P. Laurberg and R. S. Bahn, in Williams Textbook of Endocrinology, Elsevier, 2016, pp. 369–415 Search PubMed.
- Y.-Y. Ling, Q.-A. Huang, M.-S. Zhu, D.-X. Feng, X.-Z. Li and Y. Wei, J. Electroanal. Chem., 2013, 693, 9–15 CrossRef CAS.
- P. Courlet, T. Buclin, J. Biollaz, I. Mazzoni, O. Rabin and M. Guidi, CPT: Pharmacometrics Syst. Pharmacol., 2022, 11, 469–481 Search PubMed.
- M. Lam, E. Lamanna and J. E. Bourke, Smooth muscle spontaneous activity: Physiological and pathological modulation, 2019, pp. 381–422 Search PubMed.
- T. Dong, Q. Tang, M. Chen, A. Deng and J. Li, J. Electrochem. Soc., 2015, 163, B62 CrossRef.
- C. Li, Y.-L. Wu, T. Yang, Y. Zhang and W.-G. Huang-Fu, J. Chromatogr. A, 2010, 1217, 7873–7877 CrossRef CAS PubMed.
- F. Cai, N. Wang, T. Dong, A. Deng and J. Li, Analyst, 2015, 140, 5885–5890 Search PubMed.
- European Food Safety Authority, Veterinary Drug Residues in Food – Non-Compliance Stays Low in 2023, EFSA Support. Publ., 2023, DOI:10.2903/sp.efsa.2018.en-1358.
- European Medicines Agency, EMA, Maximum residue limits (MRL), 2025, https://www.ema.europa.eu/en/veterinary-regulatory-overview/research-development-veterinary-medicines/maximum-residue-limits-mrl.
- D. M. Nguyen, T. T. Toan Tran, M. D. Doan, V. T. Le and Q. K. Dinh, Chemosphere, 2022, 303, 135202 Search PubMed.
- A. Lomae, S. Nantaphol, T. Kondo, O. Chailapakul, W. Siangproh and J. Panchompoo, J. Electroanal. Chem., 2019, 840, 439–448 CrossRef CAS.
- L. T. Thanh Nhi, L. T. Hoa, D. T. Uyen, L. H. Sinh, D. M. Nguyen, T. N. Bach, T. T. Tam Toan and D. Quang Khieu, Vietnam J. Chem., 2024, 62, 103–113 CrossRef CAS.
- J. Zhang, Y. Wei, S. Qiu and Y. Xiong, Spectrochim. Acta, Part A, 2021, 247, 119107 CrossRef CAS.
- A. A. Ismail, A. M. Ali, F. A. Harraz, M. Faisal, H. Shoukry and A. E. Al-Salami, Int. J. Electrochem. Sci., 2019, 14, 15–32 CrossRef CAS.
- H. Moradpour and H. Beitollahi, C, 2022, 8(4), 1–12 Search PubMed.
- N. Wester, S. Sainio, T. Palomäki, D. Nordlund, V. K. Singh, L.-S. Johansson, J. Koskinen and T. Laurila, J. Phys. Chem. C, 2017, 121, 8153–8164 CrossRef CAS.
- S. Umapathi, J. Masud, H. Coleman and M. Nath, Microchim. Acta, 2020, 187, 440 CrossRef CAS PubMed.
- A. Anaraki Firooz, M. Ghalkhani, J. A. Faria Albanese and M. Ghanbari, Mater. Today Commun., 2021, 26, 101716 CrossRef CAS.
- M. E. Guye, R. Appiah-Ntiamoah, M. D. Dabaro and H. Kim, Chem.–Asian J., 2024, 19, e202400435 CrossRef CAS PubMed.
- Y. Zhang, Alexandria Eng. J., 2024, 96, 185–194 CrossRef.
- C. Sun, S. Chen and Z. Li, Appl. Surf. Sci., 2018, 427, 476–484 CrossRef CAS.
- M. Kumari, G. R. Chaudhary, S. Chaudhary, M. Huang and Z. Guo, Biomass Convers. Biorefin., 2024, 14, 7507–7518 CrossRef CAS.
- N.-A. Nguyen, T.-H. Le, V.-H. Trinh, Q.-T. Ngo, V.-T. Nguyen, G. Lee, H.-S. Choi and G. Chen, J. Electrochem. Soc., 2021, 168, 044509 CrossRef CAS.
- F. Zhang, H. Yang, X. Xie, L. Li, L. Zhang, J. Yu, H. Zhao and B. Liu, Sens. Actuators, B, 2009, 141, 381–389 CrossRef CAS.
- J. Li, H. Shen, S. Yu, G. Zhang, C. Ren, X. Hu and Z. Yang, Analyst, 2020, 145, 3283–3288 RSC.
- I. Taverniers, M. De Loose and E. Van Bockstaele, TrAC, Trends Anal. Chem., 2004, 23, 535–552 Search PubMed.
- Y. NuLi, R. Zeng, P. Zhang, Z. Guo and H. Liu, J. Power Sources, 2008, 184, 456–461 CrossRef CAS.
- H. Wang, Y. Zhou, Y. Shen, Y. Li, Q. Zuo and Q. Duan, Electrochim. Acta, 2015, 158, 105–112 CrossRef CAS.
- G. Wang, X. Gou, J. Horvat and J. Park, J. Phys. Chem. C, 2008, 112, 15220–15225 CrossRef CAS.
- R. Jelinek, Carbon Quantum Dots, Springer Int. Publ., Cham, 2017, pp. 29–46 Search PubMed.
- A. Hao, X. Guo, Q. Wu, Y. Sun, C. Cong and W. Liu, J. Lumin., 2016, 170, 90–96 CrossRef CAS.
- R. Atchudan, S. Perumal, T. N. J. I. Edison, A. K. Sundramoorthy, R. Vinodh, S. Sangaraju, S. C. Kishore and Y. R. Lee, Sensors, 2023, 23(2), 787 CrossRef CAS.
- L. Chen, X. Yang, J. Chen, J. Liu, H. Wu, H. Zhan, C. Liang and M. Wu, Inorg. Chem., 2010, 49, 8411–8420 CrossRef CAS.
- V. V Bolotov, V. E. Kan, E. V Knyazev, P. M. Korusenko, S. N. Nesov, Y. A. Sten’kin, V. A. Sachkov and I. V Ponomareva, New Carbon Mater., 2015, 30, 385–390 CrossRef.
- J. Deng, Y. Dai, Z. Xiao, S. Song, H. Dai, L. Li and J. Li, Nanomaterials, 2020, 10, 1–19 Search PubMed.
- M. P. Herring, P. M. Potter, H. Wu, S. Lomnicki and B. Dellinger, Proc. Combust. Inst., 2013, 34, 1749–1757 Search PubMed.
- I. J. Gómez, M. V. Sulleiro, N. Pizúrová, A. Bednařík, P. Lepcio, D. Holec, J. Preisler and L. Zajíčková, Appl. Surf. Sci., 2023, 610, 155536 CrossRef.
- P. Raj, S. Lee and T. Y. Lee, Materials, 2021, 14, 1313 Search PubMed.
- X. Liu, M. K. Devaraju, S. Yin, A. Sumiyoshi, T. Kumei, K. Nishimoto and T. Sato, Dyes Pigm., 2010, 84, 237–241 CrossRef CAS.
- Y. Hu, P. Wang, C. E. Bunker, L. R. Teisl, M. Reibold, S. Yan, H. Qian, D. He and Y.-P. Sun, RSC Adv., 2017, 7, 41304–41310 RSC.
- J. D. Stachowska, M. B. Gamża, C. Mellor, E. N. Gibbons, M. J. Krysmann, A. Kelarakis, E. Gumieniczek-Chłopek, T. Strączek, C. Kapusta and A. Szwajca, Nanomaterials, 2022, 12, 1–18 CrossRef.
- X. Liu, H. Jiang, J. Ye, C. Zhao, S. Gao, C. Wu, C. Li, J. Li and X. Wang, Adv. Funct. Mater., 2016, 26, 8694–8706 Search PubMed.
- T. A. Tabish, F. A. Memon, D. E. Gomez, D. W. Horsell and S. Zhang, Sci. Rep., 2018, 8, 1817 CrossRef.
- P. Jin, J. Song, X. C. Wang and X. Jin, J. Environ. Sci., 2018, 64, 181–189 CrossRef CAS.
- L. Wang, W. Li, B. Wu, Z. Li, S. Wang, Y. Liu, D. Pan and M. Wu, Chem. Eng. J., 2016, 300, 75–82 CrossRef CAS.
- H. I. Adegoke, F. AmooAdekola, O. S. Fatoki and B. J. Ximba, Korean J. Chem. Eng., 2014, 31, 142–154 CrossRef CAS.
- I. T. Kim, G. A. Nunnery, K. Jacob, J. Schwartz, X. Liu and R. Tannenbaum, J. Phys. Chem. C, 2010, 114, 6944–6951 CrossRef CAS.
- D. Patil, V. Patil and P. Patil, Sens. Actuators, B, 2011, 152, 299–306 CrossRef CAS.
- L. Gao, R. Yue, J. Xu and Z. Liu, Int. J. Electrochem. Sci., 2018, 13, 6791–6802 CrossRef CAS.
- M. Najafi, S. Bellani, V. Galli, M. I. Zappia, A. Bagheri, M. Safarpour, H. Beydaghi, M. Eredia, L. Pasquale and R. Carzino, Electrochem, 2022, 3, 463–478 CrossRef CAS.
- P. Ezati, J.-W. Rhim, R. Molaei, R. Priyadarshi, S. Roy, S. Min, Y. H. Kim, S.-G. Lee and S. Han, Sustainable Mater. Technol., 2022, 32, e00397 CrossRef CAS.
- J. Yang, Z. Guo and X. Yue, BioResources, 2022, 17(1), 604–615 CAS.
- J. Cheng, X. Wang, T. Nie, L. Yin, S. Wang, Y. Zhao, H. Wu and H. Mei, Anal. Bioanal. Chem., 2020, 412, 2433–2441 CrossRef CAS PubMed.
- A. M. Santos, A. Wong and O. Fatibello-Filho, J. Electroanal. Chem., 2018, 824, 1–8 CrossRef CAS.
- T. Koc Delice, F. Ak Azem, K. Ozdemir and S. Alpat, Mater. Res. Express, 2024, 11(4), 045005 CrossRef CAS.
- J. Li, Z. Xu, M. Liu, P. Deng, S. Tang, J. Jiang, H. Feng, D. Qian and L. He, Biosens. Bioelectron., 2017, 90(1), 210–216 CAS.
- G. Selvolini, C. Lazzarini and G. Marrazza, Sensors, 2019, 19(14), 3097 CrossRef CAS PubMed.
- L. Zuniga, G. Gonzalez, R. O. Chavez, J. C. Myers, T. P. Lodge and M. Alcoutlabi, Appl. Sci., 2019, 9, 4032 CrossRef CAS.
- B. Rezaei and S. Damiri, Sens. Actuators, B, 2008, 134, 324–331 CrossRef CAS.
- A. Purwidyantri, C.-H. Chen, L.-Y. Chen, C.-C. Chen, J.-D. Luo, C.-C. Chiou, Y.-C. Tian, C.-Y. Lin, C.-M. Yang, H.-C. Lai and C.-S. Lai, J. Electrochem. Soc., 2017, 164, B205–B211 CrossRef CAS.
- W. Horwitz and R. Albert, Analyst, 1997, 122, 615–617 RSC.
- H. Zhang, X. Bo and L. Guo, Sens. Actuators, B, 2015, 220, 919–926 CrossRef CAS.
- F. Xie, X. Lin, X. Wu and Z. Xie, Talanta, 2008, 74, 836–843 CrossRef CAS PubMed.
- J. Zhang, Y. Wei, S. Qiu and Y. Xiong, Spectrochim. Acta, Part A, 2021, 247, 119107 CrossRef CAS PubMed.
| This journal is © The Royal Society of Chemistry 2025 |