Electrode architectures for high capacity multivalent conversion compounds: iron (II and III) fluoride†
Surendra K. Martha‡
a,
Jagjit Nanda*ab,
Hui Zhoua,
Juan C. Idroboa,
Nancy J. Dudneya,
Sreekanth Pannalac,
Sheng Daid,
Junjie Wange and
Paul. V. Braune
aMaterials Science and Technology Division, Oak Ridge National Laboratory, Oak Ridge, TN 37831, USA. E-mail: nandaj@ornl.gov; Tel: +1-865-2418361
bDept. of Chemical and Biochemical Engineering, University of Tennesse, Knoxville, TN 37996, USA
cComputer Science and Mathematics Division, Oak Ridge National Laboratory, Oak Ridge, TN 37831, USA
dChemical Sciences Division, Oak Ridge National Laboratory, Oak Ridge, TN 37831, USA
eDepartment of Materials Science and Engineering, University of Illinois at Urbana-Champaign, Urbana, IL 61801, USA
First published on 3rd January 2014
Abstract
We report novel electrode architectures for high capacity multivalent conversion compounds such as iron (II and III) fluoride. The material and electrode design approach addresses the intrinsically poor transport and diffusion kinetics associated with ionic solids such as iron fluorides and significantly improves their electrochemical and cycle life performance. A comparison is made between the performances of 3D electrode architecture versus the slurry coated fluoride electrodes. Detailed microstructural analysis and mechanistic scenarios are discussed that would enable development of practical high energy density conversion based electrodes for energy storage application.
Introduction
High energy density electrochemical energy storage has been an area of intense study during the last decade.1,2 Specifically, there has been tremendous research progress towards developing alternate chemistries that can reversibly store more charge (capacity) on the gravimetric and/or volumetric basis compared to the current state-of-the-art intercalation based lithium-ion systems. Examples include metal–air redox couples, lithium–sulfur, and multivalent chemistries based on conversion, alloying and displacement mechanisms.1,3–6 Multivalent conversion based binary and ternary compounds have been a subject of particular recent interest because of their high specific capacity originating from multiple oxidation states over a relatively large voltage window.2–4,7–13 Yet, harvesting reversible multi-electron capacity from multivalent systems presents many challenges due to intrinsic materials limitations arising from (i) extremely poor electronic conductivity, (ii) poor transport and interfacial charge transfer kinetics, and (iii) structural instability during multi-electron charge transfer.2–4,7,8,10–12,14–18 A combination of these factors lead to rapid capacity loss and significant hysteresis during charge–discharge cycles. A large hysteresis implies a poor roundtrip energy efficiency that makes conversion based electrodes impractical for most applications.The origin of such large hysteresis in the multivalent systems is attributed to various overpotentials, which are suspected to be due to charge transfer (electronic or ionic), ohmic or concentration driven effects.3,8,11 For example, in case of iron fluorides, a major part of the hysteresis could originate from the intrinsically slow diffusion of Fe verses Li during the reconversion process that could also favor formation of intermediate phases that are kinetically driven.3,8,11 In addition, iron fluorides (FeF3 and FeF2) are highly ionic solids and therefore extremely insulating in nature.19 These and other factors limit the use of iron fluorides for high capacity batteries despite their very high theoretical specific capacity of 712 mA h g−1 based on transfer of three moles of Li per mole of Fe. There have been numerous reports in literature directed towards improving the charge transfer kinetics and transport through various means: (i) by reducing the particle size, (ii) optimizing their morphology (or both), and (iii) enhancing the local electronic conductivity by carbon coating or addition of highly conducting diluents such as multilayer graphenes (MLG) or conductive carbon. However, to date, such improvements are not sufficient for using them as practical electrodes for rechargeable battery application.10,12,14,15,20–24
In this study we investigate the role of electrode architecture21–23,25,26 on the capacity retention and hysteresis of iron (II and III) fluoride compounds and compare their performance with electrodes fabricated using conventional slurry based approach having similar sized iron fluoride particles. The latter approach does not involve any kind of electrode architecture. The electrode architecture process described in this work has the following unique features, (i) individual nanosized iron fluoride particles (25–50 nm size range) are coated or locally surrounded with MLG to enhance their local electronic conductivity. Hereafter, we refer them as FeF3–MLG (or FeF2–MLG), (ii) The FeF3–MLG coated particles are bound to an electronic backbone or current collector comprising of an interconnected network of carbon fibers having diameter typically ranging between 5 and 9 μm. This is made possible by using a mesophase pitch carbon (petroleum pitch: p-pitch) as the conductive binder between FeF3–MLG and carbon fibers.25,26 Our results demonstrate that the carbon fiber-pitch based electrode architecture produces a significant reduction of hysteresis between the charge and discharge, from ∼2 V for the conventional slurry based iron fluoride electrode, to about 0.9 V for the carbon fiber based matrix. This also enables to obtain reversible capacity utilization of >450 mA h g−1 for FeF3 with stable cycling (>30 cycles at 25 °C). Furthermore, cycling at elevated temperature (at 60 °C), improves the reaction and/or transport kinetics yielding almost theoretical specific capacity (700 mA h g−1) with a good cycle life and additional reduction in the hysteresis. The estimated overall energy density based on the active mass of FeF3 in the electrode is about 1650 W h kg−1 covering both the intercalation and conversion window (1.5–4.5 V) at 60 °C. The overall performance of this 3D-structured cathode is remarkable, and may provide a new cathode/electrode concept for next generation high energy density batteries.
Experimental
Fabrication of iron fluoride–carbon fiber 3D composite electrode
The synthesis and processing of iron fluoride–carbon fiber 3D composite electrode architecture is illustrated in a schematic diagram shown in ESI Fig. S1.† Briefly, FeF3/FeF2 powders were purchased from Sigma-Aldrich. The as received FeF3 powders have average particle size in the range of 0.5 μm size (spherical shape) and FeF2 particles had a rod like morphology. MLG was obtained from Graphene Supermarket. Their average flake or platelet thickness is about 8 nm and BET surface area ∼100 m2 g−1. The FeF3–MLG nanocomposites were fabricated using a high-energy ball milling process (model 8000M Mixer/Mill), by mixing FeF3 or FeF2 with 20 wt% MLG for 4–6 hours. FeF3–MLG composite powders were then mixed with 5% petroleum pitch (Cytec Industries Inc., USA) in N-vinyl-2-pyrrolidone (Aldrich) to make homogenous slurry using a turbula. The slurry was then coated onto the carbon fibers (non-graphitic) and any excess slurry was carefully removed from the surface followed by drying at 90 °C under vacuum. The composite electrodes were then pressed at 1 ton cm−2 and punched into electrode disc of 1 cm2 area for the carbonization/annealing process. A few controlled experiments were performed to determine the optimal carbonization temperature for the pitch to have required electronic conductivity but does not increase the particle size or agglomeration. The optimal carbonization temperature was found to be in the vicinity of 450 °C. Further increasing the annealing temperature, for instance to 600 °C, can increase the carbonization of pitch, providing better electronic conductivity but it affects the electrochemical performance (see ESI).25,26 Below 400 °C, p-pitch does not carbonize well, resulting in the presence of organic impurities, reducing the electrochemical performance. The working electrodes comprised of ∼5 mg of active FeF3 per cm2. The processing and fabrication method for FeF2 electrodes was similar to FeF3 as mentioned above. For comparison with respect to our 3D electrode architecture as discussed above, we also fabricated iron fluoride electrodes prepared by the conventional approach. Briefly, this consists of slurry of ball milled FeF3/FeF2, MLG, and polyvinylidene fluoride (PVDF) (Aldrich) in wt% ratio of 50![[thin space (1/6-em)]](https://www.rsc.org/images/entities/char_2009.gif) :
:![[thin space (1/6-em)]](https://www.rsc.org/images/entities/char_2009.gif) 40
40![[thin space (1/6-em)]](https://www.rsc.org/images/entities/char_2009.gif) :
:![[thin space (1/6-em)]](https://www.rsc.org/images/entities/char_2009.gif) 10 (hereafter ‘conventional electrodes’) using N-methylpyrrolidone (NMP). It is noted that percentage of carbon diluent (MLG) is very high due to the insulating nature of iron fluoride particles. Both electrodes have a loading of ∼5 mg of active FeF3/FeF2 per cm2 on Al or carbon fiber. The final electrode thicknesses range between 75 and 150 μm.
10 (hereafter ‘conventional electrodes’) using N-methylpyrrolidone (NMP). It is noted that percentage of carbon diluent (MLG) is very high due to the insulating nature of iron fluoride particles. Both electrodes have a loading of ∼5 mg of active FeF3/FeF2 per cm2 on Al or carbon fiber. The final electrode thicknesses range between 75 and 150 μm.
Material characterization
Scanning electron microscopy (Hitachi S-4800 scanning electron microscope) and transmission electron microscopy (Hitachi HF3300 S/TEM) were utilized to examine the morphology and particles of the carbon fiber 3D structured electrode. The HF3300 S/TEM, operated at 300 kV and equipped with a Bruker silicon drift EDS detector, was used to obtain high angle annular dark field (HAADF) STEM images and qualitative EDS maps. Raman studies were performed using a Witec model alpha 300 R Confocal Raman Microscope.Electrochemical measurements
The electrochemical performance of the cathodes comprising FeF3 and FeF2 as the active mass was evaluated using coin-type cell geometry (CR2032, Hohsen Corp. Japan) with a 25 μm microporous trilayer membrane (polypropylene/polyethylene/polypropylene) separator (type 2325, Celgard Inc., USA). Lithium foils (purity 99.9%, Alfa Aesar) were used as counter electrode. The electrolyte solution was 1.2 M LiPF6 in a 1![[thin space (1/6-em)]](https://www.rsc.org/images/entities/char_2009.gif) :
:![[thin space (1/6-em)]](https://www.rsc.org/images/entities/char_2009.gif) 2 mixture of ethylene carbonate (EC) and dimethyl carbonate (DMC) by weight (battery grade, Novolyte Technologies, USA). Electrochemical cells were assembled in glove box (Innovative Technology, Inc., USA) under high purity argon atmosphere. After assembling, the cells were stored at room temperature for about 12 h to ensure complete impregnation of the electrodes and separators with the electrolyte solution. Galvanostatic charge–discharge cycling was carried out using a multichannel battery tester (model 4000, Maccor Inc., USA) in two-electrode coin-type cells. The cells were cycled under constant current condition between the 4.5–1.5 V voltage window and until 1 V in some cases.
2 mixture of ethylene carbonate (EC) and dimethyl carbonate (DMC) by weight (battery grade, Novolyte Technologies, USA). Electrochemical cells were assembled in glove box (Innovative Technology, Inc., USA) under high purity argon atmosphere. After assembling, the cells were stored at room temperature for about 12 h to ensure complete impregnation of the electrodes and separators with the electrolyte solution. Galvanostatic charge–discharge cycling was carried out using a multichannel battery tester (model 4000, Maccor Inc., USA) in two-electrode coin-type cells. The cells were cycled under constant current condition between the 4.5–1.5 V voltage window and until 1 V in some cases.
Results and discussions
Microstructural study of iron fluoride–MLG carbon fiber electrodes
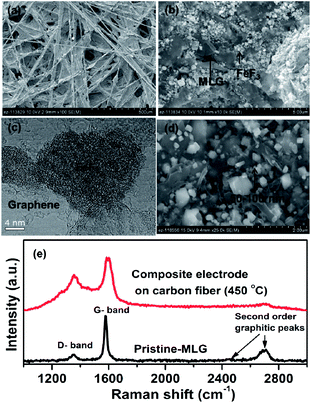
The SEM images in Fig. 1a and b clearly show that the FeF3 crystallites are intimately embedded within the carbon fiber and multilayered graphene platelets. The pristine FeF3 material has nearly spherical morphology with an initial aggregated particle size of 0.5 μm. After high energy mechanical milling the primary sizes are in the range of 25–50 nm and does not aggregate under carbonization process at 450 °C (Fig. 1c and STEM images Fig. 5a and b discussed later). The pristine FeF2 materials have rod like structure with particle size of ∼2 μm in length and about 400 nm in width (ESI Fig. S2d†). After similar mechanical milling and carbonization steps, the final FeF2 particles are approximately a factor of two larger than FeF3, about 50–100 nm (Fig. 1d). Fig. 1e (lower panel black solid line) shows the Raman spectrum of the MLGs, reflecting the strong graphitic nature of the material. The strong graphitic peak at 1590 cm−1 and a weak defect (D) band at 1350 cm−1 suggest that the MLGs are highly conducting with carbon atoms mainly having sp2 type bond symmetry. This is further supported by observation of second order peaks at 2700 and 2450 cm−1. Compared to pristine MLG the Raman bands of FeF3–MLG carbon fiber composite electrodes are significantly broadened Fig. 1e (upper panel, red solid line) with a different D to G ratio and spectral widths. This can be primarily due to two aspects (i) non-graphitic nature of carbon fibers used as the current collector (ii) effect of annealing that can induce defects or agglomeration of graphitic platelets. Further analysis of Raman results are beyond the scope of this work and will be discussed elsewhere. The carbon fibers network here provides multifunctionality. (i) The electronic backbone necessary for highly ionic compounds such as iron fluorides for full capacity retention; (ii) an active 3D current collector and thus eliminates the use of separate metallic current collector. Further, the use of p-pitch based carbon binder eliminates the use of organic inactive binders (such as polyvinylidene difluoride). The carbon fibers used in the study have a conductivity of 1.6 × 10³ S cm−1, which is ∼2 orders of magnitude smaller than the Al foil current collector (3.7 × 10⁵ S cm−1), and the fiber diameter is about 7–9 μm.25Iron(III) fluoride (FeF3): role of electrode architecture
To identify the role of electrode architecture towards improving the electrochemical performance of highly ionic compound such as iron fluoride, we present below a comparison of performance of the conventional slurry casted electrode versus the carbon fiber based 3D architecture as mentioned above. The average particle sizes of FeF3/FeF2 in both cases were similar. The primary exception is the weight fraction of carbon additive (MLG). For the convention slurry approach electrode composition consist of about 50![[thin space (1/6-em)]](https://www.rsc.org/images/entities/char_2009.gif) :
:![[thin space (1/6-em)]](https://www.rsc.org/images/entities/char_2009.gif) 40 wt% iron fluoride
40 wt% iron fluoride![[thin space (1/6-em)]](https://www.rsc.org/images/entities/char_2009.gif) :
:![[thin space (1/6-em)]](https://www.rsc.org/images/entities/char_2009.gif) MLG and 10% binder (PVDF). For the carbon fiber based approach the ratio is 75
MLG and 10% binder (PVDF). For the carbon fiber based approach the ratio is 75![[thin space (1/6-em)]](https://www.rsc.org/images/entities/char_2009.gif) :
:![[thin space (1/6-em)]](https://www.rsc.org/images/entities/char_2009.gif) 20 wt% and 5% carbonized pitch. The higher MLG composition was necessary due to the extremely poor intrinsic electronic conductivity of iron fluorides. The specific capacity and cyclability of FeF3–MLG composite on fiber architecture electrode were directly evaluated by charge–discharge measurements at low current rate (C/50 rate), at room temperature (25 °C) as well as at 60 °C. Separate experiments were performed for pure phases of MLG, pitch based carbon and carbon fibers to verify that they do not have any capacity contribution within the cycling voltage range (4.5–1 V) (data not shown here).
20 wt% and 5% carbonized pitch. The higher MLG composition was necessary due to the extremely poor intrinsic electronic conductivity of iron fluorides. The specific capacity and cyclability of FeF3–MLG composite on fiber architecture electrode were directly evaluated by charge–discharge measurements at low current rate (C/50 rate), at room temperature (25 °C) as well as at 60 °C. Separate experiments were performed for pure phases of MLG, pitch based carbon and carbon fibers to verify that they do not have any capacity contribution within the cycling voltage range (4.5–1 V) (data not shown here).
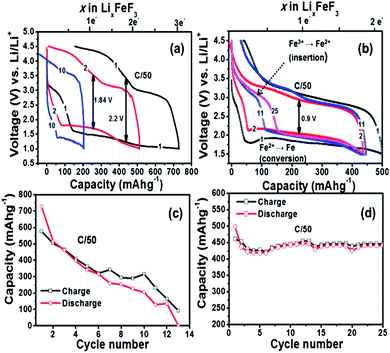
The first discharge capacity for the conventional slurry casted FeF3–MLG electrodes shows capacity in excess of 700 mA h g−1 (Fig. 2a), which corresponds to reaction of 3 moles of Li per mole of Fe metal. The first plateau, between 3.5 and 3 V, corresponds to a reduction of Fe3+ to Fe2+ via an insertion or intercalation type mechanism (reaction (1)). The plateau at 1.8 V corresponds to a reduction of Fe2+ to Fe0 via a conversion reaction (reaction (2)).3,8,11
| FeF3 + Li+ + e− = LiFeF3 | (1) |
| LiFeF3 + 2Li+ + 2e− = Fe0 + 3LiF | (2) |
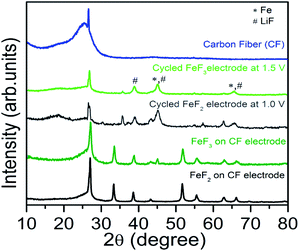
Current understanding based on literature report suggests that FeF3 first undergoes insertion up to Li0.5FeF3 with a rutile like structure, followed by extrusion of LiF and insertion of more lithium up to LiFeF3 (reaction step (1)) and finally forming a mixture of α-Fe and LiF as part of the conversion reaction that overall involves a 2 electron transfer (reaction (2)).3,7,8,17 At the end of the conversion step the starting LiFeF3 phase is fully converted to Fe–LiF phase. We notice that for slurry based FeF3 electrode the capacity retention is very poor with virtually no capacity remaining at the end of 12 cycles. This is even with a higher carbon loading of 40 wt% (Fig. 2c). On the contrary, FeF3–MLG coated on the carbon fiber matrix shows much improved performance. The first discharge capacity ∼500 mA h g−1 (>2 electron capacity) in the potential range 4.5 V and 1.5 V (Fig. 2b) and 550 mA h g−1 if cycled in the potential window of 4.5–1.0 V (Fig. S3 ESI†). We notice important differences between the charge–discharge profiles of slurry versus 3D carbon fiber FeF3 electrodes. Most notably, the first few discharge profiles of 3D fiber electrodes (Fig. 2b) show very little intercalation capacity in the 3.5–3 V region unlike for conventional FeF3 electrodes. But under continuous cycling we begin to see a clear intercalation plateau characteristic of FeF3. Further investigation suggests that the annealing (at 450 °C) of FeF3 nanosized particles in the presence of MLG (carbon) and pitch in argon atmosphere can lead to reduction of FeF3 to mainly FeF2 phase. This is further confirmed by X-ray diffraction (XRD) results shown in Fig. 3. The annealed FeF3–MLG carbon fiber electrode has XRD pattern (dark green) similar to FeF2–MLG carbon fiber electrode (black). Nanosize FeF2 can undergo a pseudocapacitive type reaction in presence of electrolyte mixture that contains LiPF6 to convert into FeF3 as reported by Amatucci and other groups.27,28 Similar to the performance of slurry based FeF3 electrode (Fig. 2a) the charge–discharge profile in FeF3–MLG carbon fiber electrodes can also be categorized into two capacity/voltage regions. The cathodic peak between 3.0 and 2.5 V and the anodic peak between 3.3 and 3 V are related to reaction 1 (insertion), and the corresponding plateaus at 1.8 V (cathodic) and the ∼2.8 V (anodic) are related to reaction 2 (conversion). The potential difference between the cathodic and anodic peaks for reactions (1) and (2) is about 0.4 V and 0.9 V, respectively. Significantly larger polarization of reaction (2) implies that the conversion reaction is intrinsically slower than the intercalation reaction. The rise of the FeF3 redox potential after the first lithiation (discharge plateau # 2 Fig. 2b) is attributed to an improvement of diffusion kinetics, which could be due to the reduction in particle size (presented later in Fig. 5c and d) of the reconverted FeF3; similar behaviour was also reported for other conversion compounds.12,29,30 For the slurry based composite electrodes, the capacity degrades rapidly and the cell loses its capacity completely in less than 15 cycles (Fig. 2c) whereas FeF3 on fiber electrode architecture has steady capacity retention over more than 25 cycles (Fig. 2d). Lowering the voltage cut-off to 1 V instead of 1.5 V yields about 15% more capacity but there is also a significant increase in the voltage hysteresis (result shown in the ESI Fig. S3†). However, such increase in capacity does not necessarily result in higher energy density because of the lower voltage window. Table S1 (ESI)† summarizes the specific capacity and electrochemical performance of FeF3 electrodes under different voltage window and processing conditions.
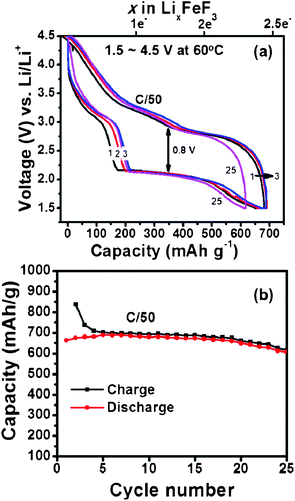
We observe a dramatic improvement in electrochemical performance of similar FeF3 carbon fiber electrodes when cycled at 60 °C as shown in Fig. 4. Such improvement in the electrochemical performance can be explained due to combination of factors such as activated diffusion inside the FeF3 particle and/or increased interfacial charge transfer kinetics. To separate these effects detailed impedance studies are currently under progress. Unlike the 25 °C results we notice a higher discharge plateau for 60 °C (∼2.1 V) during the 1st cycle itself. There is also a marginal improvement in voltage hysteresis from 0.9 V at 25 °C to 0.8 V at 60 °C. More importantly, the enhanced ion diffusion kinetics (at 60 °C) enables reversible three electron capacity of around 700 mA h g−1 (close to theoretical capacity) as shown in Fig. 4a. We further notice a stable cycling behaviour with capacity retention >600 mA h g−1 for more than 25 cycles (Fig. 4b). This is by far the best results obtained from iron fluoride conversion systems and highlights the role of electrode architecture in further improving their electrochemical performance. An aspect that needs attention during 60 °C cycling is the undesirable side reactions between the electrolyte and electrode materials that could get accelerated at elevated temperatures and manifest as poor columbic efficiency during the first few cycles. These reactions could result from oxidation of electrolyte by itself or reaction with surface electrode species and/or carbon. The capacity values reported in Fig. 2 and 4 are with respect to weight of the active material, FeF3. When normalized to the total mass of the electrode material (active material + MLG + pitch binder) the discharge capacity of FeF3–MLG at 1.5 V cutoff voltage is about 334 mA h g−1 at 25 °C and 519 mA h g−1 at 60 °C. It is significant to note that within the intercalation window, the FeF3–MLG carbon fiber electrode can deliver more than 235 mA h g−1 at 60 °C (close to the theoretical capacity) with an average discharge voltage of about 3.25 V. The voltage hysteresis is only about 0.35 V in this range (2.3–4.5 V). From the experimental cycling data the estimated specific energy (the product of capacity and the operating voltage) is about 740 W h kg−1, and 490 W h kg−1 at 25 °C. This by itself is comparable to most of the conventional Li-ion battery intercalation cathodes. The estimated overall energy density based on the active mass of FeF3 in the electrode is about 1650 W h kg−1 covering both the intercalation and conversion window (1.5–4.5 V). A general comment: although the XRD (Fig. 3) of FeF3–MLG electrode shows FeF2 like phase to start with, but it takes only a few cycles for electrodes to behave like FeF3 as shown by the clear intercalation peak around 3 V in Fig. 2b followed by conversion reaction. Further, when these electrodes are stored under ambient condition they mostly convert to FeF3 as shown by the 1st discharge cycle plot in Fig. 4.
C-rate performance of FeF3–MLG carbon fiber electrodes
Fig. 5 shows the C-rate performance at room temperature (25 °C) for FeF3–MLG electrodes beginning from very low rates (C/86) to 10 C. The electrodes show very complicated rate kinetics because of the combined intercalation and conversion charge transfer processes. For current rates >C/20 the voltage profile is suppressed to below 1.5 V and significant fraction of conversion capacity is in the region between 1.5 and 1 V which may not be very useful if considered as a cathode. It is noteworthy that in the intercalation range (4–2.5 V) there is not much capacity loss between C/86-5 C and one obtains full capacity close to 200 mA h g−1. There is even significant capacity retention at 10 C in the intercalation region. Except for the C/20 discharge profile (Fig. 5a) the conversion plateau moves to lower voltages with increasing current rate. Such polarization could be a signature of poor kinetics associated with conversion phases as has been noted earlier. The discharge profiles (Fig. 5) clearly show that we lose considerable capacity as we go to high discharge rates.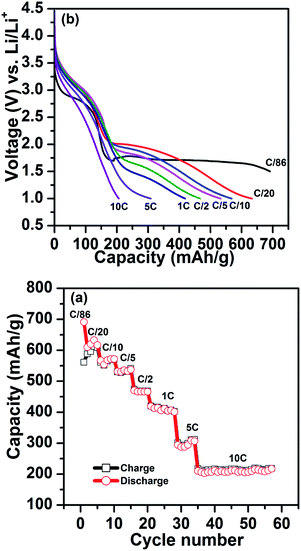 | ||
| Fig. 5 (a) Rate performance of the FeF3–MLG carbon fiber electrode, cycled between 1.0 V and 4.5 V. (b) The corresponding voltage profiles at different rates. | ||
Electron microscopy study of cycled FeF3–MLG electrodes
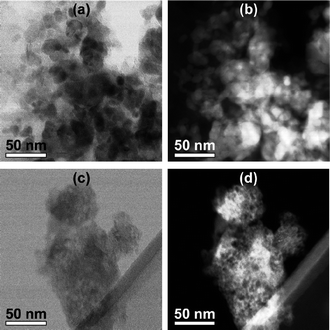
The local microstructure of the starting iron fluoride phase and their constant evolution during the repeated conversion process during cycling has significant effect on their electrochemical performance. To understand this we have undertaken high resolution electron microscope studies on pristine and cycled FeF3 electrodes. The local structure of pristine and discharged (lithiated) FeF3–MLG particles was examined by bright-field and Z-contrast imaging with aberration-corrected scanning transmission electron microscopy (STEM) as shown in Fig. 6. The images show that cycled FeF3 particles in fully discharged (lithiated) state have much finer particle size approximately in the range of 1–2 nm (Fig. 6c and d) compared to pristine (or uncycled) FeF3–MLG (Fig. 6a and b). Literature reports attribute this to the formation of nucleated phases of Fe nanoparticles surrounded by LiF during the discharge process.2,7,8,12,17,30 Elemental analysis of the discharged FeF3 particles using STEM was difficult as the sample was very susceptible to the electron beam damage (even at a lower flux and using different acceleration voltages, i.e. 60 kV and 100 kV). However XRD results on the discharged FeF3–MLG electrode (Fig. 3) show broad peaks corresponding to nanometer sized LiF and Fe indicating formation of conversion reaction products under fully discharged condition. Similar results were observed for the discharged FeF2 electrode as well. The results provide evidence that a major part of the hysteresis could stem from the kinetic overpotential during the reconversion which has its origin from difference in ionic mobility between Li and Fe: with Li being more mobile than Fe2+. This could lead to the formation of Fe0 precipitates locally with much slower intermixing with LiF phase, to form the parent LiFeF3. Consequently, the voltage plateau during the charge (reconversion) is then determined by ability of the Fe clusters to react with LiF, which depends on the exact nature of their interfacial interphase and various kinetically stabilized reaction pathways.3,8,11Iron(II) fluoride–MLG carbon fiber electrodes
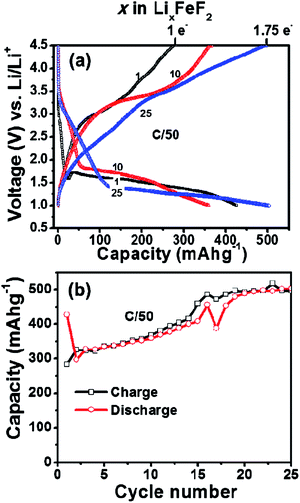
The FeF2–MLG carbon fiber 3D electrode was also fabricated by the same synthesis & processing method but their electrochemical performance was not as robust as FeF3. Fig. 7a shows the charge–discharge voltage profile of the FeF2–MLG nano-composite electrode cycled at C/50 rate at room temperature between 4.5 and 1 V window. It is interesting to note that the reversible capacity of FeF2–MLG nano-composite electrode gradually increases with cycling with a capacity feature appearing between 3 and 2.5 V similarly similar to FeF3. The result suggests slow oxidation of a FeF2 to a FeF3 under electrochemical condition as discussed earlier.27,28 Notably, the discharge capacity increases from ∼400 mA h g−1 in the 1st cycle to 500 mA h g−1 at the end of 20th cycle corresponding to 1.75 electron capacity. On the contrary, FeF2 (similar particle size) electrode fabricated by conventional slurry method shows full capacity (2 electrons) in the 1st cycle and the capacity thereafter decreases to 100 mA h g−1 at the end of the 30th cycle (ESI Fig. S4†). There appears to be some kind major structural and phase rearrangement between the 1st and 2nd electrochemical cycle (for the slurry electrodes) leading to rapid decrease in capacity and thereafter the capacity declines steadily. Unlike FeF3, FeF2–MLG carbon fiber electrodes show large hysteresis (∼2 V) although they use similar carbon fiber based electronic scaffold and are processed under identical synthetic parameters with same weight percent of MLG and pitch. The only difference is the average particle size for FeF2, is a factor of two larger than FeF3 (Fig. 1). The origin of higher hysteresis for FeF2 is at present not clear and could be beyond just the particle size effect. Nevertheless, the carbon fiber architecture provides much improved electrochemical performance compared to slurry based as explained above.Conclusions
This article highlights and distinguishes the significance of using an ordered 3D electrode structure for conversion materials such as iron fluoride to improve their electrochemical performance and cycle life. The electrochemical performance of such iron fluoride–carbon fiber electrodes was compared with respect to the conventional slurry based iron fluoride electrode under similar materials and electrode design parameters such as particle size loading. The conventional slurry electrodes coated on aluminium foil have very poor capacity retention even with a higher conductive carbon (MLG) loading. At room temperature we obtain reversible discharge capacity close to 595 mA h g−1 (between 4.5 and 1.0 V) and 445 mA h g−1 (operating voltage 4.5–1.5 V) for FeF3 carbon fiber electrodes. The corresponding value for the FeF2–MLG fiber electrode was 500 mA h g−1 (operating voltage 4.5–1.0 V). Full three-electron capacity could be obtained for FeF3 composite cathodes when they are cycled at 60 °C corresponding to 85% of its theoretical energy density (1951 W h kg−1). The voltage hysteresis is significantly reduced from ∼2 V for PVDF–CB based slurry electrodes to about 0.9 V for the fiber 3D architecture significantly improving the roundtrip efficiency. The increase in capacity retention, reduction in voltage hysteresis and improved cycle-life observed for the iron fluoride system indicate the importance of electrode architecture and other relevant material parameters such as particle size and electronic conductivity. Although the majority of electrochemical results discussed in this work are based on C/50 C-rate, FeF3–MLG electrodes show very good rate performance in the intercalation region (upto 10 C). There is still decent capacity retention at higher rates in the conversion region but the voltage profiles are pushed lower than 1.5 V due to poor transport kinetics. A detailed performance analysis of the FeF3–CF electrodes is presented in the ESI, Table S1.† Furthermore, this electrode approach potentially eliminates the use of organic binders and conductive diluent that could reduce the inactive materials weight by as much 15 wt%. Absence of the regular Al current collector has a relative weight reduction by 40% (per normalized mass with respect to carbon fiber mat). This could improve the active materials loading resulting in increasing the energy density by ∼20–25% at the cell level. Despite such improvements more fundamental investigations are necessary to understand the reaction mechanisms involving formation of various intermediate phases during the conversion reaction. Recent literature reports claim that the reversibility of the conversion reaction phases depends on a variety of factors such as the kinetics of the discharge phases, their internal microstructure and also the electrochemical variables that govern the charge–discharge process such as current rate, voltage window etc.7,8,11,12,17,30Acknowledgements
This research is supported by the Laboratory Directed Research and Development Program of Oak Ridge National Laboratory, managed by UT-Battelle, LLC, for the U. S. Department of Energy (SKM, HZ, SP, JN, SD, JCI, JW, and PVB). Electron microscopy work is supported by Oak Ridge National Laboratory's Shared Research Equipment (ShaRE) User Facility Program, which is funded by Office of Basic Energy Sciences, DOE (JCI). Raman spectroscopy work is supported by Assistant Secretary for Energy Efficiency and Renewable Energy, Office of Vehicle Technologies of the U.S. Department of Energy. JN thanks Dr Ping Liu formerly of HRL laboratories and currently at Department Of Energy, Washington, DC for valuable technical discussion.References
- P. G. Bruce, S. A. Freunberger, L. J. Hardwick and J.-M. Tarascon, Nat. Mater., 2011, 11, 19–29 CrossRef PubMed.
- X.-P. Gao and H.-X. Yang, Energy Environ. Sci., 2010, 3, 174–189 CAS.
- F. Badway, N. Pereira, F. Cosandey and G. Amatucci, Next Generation Positive Electrode Materials Enabled by Nanocomposites: Metal Fluorides, 2002 Search PubMed.
- J. Cabana, L. Monconduit, D. Larcher and M. R. Palacín, Adv. Mater., 2010, 22, E170–E192 CrossRef CAS PubMed.
- J. S. Lee, S. Tai Kim, R. Cao, N. S. Choi, M. Liu, K. T. Lee and J. Cho, Adv. Energy Mater., 2011, 1, 34–50 CrossRef CAS.
- J. R. Szczech and S. Jin, Energy Environ. Sci., 2011, 4, 56–72 CAS.
- F. Badway, N. Pereira, F. Cosandey and G. Amatucci, J. Electrochem. Soc., 2003, 150, A1209–A1218 CrossRef CAS PubMed.
- R. E. Doe, K. A. Persson, Y. S. Meng and G. Ceder, Chem. Mater., 2008, 20, 5274–5283 CrossRef CAS.
- Z. Wang, D. Luan, S. Madhavi, Y. Hu and X. W. Lou, Energy Environ. Sci., 2012, 5, 5252–5256 CAS.
- P. Liao, B. L. MacDonald, R. A. Dunlap and J. R. Dahn, Chem. Mater., 2007, 20, 454–461 CrossRef.
- P. Liu, J. J. Vajo, J. S. Wang, W. Li and J. Liu, J. Phys. Chem. C, 2012, 116, 6467–6473 CAS.
- F. Wang, R. Robert, N. A. Chernova, N. Pereira, F. Omenya, F. Badway, X. Hua, M. Ruotolo, R. Zhang, L. Wu, V. Volkov, D. Su, B. Key, M. S. Whittingham, C. P. Grey, G. G. Amatucci, Y. Zhu and J. Graetz, J. Am. Chem. Soc., 2011, 133, 18828–18836 CrossRef CAS PubMed.
- V. L. Chevrier, G. Hautier, S. P. Ong, R. E. Doe and G. Ceder, Phys. Rev. B: Condens. Matter Mater. Phys., 2013, 87, 094118 CrossRef.
- S. W. Kim, D. H. Seo, H. Gwon, J. Kim and K. Kang, Adv. Mater., 2010, 22, 5260–5264 CrossRef CAS PubMed.
- D.-l. Ma, Z.-y. Cao, H.-g. Wang, X.-l. Huang, L.-m. Wang and X.-b. Zhang, Energy Environ. Sci., 2012, 5, 8538–8542 CAS.
- R. F. Li, S. Q. Wu, Y. Yang and Z. Z. Zhu, J. Phys. Chem. C, 2010, 114, 16813–16817 CAS.
- N. Yamakawa, M. Jiang, B. Key and C. P. Grey, J. Am. Chem. Soc., 2009, 131, 10525–10536 CrossRef CAS PubMed.
- F. Wang, H. C. Yu, M. H. Chen, L. Wu, N. Pereira, K. Thornton, A. Van der Ven, Y. Zhu, G. G. Amatucci and J. Graetz, Nat. Commun., 2012, 3, 1201 CrossRef PubMed.
- C. Li, L. Gu, J. Tong, S. Tsukimoto and J. Maier, Adv. Funct. Mater., 2011, 21, 1391–1397 CrossRef CAS.
- C. Li, L. Gu, J. Tong and J. Maier, ACS Nano, 2011, 5, 2930–2938 CrossRef CAS PubMed.
- D. R. Rolison, J. W. Long, J. C. Lytle, A. E. Fischer, C. P. Rhodes, T. M. McEvoy, M. E. Bourg and A. M. Lubers, Chem. Soc. Rev., 2009, 38, 226–252 RSC.
- J. S. Sakamoto and B. Dunn, J. Mater. Chem., 2002, 12, 2859–2861 RSC.
- H. Zhang, X. Yu and P. V. Braun, Nat. Nanotechnol., 2011, 6, 277–281 CrossRef CAS PubMed.
- R. Prakash, A. K. Mishra, A. Roth, C. Kubel, T. Scherer, M. Ghafari, H. Hahn and M. Fichtner, J. Mater. Chem., 2010, 20, 1871–1876 RSC.
- S. K. Martha, N. J. Dudney, J. O. Kiggans and J. Nanda, J. Electrochem. Soc., 2012, 159, A1652–A1658 CrossRef CAS PubMed.
- S. K. Martha, J. O. Kiggans, J. Nanda and N. J. Dudney, J. Electrochem. Soc., 2011, 158, A1060–A1066 CrossRef CAS PubMed.
- M. A. Reddy, B. Breitung, V. S. K. Chakravadhanula, C. Wall, M. Engel, C. Kübel, A. K. Powell, H. Hahn and M. Fichtner, Adv. Energy Mater., 2013, 3, 308–313 CrossRef CAS.
- F. Badway, F. Cosandey, N. Pereira and G. G. Amatucci, J. Electrochem. Soc., 2003, 150, A1318–A1327 CrossRef CAS PubMed.
- F. Badway, A. Mansour, N. Pereira, J. Al-Sharab, F. Cosandey, I. Plitz and G. Amatucci, Chem. Mater., 2007, 19, 4129–4141 CrossRef CAS.
- L. Li, F. Meng and S. Jin, Nano Lett., 2012, 12, 6030–6037 CrossRef CAS PubMed.
Footnotes |
| † Electronic supplementary information (ESI) available. See DOI: 10.1039/c3ra47266c |
| ‡ Present address: Department of Chemistry, Indian Institute of Technology Hyderabad, Ordnance Factory Estate, Yeddumailaram 502 205, A.P., India. |
| This journal is © The Royal Society of Chemistry 2014 |

