Molecular dynamics simulations and microscopic analysis of the damping performance of hindered phenol AO-60/nitrile-butadiene rubber composites

Meng Song, Xiuying Zhao, Yi Li, Shikai Hu, Liqun Zhang and Sizhu Wu*
State Key Laboratory of Organic–Inorganic Composites, Beijing University of Chemical Technology, Beijing 100029, P.R. China. E-mail: wusz@mail.buct.edu.cn; Fax: +86-10-64433964

Received 31st October 2013 , Accepted 23rd December 2013

First published on 2nd January 2014


Abstract

Molecular dynamics (MD) simulations are used to investigate the fundamental damping mechanism of the AO-60/nitrile-butadiene rubber (AO-60/NBR) composites at the molecular level in this study. The hydrogen bonds (H-bonds), binding energy, and fractional free volume (FFV) of the AO-60/NBR composites were obtained. The AO-60/NBR composite with an AO-60 content of 36 phr had the largest H-bonds, highest binding energy, and smallest FFV, all indicating a good compatibility between NBR and AO-60 and good damping performance of the AO-60/NBR composite. The experimental FTIR, and 1H-NMR results also showed that two types of H-bonds exist between the AO-60 small molecules and NBR polymer chains. Moreover, DSC and DMA were employed to characterize the compatibility between NBR and AO-60 in the composites. Phase separation between NBR and AO-60 appeared as the AO-60 content exceeded 36 phr. We hope the present study provides theoretical guidance for the design of optimum damping properties of polymer composites.

1 Introduction

Rubber damping materials play a great role in the development of novel materials because they are ideal for reducing unwanted noise and prevent vibration fatigue failure.1 Rubber damping materials are widely used in rockets, missiles, satellites, precision machine tools and instruments, destruction prevention of high-rise buildings, and the development of modern industry. Damping behavior is a reflection of internal friction.2 Homopolymers usually exhibit effective damping (tan[thin space (1/6-em)]δ > 0.3) only within a narrow range of temperatures, usually 20–30 °C around their glass transition temperatures (Tg). Within this narrow range of temperatures, there is pronounced dissipation of mechanical energy as heat with the onset of coordinated chain molecular motion.2,3 Nitrile-butadiene rubber (NBR) has a higher loss factor than other rubbers in rubber products because of the high polarity of the –CN side groups. Its glass transition temperature zone is in the range −10 °C to 30 °C. Thus, it has been regarded as a good damping material4 and has been used in a range of applications.5

In general, the dynamic mechanical behavior of polymers can be adjusted by conventional means such as the additions of plasticizers and fillers, mechanical blending of various polymers, and copolymerization.6 The use of hydrogen bonds (H-bonds) between organic nanofillers and polymers for the design of damping nanocomposites or so-called “self-assembled” materials has attracted much attention because of the significantly improved dynamic mechanical properties and good bonding strength of these materials.7–9 Wu et al. investigated the dynamic mechanical properties of hybrids of chlorinated polyethylene (CPE) and 3,9-bis[1,1-dimethyl-2{b-(3-tert-butyl-4-hydroxy-5-methylphenyl)propionyloxy}-ethyl]-2,4,8,10-tetraoxaspiro[5,5]-undecane (AO-80), and they found that the intermolecular H-bonds between AO-80 and CPE was the main reason for the improved dynamic properties of the system.10 By introducing 2,2′-methylenebis(6-t-butyl-4-methylphenol) (AO-2246) into carboxylated nitrile rubber (XNBR), Liu et al. found that the damping properties improved remarkably.11 Various studies have been carried out to enhance the damping properties of damping materials by introducing small molecules.12–14

H-Bonds have received a great deal of attention in recent years in chemistry, physics, and biology.15 The presence of H-bonds affects many material properties, such as the unique properties of water, the shape of biological molecules, and the increase in the Tg of polymer. For example, Stiopkin et al. used the heterodyne-detected sum frequency generation (SFG) technique to obtain the free deuterium hydroxyl (OD) structure caused by hydrogen bonding at the water surface.16 By using experimental and theoretical methods, Kim et al. showed that urea groups hydrogen-bonded to the hydrophobic blocks of polymer enhanced the micelle assemblies for drug delivery.17 Lin et al. found that through amide groups hydrogen bonding to the carbonyl groups of MMA units, PMMA copolymers had high glass transition temperatures and high transparency.18 Hydrogen bonding can be expressed as “X–H⋯Y”, in which X and Y are generally large electronegative elements. X–H is referred to as a proton donor and Y a proton acceptor. The bond energy of H-bond is much smaller than that of chemical bond but an order of magnitude larger that of van der Waals force. Many experimental techniques can be used to study H-bonds, including Fourier transform infrared (FTIR) spectroscopy,19 Raman spectroscopy,20 nuclear magnetic resonance (NMR),21,22 extended X-ray absorption fine structure spectroscopy,23 and in situ diffuse reflectance infrared spectroscopy (DRIFT).24

However, the experimental methods usually study the H-bonds in an indirect and qualitative way. In this study, we used molecular dynamics (MD) simulation to study quantitatively the microscopic structure and H-bonds of AO-60/NBR composites. MD simulation is a very valuable tool to understand the underlying damping mechanism and the relation between the H-bonds and the damping properties at the molecular level.25 With the development of extremely powerful computer hardware and software in the past few decades, molecular dynamics simulation has emerged as a powerful theoretical tool to understand the structure–performance relationships of materials.26

With MD simulation, the micro-properties of the AO-60/NBR composites can be investigated by constructing the proper cells for AO-60/NBR with different mass ratios. Moreover, the number of H-bonds, the binding energy, the pair correlation function, and the fractional free volume (FFV) can be studied by MD simulation. Then, we used experiments to validate the simulation result. Through MD simulation and experimental methods, we expect to establish correlations between the microstructures and the damping properties. Such correlations are expected to be useful for the design of novel damping materials.

2 Simulation and results

2.1 MD simulation strategies

The MD simulations were carried out by using the Discover and Amorphous Cell modules from Accelrys company with the Condensed-Phase Optimized Molecular Potentials for Atomistic Simulation Studies (COMPASS) force field. The COMPASS force field is an all-atom force field for the atomistic simulation of common organic molecules, small inorganic molecules, and polymers in isolation and in condensed phases.27 This force field was chosen in this work because it can achieve a broad coverage with about the same quality. The initial velocities of the atoms were assigned by using the Maxwell–Boltzmann profiles at 298 K, and the Ewald summation method was used to calculate the long-range electrostatic interaction with an accuracy of 1.0 × 10⁻³ kcal mol−1.25 The Verlet velocity time integration method was used with the time step of 1 femtosecond (fs).28

After the atomistic repeating units of butadiene and acrylonitrile were prepared (see Fig. 1(a) and (b)), a single random copolymer chain (NBR) with the specified probabilities that agree with the experiment ratio of acrylonitrile content to NBR and with the 30 repeating units was constructed. The chemical structures of the NBR polymer chain and the AO-60 small molecule are shown in Fig. 2(c) and (d).


image file: c3ra46275g-f1.tif
Fig. 1 Molecular structures of (a) AO-60 and (b) NBR.

image file: c3ra46275g-f2.tif
Fig. 2 Models for MD simulation of AO-60/NBR composites (blue sphere represents N atom, red sphere represents O atom, green sphere represents H atom, grey sphere represents C atom, and blue dashed line represents hydrogen bond).

Amorphous cells containing composites of NBR polymer chains and AO-60 small molecules were constructed, and periodic boundary conditions were applied. There were four NBR polymer chains and some AO-60 small molecules in each cell. The chain lengths and number of chains were chosen according to three criteria: (1) to keep the cell size and computing time at a manageable level; (2) to ensure sufficient mobility of chains to allow chain movement within the modeling time, and (3) to facilitate calibrated calculation scale.29 Different mass ratios of AO-60 to NBR were used in the MD simulations: 0/100, 18/100, 36/100, 55/100, 73/100, and 91/100.

Fig. 2 shows the process of construction of the amorphous cell. First, the NBR polymer chains (Fig. 2(c)) and AO-60 small molecules (Fig. 2(d)) are built in a periodic boundary cell (Fig. 2(e)). Then the energy of each generated cell is minimized to a convergence value of 1.0 × 10⁻⁵ kcal mol−1 Å−1 by using the Smart Minimizer method to relax the state of minimal potential energy. The cell is then annealed at 0.1 MPa from the low temperature of 200 K to the upper temperature of 400 K for 50 ps to prevent the system to form being trapped at a local high energy minimum.30 Subsequently, 150 ps of NVT (constant number of particles, volume, and temperature) simulation is performed at 298 K and 200 ps of NPT (constant number of particles, pressure, and temperature) simulation is performed at 0.1 MPa to further relax the polymer structure by using the Andersen Thermostat31 for temperature control and the Berendsen Barostat for pressure control32 (Fig. 2(f)). At last, the cell can be used to analyze the properties of the system (Fig. 2(g)), and the number of H-bonds counted (Fig. 2(h)). In Fig. 2(h) the blue dashed line represents an H-bond between a NBR polymer chain and an AO-60 small molecule.

Fig. 3 exhibits two kinds of H-bonds in the AO-60/NBR composite. The first H-bond(a) O–H⋯O (Fig. 3(a)) is between the phenolic hydroxyl groups –OH of AO-60 (Fig. 1(a), 1 and 2) and the carbonyl groups –C[double bond, length as m-dash]O of AO-60 (Fig. 1(a), 3 and 4). The second H-bond(b) O–H⋯N is between the phenolic hydroxyl groups –OH of AO-60 (Fig. 1(a), 1 and 2) and the nitrile groups –CN of NBR (Fig. 1(b), 5). These two kinds of H-bonds, H-bond(a) and H-bond(b), form a network structure, as shown in Fig. 3(c).


image file: c3ra46275g-f3.tif
Fig. 3 Molecular structures of (a) H-bond(a), (b) H-bond(b) and (c) H-bond network in the AO-60/NBR composites. (The black thick lines, blue short lines, black dashed lines, and blue dashed lines denote NBR polymer chains, AO-80 small molecules, H-bond(a), and H-bond(b), respectively.)

2.2 Analysis of AO-60/NBR composites by MD simulation

MD simulation is an important tool for understanding the correlation of the microstructure parameters with the macroscopic damping performance.33 In this work, MD simulation was used to obtain quantitative information on the H-bonds in AO-60/NBR composites. The number, length, and angle of the H-bonds in a cell can be calculated. The H-bond length was found to be less than 2.5 Å, and the angle is larger than 90°. Fig. 4 shows the simulated hydrogen bonds consisting of H-bonds(a) and H-bonds(b) in an amorphous cell for the AO-60/NBR (36/100) composite. Through repeated simulations, the number of H-bonds in AO-60/NBR composites with different mass ratios were obtained and listed in Table 1.
image file: c3ra46275g-f4.tif
Fig. 4 H-bonds in amorphous cell of AO-60/NBR (36/100) (the purple dotted lines represent H-bonds).
Table 1 Number of H-bonds(a) and H-bonds(b) in different AO-60/NBR composites
Mass ratio of AO-60/NBR 0/100 18/100 36/100 55/100 73/100 91/100
No. of H-bonds(a) 0 1 2 2 1 2
No. of H-bonds(b) 0 2 5 3 3 3


The number of H-bonds(a) increases with increasing AO-60 content for the simple reason that more AO-60 small molecules will increase the chances of forming H-bonds(a). As the AO-60 content increases, the number of H-bonds(b) first increases and then decreases. When the content of AO-60 in AO-60/NBR composite is 36 phr, the number of H-bonds in the composite reaches a maximum, indicating the strongest interaction between NBR and AO-60. Further increases in AO-60 content would induce AO-60 aggregation which produces large steric hindrance to restraint the formation of H-bonds. Moreover, the results of MD simulation show that the hydrogen bonding effect weakens as AO-60 content exceeds 36 phr.

Binding energy (Ebinding) which is defined as the negative value of the interaction energy (Einter), can well reflect the capacity of two components mixed with each other.34 From the equilibrium configuration of trajectory files at the end of MD simulation, the energy of the system NBR + AO-60 (Etotal) and each component can be obtained. The binding energy between NBR and AO-60 can be calculated by the following expression:

 
Ebinding = −Einter = −(EtotalEAO-60ENBR) (1)
where EAO-60 and ENBR are the total energies of AO-60 and NBR, respectively.

The total energy of the AO-60/NBR system, the energy of AO-60, and the energy of NBR are presented in Table 2. ENBR is constant at −1205.875 kcal mol−1 because we fixed the number of NBR polymer chains in the simulation. The binding energy of the AO-60/NBR depends on the AO-60 content. The binding energy of AO-60/NBR reaches a maximum value at an AO-60 content of 36 phr, indicating the strongest interaction between the components and corresponding to the maximum number of H-bonds. A highest binding energy indicates good compatibility of the components in AO-60/NBR. As the AO-60 content exceeds 36 phr, the binding energy of the system becomes negative, an indication of the immiscibility of the NBR matrix with the AO-60 small molecules and the phase separation will appear in the composites.

Table 2 Binding energies of AO-60/NBR composites with different AO-60 contents
Mass ratio AO-60/NBR Etotal (kcal mol−1) EAO-60 (kcal mol−1) ENBR (kcal mol−1) Ebinding (kcal mol−1)
0/100 −1205.875 0 −1205.875 0
18/100 −1460.911 −181.938 −1205.875 73.098
36/100 −1753.360 −430.989 −1205.875 116.496
55/100 −1816.660 −733.651 −1205.875 −122.866
73/100 −2114.470 −972.170 −1205.875 −63.575
91/100 −2301.109 −1103.135 −1205.875 −7.901


The interactions between the components in two-component systems can be further analyzed by examining the pair correlation function, which gives a measure of the probability of finding another atom at a distance r from a specific atom.35 Moreover this concept also embraces the idea that the atom at the origin and the atom at distance r may be of different chemical species A and B. The resulting function gAB(r) is also sometimes referred to as the radial distribution function (RDF), which is calculated by the average of the static relationship of every given pair of particles AB as follows:

 
image file: c3ra46275g-t1.tif(2)
where 〈nAB(r)〉 is the average number of atom pairs between r and r + Δr and ρAB is the density of atom pairs of type AB.

The pair correlation function has found applications in structural investigations of both solid and liquid packing (local structure), in studying specific interactions such as hydrogen bonding, and in statistical mechanical theories of liquids and composites. Hydrogen bonding, strong vdw force, and weak vdw force refer to interactions between atoms at distances of 2.6–3.1, 3.1–5.0, and above 5.0 Å, respectively.36 Although hydrogen bonding is weaker than chemical bonding, it is the strongest physical force among intermolecular actions.

Two types of H-bonds, each with its own pair correlation function, exist in AO-60/NBR. In the pair correlation function of H (AO-60) and N (NBR), the hydrogen atoms of AO-60 and the nitrogen atoms of NBR are set as A and B (see formula (2)), respectively. The calculated pair correlation function for H (AO-60) and N (NBR) is shown in Fig. 5(a). Similarly, the pair correlation function of the hydrogen atoms of AO-60 and the oxygen atoms of the carbonyl groups of AO-60 molecules was calculated and is shown in Fig. 5(b).


image file: c3ra46275g-f5.tif
Fig. 5 Pair correlation functions for (a) H (AO-60) and N (NBR) and (b) H (AO-60) and O (AO-60) in the AO-60/NBR (18/100) composites.

Fig. 5(a) shows the pair correlation function of H (AO-60) and N (NBR). Within the scope of 0–5.0 Å, the peak is located in 2.2–2.8 Å, suggesting that the interaction between the two atoms is hydrogen bonding. Another peak lies in 3.1–3.6 Å, suggesting the existence of strong vdw force between the two atoms. But the peak attributable to hydrogen bonding is dominant, indicating that most of the interaction between H (AO-60) and N (NBR) is hydrogen bonding.

Similarly, in Fig. 5(b), within the scope of 0–10.0 Å, the peaks are located in 2.4–3.1 Å and above 5.0 Å, suggesting the existence of hydrogen bonding and weak vdw force, respectively. The intensity of the peaks in Fig. 5(b) is lower than that of the peaks in Fig. 5(a). Therefore, the hydrogen bonding between H (AO-60) and N (NBR) is the dominant interaction in the AO-60/NBR (18/100) composite.

FFV can be defined as the fraction of the volume not occupied by the polymer. A well-known empirical equation can be used to calculate FFV:

 
image file: c3ra46275g-t2.tif(3)
where Vo = 1.3 Vw is the occupied volume, V is the specific volume, and Vw is the van der Waals volume obtained from the van der Waals surface without using Bondi's group contribution method. Because V and Vo depend on the temperature of the system, it is expected that FFV will likewise vary with temperature.37 In the MD simulations, the FFV is determined at 298.0 K by a grid scanning method with a probe radius of 0.0 Å, and the selected probe can detect the most accurate free volume in the cell. Fig. 6 shows the three-dimensional representation of FFV in AO-60/NBR with different mass ratios. The free volume increases with increasing AO-60 content because the organic particles (AO-60) affect the motion of the polymer chains (NBR).38


image file: c3ra46275g-f6.tif
Fig. 6 Three-dimensional representations of FFV in AO-60/NBR with different mass ratios, where blue area represents free volume and gray area represents occupied volume.

Fig. 7 shows the FFV of AO-60/NBR composites calculated by MD simulations. Because of the H-bonds, the FFVs of AO-60/NBR composites (mass ratios of 18/100 and mass ratio of 36/100) are lower than that of NBR. The FFV is lowest in the AO-60/NBR (36/100) composite because the strongest H-bond interaction and highest binding energy lead to the closest chain packing. As the AO-60 content exceeds 36 phr, the steric hindrance effect will affect the chain packing in the composites and more free AO-60 small molecules exist. The FFV of a AO-60/NBR composites is decided by two factors: the interaction between NBR and AO-60 and the amount of the AO-60 molecules in the system. A weak interaction and large amount of aggregated small particles would increase the FFV.


image file: c3ra46275g-f7.tif
Fig. 7 Fractional free volume of AO-60/NBR composites calculated by MD simulations.

By MD simulation, the H-bonds, binding energy, and FFV of the AO-60/NBR composites are calculated. The AO-60/NBR (36/100) composite has the largest H-bonds, the highest binding energy, and the smallest FFV, all of which result in the closest chain packing, the smallest space for the free motion of polymer chains and the highest internal friction and energy dissipation to break the H-bonds, all indications of a good compatibility of NBR and AO-60 and good damping performance of AO-60/NBR composites. But after the content of AO-60 is exceed 36 phr, the H-bonds decrease. Moreover, the binding energy becomes negative, which show that the composites appear incompatible and phase separation appear. In order to further verify our analysis, we will use experimental means below.

3 Experiments and comparison with theoretical results

3.1 Materials

NBR (N220S) with an acrylonitrile mass fraction of 41% was provided by Japan Synthetic Rubber Co., Ltd. (Tokyo, Japan). AO-60, in the form of powder, was purchased from Beijing Additives Institute (Beijing, China). The chemical structure of AO-60 and NBR is shown in Fig. 1(a) and (b) respectively. Since the AO-60 is a common hindered phenol antioxidant with four end hydroxyl groups and other polar functional groups (carbonyl or others) that can form strong intermolecular interactions with NBR, the AO-60/NBR composites are likely to have good filler/matrix interfacial properties. Other chemicals and ingredients were purchased in China. All materials were used without further purification.

3.2 Preparation of AO-60/NBR composites

AO-60/NBR rubber composites were prepared according to the following procedures: (1) after the as-received NBR was kneaded on a Φ 152.4 mm two-roll mill at room temperature for 3 min, AO-60 was added in the AO-60/NBR mass ratios of 0/100, 18/100, 36/100, 55/100, 73/100, and 91/100, respectively. These composites were then kneaded at room temperature for 5 min to prepare the first-stage AO-60/NBRa composites. (2) The AO-60/NBRa composites were kneaded on the two-roll mill at 130 °C for 5 min to fully fuse the AO-60 small molecules before the composites were gradually cooled to room temperature to form the second-stage AO-60/NBRb composites. (3) The AO-60/NBRb composites were then blended with compounding and crosslinking additives, including 5.0 phr of zinc oxide, 2.0 phr of stearic acid, 0.5 phr of dibenzothiazole disulfide, 0.5 phr of diphenyl guanidine, 0.2 phr of tetramethylthiuram disulfide, and 2.0 phr of sulfur. The composites were then kneaded on the two-roll mill at room temperature for 10 min. (4) Finally, the composites were hot-pressed and vulcanized at 160 °C under the pressure of 15 MPa for different periods of time, and then naturally cooled down to room temperature to prepare the AO-60/NBR samples. The optimum vulcanization time was pre-determined for each composite by using a disc rheometer (P355C2) purchased from Huanfeng Chemical Technology and Experimental Machine Co. (Beijing, China).

3.3 Characterization

FTIR measurements were made with a Nicolet 8700 FTIR spectrometer made by Thermo Fisher Scientific Inc. (USA). The FTIR spectra were obtained by scanning the specimens for 32 times in the wavenumber range of 400 cm−1 to 4000 cm−1 with a resolution of 8 cm−1. The FTIR spectra of AO-60/NBR composites were acquired from sheet specimens with a thickness of approximately 1 mm by using the attenuated total reflection (ATR) technique. The FTIR spectra of the as-received AO-60 powder were acquired by using ultra-thin disk specimens pressed from AO-60 ground in anhydrous potassium bromide (KBr). 1H-NMR spectra were obtained on a Bruker Avance spectrometer operating at 400.13 MHz for proton. CDCl3 was used as the solvent for the NMR measurements. DSC measurements were performed on a TGA/DSC calorimeter made by Mettler-Toledo Co (Switzerland). Samples weighing about 10 mg and sealed in aluminum were heated from −60 °C to 150 °C at a heating rate of 10 °C min−1 under a nitrogen atmosphere. The value of Tg was identified by the midpoint of the transition region. The dynamic mechanical measurements were carried out in a tension mode by using a VA 3000 dynamic mechanical analyzer (DMA) made by Rheometric Scientific Inc. (USA). The parallelepiped samples were 12 mm long, 6 mm wide, and about 2 mm thick. The temperature dependence of the loss factor (tan[thin space (1/6-em)]δ) for various samples was measured between −50 °C and 100 °C at a constant frequency of 1 Hz and a heating rate of 5 °C min−1.

3.4 FTIR analysis of hydrogen bonds in AO-60/NBR composites

FTIR spectroscopy has proven to be a powerful tool for investigating hydrogen bonding in a qualitative manner. To examine the intermolecular interaction between NBR and AO-60, the FTIR measurements of pure AO-60 and AO-60/NBR composites were obtained. Fig. 8 shows the FTIR spectra of AO-60 and AO-60/NBR composites. The telescopic vibration of –OH is usually absorbed in the wavenumber range 3125–3704 cm−1.29 The spectrum for AO-60 indicates the significant absorptions in 3550–3675 cm−1 and 3350–3550 cm−1, which are assigned to the –OH vibrations caused by free –OH and the OH–OH interactions (O–H⋯O hydrogen bonds) between AO-60 molecules, respectively.15 In Fig. 8(b), the spectrum of the neat NBR hardly reveals any absorbance band in the wavenumber range 3300–4000 cm−1, whereas the spectra of the AO-60/NBR composites indicate significant peaks at 3638 cm−1 and 3599 cm−1, corresponding to the free –OH of AO-60. Moreover, at AO-60 contents higher than 36 phr, the band at about 3638 cm−1 (assigned to free –OH) increases with increasing AO-60 content, because of increasing aggregation of AO-60 small molecules. In contrast, as seen in Fig. 8(b), a blue shift from 3489 cm−1 to 3570 cm−1 occurs, which can be attributed to the hydrogen bonding between the –OH groups of AO-60 (Fig. 1(a), 1 and 2) and the –CN groups of NBR (Fig. 1(b), 5).
image file: c3ra46275g-f8.tif
Fig. 8 FTIR/TR spectrum of (a) AO-60, and FTIR/ATR spectra of (b) AO-60/NBR composites at various compositions. (The black arrow indicates a blue shift.)

3.5 1H Nuclear magnetic resonance spectra of AO-60/NBR composites

In order to further prove the above conjecture of the H-bonds of the AO-60/NBR composites, 1H-NMR spectroscopy was used to study the structures of the composites. The basic principle of NMR is closely related to the energy level transition of the nucleus, and NMR directly reflect the physical properties of the materials from the microscopic view.39 Fig. 9 shows the 1H-NMR spectra of NBR and AO-60 small molecule. Within the scope of δ5.3–5.7 ppm in Fig. 9(a), there are two strong spikes at 5.41 and 5.54 ppm, standing for the peak of the hydrogen atom of cis-polybutadiene and the peak of the hydrogen atoms of the trans-polybutadiene chemical shift, respectively (Fig. 9(a), 1).40 From δ3.1 to 5.1 ppm, there is no peak in the 1H-NMR spectrum of NBR, but there are some characteristic peaks the 1H-NMR spectrum of AO-60 (see Fig. 9(b)). The peak of the protons of the methylene group connected to the ester group of AO-60 (Fig. 9(b), 3) is at 4.08 ppm. The peak of the protons of the phenolic hydroxyl of AO-60 (Fig. 9(b), 2) is at 5.06 ppm. The other characteristic peaks of AO-60 are at 1.42 ppm and 6.98 ppm, corresponding to the peak of the hydrogen atoms of the tertiary butyl on the benzene rings (Fig. 9(b), 6) and the peak of hydrogen atoms of the benzene rings (Fig. 9(b), 1), respectively.
image file: c3ra46275g-f9.tif
Fig. 9 1H-NMR spectra of NBR and AO-60 small molecule.

Fig. 10 shows 1H-NMR spectra of AO-60/NBR composites with different AO-60 contents. From Fig. 10, we can see that the content of AO-60 affects the spectra of the AO-60/NBR composites. With the increase of AO-60 content (the mass ratio of AO-60 to NBR > 18), the characteristic peaks of AO-60 appear in the spectra of the composites. Moreover, the peaks increase in height and become more acute with the increase of AO-60 content.


image file: c3ra46275g-f10.tif
Fig. 10 1H-NMR spectra of AO-60/NBR composites with different AO-60 contents.

The hydrogen bonding association effect will reduce the electron cloud density of the protons. As a result, the NMR peak will move in the direction of lower field.39,41 The change in the range of the peak of the protons is closely related to the degree of the hydrogen bonding association effect. The higher the association effect, the greater the peak range.42,43 Therefore, in this study, we studied the chemical shift of the protons of the hydroxyl group, which easily forms hydrogen bonds. In the 1H-NMR spectrum of the pure AO-60, the integral band intensity of the peak of methylene –CH2 should be two times as high as that of the peak phenolic hydroxyl –OH. Now, Fig. 11 shows the change or shift of the hydroxyl peak of hydroxyl after the normalization of the methylene peaks of the different composites. It can be seen that the hydroxyl peak broadens and the chemical shift moves towards lower field after the addition of AO-60 small molecule, possibly because of the hydrogen bonds formed in the AO-60/NBR composites, consistent with the FTIR results above. From Fig. 11, the width of the peak decreases with increasing AO-60 content (the mass ratio AO-60 to NBR > 36), indicating that the effect of hydrogen bonding is weakening.


image file: c3ra46275g-f11.tif
Fig. 11 Comparison of H (phenolic hydroxyl group, 5.06 ppm) with H (methane group, 4.08 ppm) in 1H-NMR spectra of various AO-60/NBR composites.

3.6 Glass transition of AO-60/NBR composites

Fig. 12 shows the DSC thermograms of the AO-60/NBR composites with different mass ratios. AO-60 is a typical polar organic crystalline material with a melting point of 124.5 °C. After being heated to above its melting point AO-60 melts completely. Amorphous AO-60 is obtained by quenching the molten AO-60 in liquid nitrogen.
image file: c3ra46275g-f12.tif
Fig. 12 DSC thermograms of AO-60/NBR composites.

It can be seen from Fig. 12 that after the addition of AO-60, the glass transition temperatures of the composites increases over that of the pure NBR matrix. This increase is due to the hydrogen bond network formed between the NBR and the AO-60, consistent with the previous analysis. When the content of AO-60 is above 36 phr, the glass transition temperatures of the composites change little. Because the matrix is saturated with the dissolved AO-60, the AO-60 molecules have achieved the maximum dispersion in the matrix, and the strong intermolecular interaction formed between the AO-60 molecules and NBR polymer chains has also reached the maximum value. The temperature of 46 °C on the DSC curves is the glass transition temperature of the amorphous AO-60 that has aggregated in the matrix.38 With the increase in AO-60 content, more AO-60 aggregates in the matrix, the peak at 46 °C shift becomes more and more obvious. The DSC results show that the AO-60/NBR composites (AO-60 content > 36 phr) have a two-phase structure: the NBR matrix region and the AO-60 aggregation region, which is consistent with the MD simulation results.

3.7 Dynamic mechanical properties

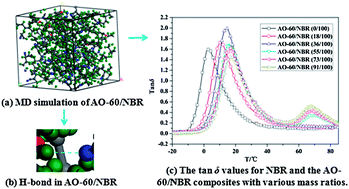
DMA was conducted to study the phase structure of the AO-60/NBR composites. DMA provides an accuracy analysis of the miscibility of polymers. Fig. 13 shows the temperature dependence of the loss tangent (tan[thin space (1/6-em)]δ) values for NBR and the AO-60/NBR composites with various mass ratios. The damping performance of polymeric materials is determined mainly by its viscoelastic behavior in the transitional region between the glassy and rubbery states (near Tg).1 In this region, macromolecular chain segments, but not entire macromolecules, tend to vibrate in phase with an external vibration. However, molecular conformation changes usually cannot keep up with the imposed vibration, resulting in internal friction and energy dissipation.8,44 Therefore, the higher the tan[thin space (1/6-em)]δ value the better the damping performance of the material.
image file: c3ra46275g-f13.tif
Fig. 13 Temperature dependence of the loss tangent (tan[thin space (1/6-em)]δ) values for NBR and the AO-60/NBR composites with various mass ratios.

Fig. 13 shows that the tan[thin space (1/6-em)]δ peak of AO-60/NBR gradually shifts to higher temperatures with increasing AO-60 content. The shift was mainly due to the hydrogen bonding between the AO-60 molecules and the NBR matrix. Specifically, at AO-60 contents lower than 36 phr, there is only one tan[thin space (1/6-em)]δ peak, indicating a high compatibility of AO-60 molecules with the NBR matrix. However, as the AO-60 content exceeds 36 phr, two tan[thin space (1/6-em)]δ peaks appear, an indication of phase separation. The DSC results presented above have indicated that the AO-60 dispersion reached saturation at an AO-60 content of 36 phr. The excessive AO-60 small molecules gathered, leading to the appearance of two phases in the composites, and hence a second tan[thin space (1/6-em)]δ peaks. This is just a validation to our MD simulation analysis. Table 3 shows the values of the two tan[thin space (1/6-em)]δ peaks in NBR and AO-60/NBR composites with different AO-60 contents. As the AO-60 content increases from 0 phr to 36 phr, the first tan[thin space (1/6-em)]δ peak first increases then decreases. The AO-60/NBR (36/100) composite has the highest and broadest first tan[thin space (1/6-em)]δ peak, indicating the strongest interaction between NBR and AO-60, and excellent damping properties of AO-60/NBR composites. The strongest interaction can reduce the mobility of NBR chain segments and cause high energy dissipation. The second tan[thin space (1/6-em)]δ peak continues to increase with increasing AO-60 content from 55 phr to 91 phr because of increasing AO-60 aggregation. According to the analysis above, the kind of H-bond(a) O–H⋯O between the phenolic hydroxyl groups –OH of AO-60 lead to the second peak on the DMA curves. The damping properties of AO-60/NBR composites have been improved over those of pure NBR, especially in the high temperature region.

Table 3 Values of the two tan[thin space (1/6-em)]δ peaks in NBR and AO-60/NBR composites with different AO-60 contents
Samples Value of tan[thin space (1/6-em)]δmax
First peak Second peak
AO-60/NBR (0/100) 1.60
AO-60/NBR (18/100) 1.73
AO-60/NBR (36/100) 2.00
AO-60/NBR (55/100) 1.68 0.35
AO-60/NBR (73/100) 1.62 0.43
AO-60/NBR (91/100) 1.45 0.52


4 Conclusions

We have performed MD simulations and experiments to analyze the correlation between the microstructure and damping properties of AO-60/NBR composites and explore the microscopic mechanism for improving the damping properties. The MD simulation is used to calculate the H-bonds, binding energy, and FFV of the AO-60/NBR composites. The AO-60/NBR (36/100) composite has the largest H-bonds, the highest binding energy, and the smallest FFV. After the content of AO-60 exceeds 36 phr, the H-bonds decrease. Moreover, the binding energy becomes negative, which show that the composites appear to be incompatible and phase separation occurs. FTIR and 1H-NMR results show that there are two kinds of H-bonds formed in the AO-60/NBR composites: O–H (AO-60)⋯OC (AO-60) and O–H (AO-60)⋯NC (NBR). The higher the number of H-bonds is in the AO-60/NBR composite, the better the damping properties of the composite are. DSC and DMA analyses show that at AO-60 contents above 36 phr, the number of H-bonds will decrease with increasing AO-60 content, and the redundant AO-60 will aggregate in the composite. The AO-60/NBR composite has a two-phase structure: the NBR matrix region and the AO-60 aggregation region. Phase separation appears when the AO-60 content is above 36 phr, which is consistent with the MD simulation results. Therefore, the combined simulation and experimental study could provide theoretical guidance for understanding the damping mechanism on a molecular level.

Acknowledgements

The financial supports of the National Natural Science Foundation of China under Grant no. 51221002 are gratefully acknowledged.

Notes and references

  1. A. A. Gusev, K. Feldman and O. Guseva, Macromolecules, 2010, 43, 2638–2641 CrossRef CAS.
  2. Y. Q. Wang, Y. Wang, H. F. Zhang and L. Q. Zhang, Macromol. Rapid Commun., 2006, 27, 1162–1167 CrossRef CAS.
  3. S. Joseph, P. A. Sreekumar, J. M. Kenny, D. Puglia, S. Thomas and K. Joseph, Polym. Compos., 2010, 31, 236–244 CAS.
  4. P. Xiang, X. Y. Zhao, D. L. Xiao, Y. L. Lu and L. Q. Zhang, J. Appl. Polym. Sci., 2008, 109, 106–114 CrossRef CAS.
  5. J. E. Mark, Rubberlike Elasticity, Wiley-Interscience, New York, 2nd edn, 2007 Search PubMed.
  6. C. Wu, T. A. Yamagishi, Y. Nakamoto, S. I. Ishida, K. H. Nitta and S. Kubota, J. Polym. Sci., Part B: Polym. Phys., 2000, 38, 1341–1347 CrossRef CAS.
  7. C. Wu, T. A. Yamagishi, Y. Nakamoto, S. Ishida, K. H. Nitta and S. Kubota, J. Polym. Sci., Part B: Polym. Phys., 2000, 38, 2285–2295 CrossRef CAS.
  8. X. Y. Zhao, P. Xiang, M. Tian, H. Fong, R. Jin and L. Q. Zhang, Polymer, 2007, 48, 6056–6063 CrossRef CAS PubMed.
  9. X. Y. Zhao, Y. L. Lu, D. L. Xiao, S. Z. Wu and L. Q. Zhang, Macromol. Mater. Eng., 2009, 294, 345–351 CrossRef CAS.
  10. C. Wu, Y. Otani, N. Namiki, H. Emi, K. H. Nitta and S. Kubota, J. Appl. Polym. Sci., 2001, 82, 1788–1793 CrossRef CAS.
  11. Q. Liu, H. Zhang and X. Yan, Iran. Polym. J., 2009, 18, 401–413 CAS.
  12. T. Sajjayanukul, P. Saeoui and C. Sirisinha, J. Appl. Polym. Sci., 2005, 97, 2197–2203 CrossRef CAS.
  13. A. Omayu, T. Ueno and A. Matsumoto, Macromol. Chem. Phys., 2008, 209, 1503–1514 CrossRef CAS.
  14. M. C. Senake Perera, U. S. Ishiaku and Z. A. Mohd, Eur. Polym. J., 2001, 37, 167–178 CrossRef CAS.
  15. X. Y. Zhao, Y. J. Cao, H. Zou, J. Li and L. Q. Zhang, J. Appl. Polym. Sci., 2011, 123, 3696–3702 CrossRef.
  16. I. V. Stiopkin, C. Weeraman, P. A. Pieniazek, F. Y. Shalhout, J. L. Skinner and A. V. Benderskii, Nature, 2011, 474, 192–195 CrossRef CAS PubMed.
  17. S. H. Kim, J. P. Tan, F. Nederberg, K. Fukushima, J. Colson, C. Yang, A. Nelson, Y. Y. Yang and J. L. Hedrick, Biomaterials, 2010, 31, 8063–8071 CrossRef CAS PubMed.
  18. C. T. Lin, S. W. Kuo, C. F. Huang and F. C. Chang, Polymer, 2010, 51, 883–889 CrossRef CAS PubMed.
  19. P. Sivagurunathan, K. Dharmalingam and K. Ramachandran, J. Solution Chem., 2006, 35, 1467–1475 CrossRef CAS.
  20. S. Tsuzuli, H. Tokuda and M. Mikami, Phys. Chem. Chem. Phys., 2007, 9, 4780–4784 RSC.
  21. S. K. Kandasamy, D. K. Lee, R. P. Nanga, J. Xu, J. S. Santos, R. G. Larson and A. Ramamoorthy, Biochim. Biophys. Acta, Biomembr., 2009, 1788, 686–695 CrossRef CAS PubMed.
  22. O. F. Lange, D. Van der Spoel and B. L. De Groot, Biophys. J., 2010, 99, 647–655 CrossRef CAS PubMed.
  23. K. R. Wilson, M. Cavalleri, B. S. Rude, R. D. Schaller, A. Nilsson, L. G. M. Pettersson, N. Goldman, T. Catalano, J. D. Bozek and R. J. Saykally, J. Phys.: Condens. Matter, 2002, 14, 221–226 CrossRef.
  24. K. Miura, K. Mae, W. Li, T. Kusakawa, F. Morozumi and A. Kumano, Energy Fuels, 2001, 15, 599–610 CrossRef CAS.
  25. J. Sacristan and C. Mijangos, Macromolecules, 2010, 43, 7357–7367 CrossRef CAS.
  26. C. Peter and K. Kremer, Soft Matter, 2009, 5, 4357–4366 RSC.
  27. S. W. Bunte and H. Sun, J. Phys. Chem. B, 2000, 104, 2477–2489 CrossRef CAS.
  28. M. Khalili, A. Liwo, A. Jagielska and H. A. Scheraga, J. Phys. Chem. B, 2005, 109, 13798–13810 CrossRef CAS PubMed.
  29. B. Qiao, X. Y. Zhao, D. M. Yue, L. Q. Zhang and S. Z. Wu, J. Mater. Chem., 2012, 22, 12339–12348 RSC.
  30. J. Colmenero, F. Alvarez and A. Arbe, Phys. Rev. E: Stat., Nonlinear, Soft Matter Phys., 2002, 65, 1804–1815 CrossRef.
  31. J. E. Basconi and M. R. Shirts, J. Chem. Theory Comput., 2013, 9, 2887–2899 CrossRef CAS.
  32. J. Davoodi and M. Ahmadi, Composites, Part B, 2012, 43, 10–14 CrossRef PubMed.
  33. M. Karplus and J. A. McCammon, Nat. Struct. Mol. Biol., 2002, 9, 646–652 CAS.
  34. X. F. Ma, W. H. Zhu, J. J. Xiao and H. M. Xiao, J. Hazard. Mater., 2008, 156, 201–207 CrossRef CAS PubMed.
  35. X. J. Wang, J. J. Xiao, W. H. Zhu, H. Sun and H. M. Xiao, J. Hazard. Mater., 2009, 167, 810–816 CrossRef PubMed.
  36. A. Mattozzi, M. S. Hedenqvist and U. W. Gedde, Polymer, 2007, 48, 5174–5180 CrossRef CAS PubMed.
  37. B. Wang, Z. F. Wang, M. Zhang and S. J. Wang, Macromolecules, 2002, 35, 3993–3996 CrossRef CAS.
  38. X. Y. Zhao, P. Xiang and L. Q. Zhang, Acta Mater. Compositae Sin., 2007, 24, 44–49 CAS.
  39. S. Lee, Y. Hua, H. Park and A. H. Flood, Org. Lett., 2010, 12, 2100–2102 CrossRef CAS PubMed.
  40. Z. Denchev, H. R. Kricheldorf and S. Fakirov, Macromol. Chem. Phys., 2001, 202, 574–586 CrossRef CAS.
  41. B. Kuhn, P. Mohr and M. J. Stahl, Med. Chem., 2010, 53, 2601–2611 CrossRef CAS PubMed.
  42. V. Balevicius, Z. Gdaniec, K. Aidas and J. Tamuliene, J. Phys. Chem. A, 2010, 114, 5365–5371 CrossRef CAS PubMed.
  43. R. J. Abraham, M. Mobli and R. J. Smith, Magn. Reson. Chem., 2003, 41, 26–36 CrossRef CAS PubMed.
  44. J. Suhr, W. Zhang, P. M. Ajayan and N. A. Koratkar, Nano Lett., 2006, 6, 219–223 CrossRef CAS PubMed.

This journal is © The Royal Society of Chemistry 2014