 Open Access Article
Physics-informed Gaussian process regression of in operando capacitance for carbon supercapacitors†
Runtong
Pan
 a,
Mengyang
Gu
 b and
Jianzhong
Wu
 *a
*a
aDepartment of Chemical and Environmental Engineering, University of California, Riverside, CA 92521, USA. E-mail: jwu@engr.ucr.edu
bDepartment of Statistics and Applied Probability, University of California, Santa Barbara, CA 93106, USA
First published on 17th April 2023
Abstract
Amorphous porous carbons are one of the most popular electrode materials for energy storage owing to their high electrical conductivity, large specific surface area and low-production cost. Both physics-based models and machine learning (ML) methods have been used to correlate the electrochemical behavior of carbon electrodes, including electric-double-layer (EDL) capacitance, energy density, charging dynamics, and the Ragone diagram. While ML methods are applicable to systems remote from equilibrium, the lack of physical inputs may lead to erroneous predictions of in operando capacitance at high charging–discharging rates for electrodes with high mesopore surface areas. In this work, we introduce a physics-informed Gaussian process regression (PhysGPR) method to predict the capacitance of pristine carbon electrodes in aqueous solutions of 6 M KOH over a broad range of conditions. We demonstrate that PhysGPR has major advantages in comparison with conventional GPR (ConvGPR) and other ML methods such as artificial neuron network (ANN) for predicting in operando capacitance as a function of the pore characteristics and the scan rate. By incorporating physical models into a supervised setting, PhysGPR provides better numerical performance in comparison with alternative ML methods, avoids unphysical predictions such as negative capacitance or increasing EDL capacitance with rising charging–discharging rate, and works well in a wider range of parameter space, especially for materials with a high mesopore surface area, thereby offering a faithful description of the capacitive behavior of carbon electrodes.
Introduction
Supercapacitors have attracted great interest over the past few decades for their potential use in electrical energy storage. This type of electrochemical device is particularly useful for rapid electricity storage due to the high-power density and cycling efficiency. In comparison with alternative energy-storage methods, supercapacitors have an energy and power density in between those corresponding to the dielectric capacitors and electrochemical batteries, thereby filling the gap in practical applications.1Recent developments of supercapacitors are mostly directed at maximizing the energy and power density through enhancing electric double layer (EDL) capacitance and/or electrochemical pseudocapacitance.1,2 EDL capacitance refers to electrostatic polarization of the electrolyte charges due to the uneven distributions of ionic species near the electrode surface. Because the electrical energy is accumulated in terms of the ionic charges, the EDL capacitance, and thus the energy and power density, can be amplified by optimizing the specific surface areas of porous electrodes and by matching the geometric characteristics of ionic species and electrode pores.3 Conversely, electrochemical pseudocapacitance arises from charge transfer between the electrolyte and electrode or from the intercalation of ionic species in the micropores.4 In this case, the electrical energy is stored through faradaic reactions and/or electrosorption. While physics-based models for describing EDL capacitance have been well advanced, the quantitative description of electrochemical pseudocapacitance remains a theoretical challenge owing to the strong coupling of electronic and ion charges in EDL.5
Carbon electrodes are commonly used for supercapacitors because of large specific surface area, high electrical conductivity, long-term cycling stability and low production cost.2 Many kinds of porous carbons can be adopted to enhance the capacitive performance for energy storage, including carbon nanotubes and fibers, active carbon from coal or biomass, graphene and carbide-derived carbons.6 While ultra-high EDL capacitance, up to 250 F g−1, has been reported for pristine carbon electrodes,7,8 further improvements can be achieved by introducing pseudocapacitance, e.g., by doping porous carbon with electro-active elements like O, N, S or P, or by coating metal or metal oxides of Al, Fe, Mn, etc. at carbon surfaces.9 Whereas a large specific surface area and an appropriate pore structure are crucial to achieve high energy density and charge/discharge rates, the rational design and optimization of carbon electrodes remain difficult due to many other factors influencing the supercapacitor performance. For example, it is often assumed that the EDL capacitance would increase with the specific surface area of the electrode material. While micropores (pore diameter d < 2 nm) would provide higher specific surface area than mesopores (2 nm < d < 50 nm) and macropores (d > 50 nm), their contributions to EDL capacitance are often considered less significant in comparison to those from mesopores because of the increased resistance of ion transport2,10 and limited ion accessibility.11–13 Inconsistent experimental results were reported when the pore sizes are comparable to those of the ionic species, yet theoretical investigations are not conclusive due to the difficulties in the characterization of the pore structure and surface composition of electrode materials.14–17 While several experimental and computational works have been reported suggesting the significant improvement of capacitive performance through doping carbon electrodes with heteroatoms, a comprehensive description of the doping effects on pseudocapacitive response is yet to be developed.
The efficiency of electrical energy storage depends not only on the electrode materials but also on the properties of the matching electrolyte as well as the operation conditions such as the electrochemical potential window and the charging–discharging rates. Typically, the EDL capacitance decreases with the operational potential and the charging–discharging rates. Because an increased charging–discharging rate leads to a higher resistance in ion transport, the reduction of capacitance is most significant for electrode materials with high micropore surface areas.8 As the supercapacitance performance is often measured under conditions remote from thermodynamic equilibrium, the dynamic processes are not well described by conventional EDL models or molecular dynamics (MD) simulation.
In addition to physics-based modeling, machine learning (ML) methods have been used to predict the performance of carbon materials for energy storage. For example, an artificial neuron network (ANN) was used for quantitative correlations between the EDL capacitance and the physicochemical features of carbon materials, such as specific surface area, pore volume, the defects of the carbon structure, and doping elements under the same charging–discharging rate.18 Similar correlations were established by using regression trees (RT) and multi-layer perception (MLP) models.19 ANN was also used to describe the synergetic effect of N/O doping on supercapacitor performance20 and the EDL capacitance in terms of the physical features of carbon materials and the changing current density.21 In our previous publications, we tested multiple ML methods to predict the EDL capacitance and pseudocapacitance in response to the changing scan rate of cyclic voltammetry and identified important pore characteristics of carbon materials with high energy-storage efficiency.7,22 While the data-driven approach was able to make valuable predictions of supercapacitance performance, the pitfalls of conventional ML methods have also been well documented, in particular in terms of interpretability, reliability in extrapolation, and uncertainty quantification. Ideally, the ML models should be physically interpretable and provide adequate uncertainty assessment. In principle, the interpretability of ML methods can be greatly enhanced by incorporating the physics-based analysis of the constraints and underlying connections between the input and output variables. Meanwhile, the issues with reliability and uncertainty analysis can be addressed with statistical methods such as Gaussian process regression (GPR).23,24 GPR has been previously used to investigate the degradation of electrochemical pseudocapacitors at high temperature and the life span of Li-ion batteries.25 However, we are unaware of its application to describing the in operando behavior of EDL capacitors.
In this work, we propose a physics-informed Gaussian process regression (PhysGPR) model to predict the capacitances of carbon electrodes based on the micropore and mesopore surface areas. A semi-empirical model for the charging dynamics is incorporated into GPR to avoid unphysical predictions. Unlike previous ML methods, PhysGPR provides uncertainty as well as the mean values in the prediction of EDL capacitance. To minimize the number of input variables, all training data are extracted from the in operando measurements of electrodes made of pristine active carbons or carbon nanotubes, with 6 M KOH solution as the working electrolyte. This solution condition is commonly adopted in testing the EDL capacitance of carbon electrodes.
Models and methods
We explain in this section the preparation of the dataset and mathematical details in constructing our physics-informed Gaussian process regression (PhysGPR) for predicting the EDL capacitance and power density of carbon electrodes. Scheme 1 shows schematically the training flow chart for PhysGPR in comparison with that for conventional ML methods. While the latter utilizes the experimental data directly, PhysGPR starts with a physics model analyzing the experimental results. In the present work, we adopt a phenomenological model to describe the variation of the EDL capacitance with the scan rate. The model parameters are then normalized (eqn (S4), ESI†) and serve as the input for the GPR training. The incorporation of the physical model eschews erroneous predictions that may take place in conventional ML methods.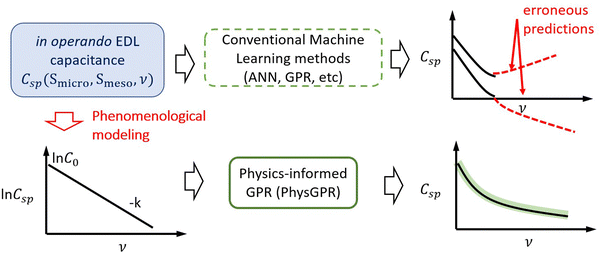 | ||
| Scheme 1 Physics-informed Gaussian process regression (PhysGPR) of experimental data for the capacitance of carbon electrodes from the cyclic voltammetry measurements. | ||
After a brief introduction of data selection, we describe a semi-empirical model for representing the dependence of EDL capacitance on the scan rate of cyclic voltammetry (CV). The physical model is then incorporated into GPR in the context of a supervised ML algorithm. All ML models used in this work are available from the Statistics and Machine Learning ToolboxTM in MATLAB. For comparison, the conventional GPR method is presented in the ESI.†![[thin space (1/6-em)]](https://www.rsc.org/images/entities/char_2009.gif) 23,26
23,26
Data collection
As mentioned above, the EDL capacitance depends on the properties of both the electrolyte and electrode as well as operating conditions such as the applied potential or current density. In this work, we consider carbon materials the same as those used in our previous publications.7,22 The same dataset is used as a benchmark for the calibration of PhysGPR and for comparison with conventional ML methods.7 All data points were collected from the literature27–33 and are reproduced in the ESI.† To minimize the number of input variables, we fix the electrolyte and operating conditions, i.e., 6 M KOH aqueous solution with 1 V maximum voltage in the potential window. Most experimental results were obtained with electrodes prepared by loading 5 mg of material on a 1 cm × 1 cm plate. All capacitance data were measured in three-electrode-cell settings which allow for a more precise potential and current control than two-electrode measurements. The charging–discharging rates are determined by the cyclic voltammetry scan rate in the range of 2 to 500 mV s−1 (most data are in the range of 5 to 200 mV s−1).The electrode materials investigated in this work are activated carbon materials without significant heteroatom doping. These materials are close to pristine carbon doped with a little hydrogen, sometimes with low-level oxygen. Due to their consistent chemical composition, the impact of pseudocapacitance is negligible. In the application of different ML methods, we use the scan rate, the surface area of micropores (<2 nm), and the surface area of mesopores (2–50 nm) as the input variables. Macropores do not make significant contributions to the electrochemical properties of carbon electrodes because the macropore surface is negligible in comparison to those of micropores and mesopores. Separating micro- and meso-pore contributions enables us to illustrate the per surface area capacitance and the pore-size effect independently. The surface areas reported by experiment were measured from N2 adsorption at 77 K. Because the diameters of hydrated ions and N2 molecules are comparable, the adsorption surface areas are expected to be similar, i.e., hydrated ions and N2 molecules have similar accessibility to the interior volumes of porous electrodes. While the EDL capacitance increases with the surface area of a carbon electrode, it does not vanish at zero micropore/mesopore surface area. For electrodes without micro and mesopores, the EDL capacitance would be sensitive to the electrode shape, particle size and packing geometry.34 The limiting case has little practical significance and the experimental data are not particularly meaningful from the ML perspective.
Physics-informed GPR
The charging dynamics of EDL capacitors can be described in terms of equivalent-circuit models or ion-transport equations.35 As observed in the experimental characterization of the electrode charging with cyclic voltammetry, the EDL capacitance decreases with the scan rate due to the reduction of time available for the accumulation of the electrode charge. Whereas sophisticated molecular models have been developed to describe the charging dynamics of carbon electrodes,36 for simplicity here we use a semi-empirical formula to correlate the specific EDL capacitance as a function of the scan rate37,38| Csp = C0e−kv | (1) |
The physics-informed GPR model (PhysGPR) is constructed by using the scan rate, the micropore surface area, and the mesopore surface area of the electrode material as input variables. In combining the semi-empirical formula with GPR, we set the artificial zero surface area points at 10−20 m2 g−1. To best fit the model parameters in eqn (1), we introduce two innovations different from conventional GPR models in describing one response value y with its corresponding observation x = [ν,Smicro,Smeso]. First, in combining the semi-empirical formula with GPR, we choose the natural logarithm of the EDL capacitance as the response vector instead of the capacitance
y ≡ ln![[thin space (1/6-em)]](https://www.rsc.org/images/entities/char_2009.gif) Csp = ln Csp = ln![[thin space (1/6-em)]](https://www.rsc.org/images/entities/char_2009.gif) C0 − kν C0 − kν | (2) |
where C0 and k are obtained by fitting the experimental data for Csp. The second innovation is to include the basis function, H(X), of the mean that consists of two components
| H(X) = [H1(Xmat),νH2(Xmat)] | (3) |
| y = [H1(Xmat),νH2(Xmat)][β1;β2] + z(Xmat) + ε ≡ H(X)β + z(Xmat) + ε | (4) |
ln![[thin space (1/6-em)]](https://www.rsc.org/images/entities/char_2009.gif) C0 → H1(Xmat)β1,−k → H2(Xmat)β2. C0 → H1(Xmat)β1,−k → H2(Xmat)β2. | (5) |
For any n inputs, the marginal distribution of lnCsp follows a multivariate normal distribution. Given a vector of observations, the predictive distribution also follows a normal distribution, and the predictive distribution of EDL capacitance Csp follows a log-normal distribution. Accordingly, the mean and standard deviation of the response value of any given response vector are given by
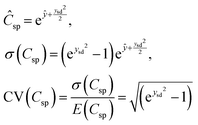 | (6) |
In this work, we compare the PhysGPR and ConvGPR models for fitting the experimental data. The automatic relevance determination (ARD) structure of the kernel is used to decouple different length scales underlying the variations in the scan rate and surface areas of micropores and mesopores. The ConvGPR models use the pure quadratic basis with ν, Smicro and Smeso as input variables. The basis functions in H(X) given by eqn (3) are used by both PhysGPR and ConvGPR. All input values are standardized before regression (eqn (S4), ESI†). The ARD kernels tested in this work include the squared exponential kernel (also known as RBF or the radial basis function kernel), Matérn 3/2 and 5/2 kernels, and the rational quadratic kernel.39 The exponential kernel was not selected because it yields erratic prediction of the EDL capacitance. In application of the ANN model with the Bayesian regularization, the backpropagation training function from our previous work is also shown for comparison.
For both GPR models tested in this work, the fitting parameters (including the kernel and variance parameter σ) are optimized with the k-fold cross validation method using a k value of 5 with 10 different repartitions. The training data are randomly divided into 5 subgroups. We sequentially take 1 of the subgroups as the test set and the other 4 as the training set to train the ML model. Each of the 5 different subgroups will be used as a test set and this process is repeated 10 times with a different division of the data each time to make the model more robust. The EDL capacitance was predicted by the final models using the fitting parameters found in cross validation. To evaluate the numerical performance of different ML models for correlating the experimental data, we use the cross-validation RMSE (CVRMSE) as the loss function:
 | (7) |
Results and discussion
Model evaluation
In the following, we first discuss the out of sample prediction of the experimental data set using the PhysGPR with different kernel functions. Next, we compare the results from PhysGPR with those from the conventional GPR and those from the ANN used in our previous work.7 The fitting hyperparameters are optimized by 5-fold cross validation (CV) with 10 repartitions (80% training, 20% test, trained 5 × 10 = 50 times). Fig. 1 and Table 1 summarize the correlations of the experimental data with different ML models.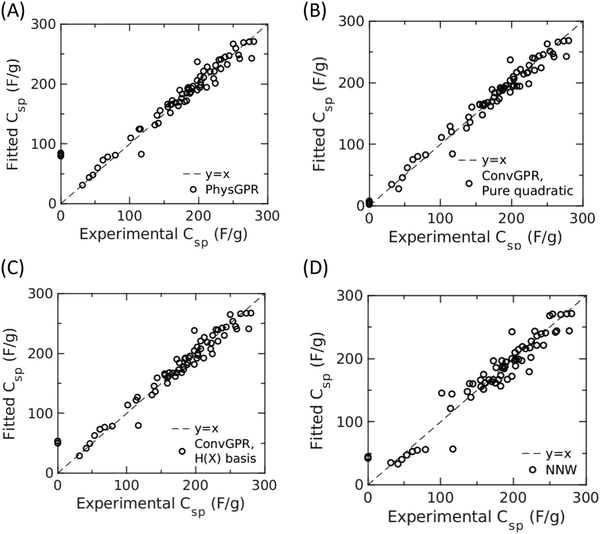 | ||
| Fig. 1 Correlation of experimental data for the specific capacitance of active carbons with the final model (the ML model that applies the CV-optimized fitting parameters and kernels) of different machine learning (ML) methods. In each panel, the diagonal line represents the perfect correlation. (A) Physics-informed GPR (PhysGPR) with automatic relevance determination (ARD) and squared exponential kernel; (B) conventional GPR (ConvGPR) with pure quadratic basis and ARD Matérn 3/2 kernel; (C) conventional GPR with H(X) basis (viz.eqn (3)) on capacitance and ARD rational quadratic kernel; and (D) artificial neural network (ANN). | ||
| ML method | Kernel or training function | CV root mean square error (CVRMSE) |
|---|---|---|
| PhysGPR | ARD Matérn 3/2 | 50.16 |
| ARD Matérn 5/2 | 38.35 | |
| ARD rational quadratic | 31.9511 | |
| ARD RBF | 31.9505 | |
| ConvGPR, pure quadratic basis | ARD Matérn 3/2 | 21.35 |
| ARD Matérn 5/2 | 21.59 | |
| ARD rational quadratic | 22.08 | |
| ARD RBF | 22.51 | |
| ConvGPR H(X) basis | ARD Matérn 3/2 | 34.89 |
| ARD Matérn 5/2 | 35.36 | |
| ARD rational quadratic | 34.67 | |
| ARD RBF | 37.34 | |
| ANN | Bayesian regularization | 36.70 |
| Standard deviation of data | — | 68.89 |
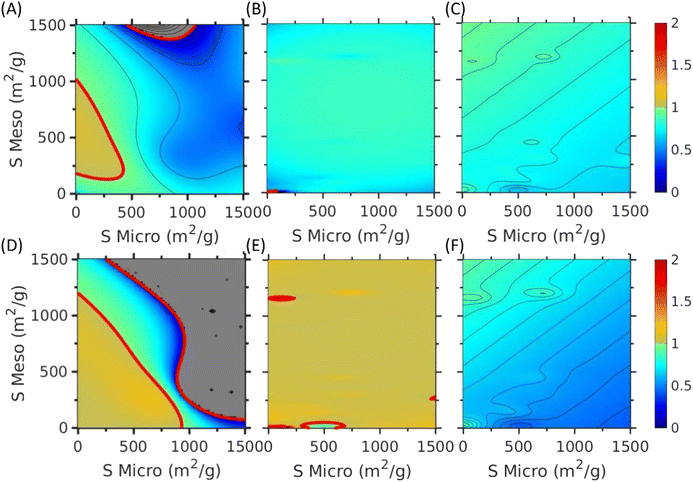
Both PhysGPR and ConvGPR are able to reproduce the experimental data for the EDL capacitance of carbon electrodes but with different accuracies. Among different ML methods tested in this work, conventional GPR with the ARD Matérn 3/2 kernel provides the best correlation (CVRMSE = 21.35). However, as shown in Fig. 2(A) and 3(C) and (D), ANN and ConvGPR predict that the EDL capacitance may increase with the scan rate, which is not physically meaningful. While ConvGPR with H(X) (viz., eqn (3)) correctly predicts the decline of the EDL capacitance at small scan rate, the trend is non-monotonic and the predicted EDL capacitance may become negative at high scan rate. The result is especially problematic when the ML model is applied out of the experimental data range. Besides, the cross-validation root mean square error (CVRMSE = 34.67) indicates the low accuracy of the H(X)-basis ConvGPR. By contrast, PhysGPR with the ARD squared exponential kernel (CVRMSE = 31.95) is able to correlate the experimental data better than the ANN model (CVRMSE = 36.70). Importantly, PhysGPR behaves well at the high scan rate. As shown in Fig. 1, none of the ML models catches the artificial zero surface area-zero capacitance data points. All ML models predict a small positive value around 50–100 F g−1. As mentioned above, for electrodes without micro and mesopores, the capacitance will be sensitive to the electrode shape, particle size and packing geometry. While the limiting case has little practical significance and the experimental data are not particularly meaningful, all ML methods are able to capture the trend.
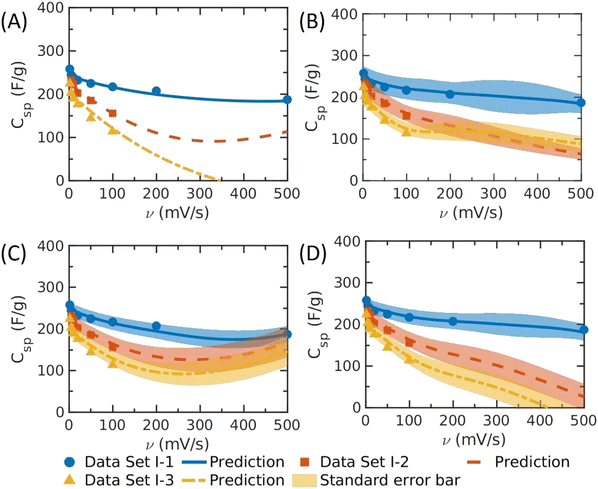 | ||
| Fig. 2 The specific capacitance (Csp) versus the scan rate (v) predicted by different machine-learning methods. (A) ANN (adapted from Fig. 3 of ref. 7), (B) PhysGPR with the rational quadratic kernel; (C) conventional GRP with pure quadratic basis and ARD Matérn 3/2 kernel; (D) conventional GRP with H(X) basis (viz.eqn (3)) on capacitance and ARD rational quadratic kernel. The lines show the predicted mean value, and the shadow shows the standard deviation predicted by GPR. The specific surface areas of electrode materials are: data set I-1: Smicro = 115 m2 g−1, Smeso = 1158 m2 g−1; data set I-2: Smicro = 636 m2 g−1, Smeso = 442 m2 g−1; and data set I-3: Smicro = 735 m2 g−1, Smeso = 1200 m2 g−1.7 | ||
We demonstrated in our previous work that ML methods can be used to predict the specific capacitance of carbon electrodes as a function of the scan rate.7 Among different ML models tested in that work, it was found that ANN provides the best correlation of the EDL capacitance as a function of the scan rate for most of the samples (e.g., Fig. 2(A) is directly adapted from Fig. 3 of ref. 7). Without a physical model as the guidance, the ANN prediction is problematic at least for certain electrode materials. As shown in Fig. 2(A) and (D), and the grey part in Fig. 4(A) and (D), both ANN and conventional GRP with H(X) basis may yield negative capacitance at high scan rate because of the lack of physical basis. Besides, as shown in Fig. 3(C), the EDL capacitance may increase with the scan rate when it is sufficiently large. The unphysical prediction is especially pronounced for those electrodes with high mesopore surface areas but relatively low micropore surface areas. Whereas ConvGPR has the same problem at high scan rate (>∼350 mV s−1), as shown in Fig. 3(D), the physics-informed GPR (PhysGPR) avoids the unphysical prediction because the scan-rate dependence of the capacitance is explicitly accounted for by using the semi-empirical model (eqn (1)). As shown in Fig. 2(B), and 3(A) and (B), the predictions by PhysGPR are satisfactory for all samples. It should be noted that the uncertainty of the GPR predictions can be quantified by the predictive interval (shaded area in Fig. 3(B)), while the predictive interval by ANN is not easily obtained.
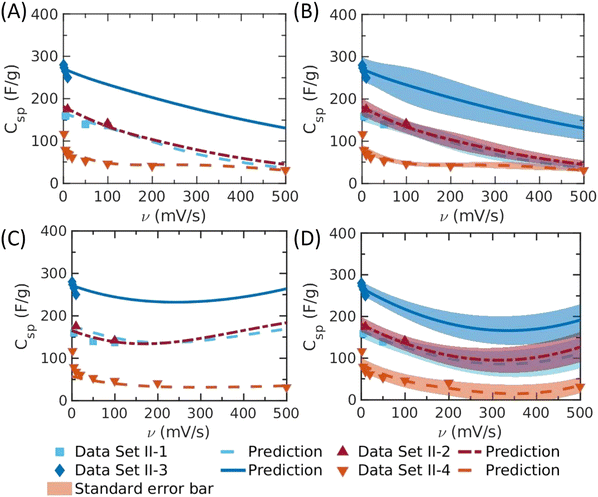 | ||
| Fig. 3 The specific capacitance (Csp) versus the scan rate (v predicted by different machine-learning methods). (A) The mean value predicted by PhysGPR with the rational quadratic kernel; (B) the same as panel A but with the standard error bar; (C) ANN, and (D) ConvGPR with the pure quadratic basis and Matérn 3/2 kernel. The lines show the predicted mean value from different ML methods, and the shadow shows the standard deviation predicted by GPR. The specific surface areas of electrode materials are: data set II-1: Smicro = 579 m2 g−1, Smeso = 83 m2 g−1, data set II-2: Smicro = 481 m2 g−1, Smeso = 200 m2 g−1, data set II-3: Smicro = 200 m2 g−1, Smeso = 900 m2 g−1, data set II-4: Smicro = 0 m2 g−1, Smeso = 24 m2 g−1.7 | ||
We can identify the parameter space leading to the unphysical behavior by inspecting the EDL capacitance at high scan rates. Approximately, the trend can be captured by considering the variation of the relative capacitance with the growth of the scan rate, as shown in Fig. 4. We see that the unphysical prediction of ANN emerges in the regions of low micropore surface area and the high mesopore surface area. In conventional GPR, the prediction is problematic at high scan rate regardless of the pore characteristics of the electrode material. By contrast, the PhysGPR model predicts that, as observed in experiments, the EDL capacitance always decreases with rising scan rate.
While PhysGPR incorporates a linear trend between the logarithm of the capacitance and the scan rate, the physics-informed basis functions are oblivious to conventional ML models such as ANN and GPR. Apparently, the correlation between the EDL capacitance and the scan rate was not learnt by the nonlinear nature of these methods. From the calculated basis coefficients β, we find that the coefficient in the mean function of v2: βv2 = 7.82 > 0 for ConvGPR with pure quadratic basis. When the scan rate v is sufficiently large, the conventional ML model would predict an increase of capacitance. Because the v2 term is necessary for ConvGPR to reproduce the experimental results, the ‘pure Quadratic’ basis implies that Csp is positive definite and the slope of Csp–v increases beyond a certain scan rate. In PhysGPR, v2 is absent in the basis function. According to eqn (2), k ∼ −H2(Xmat) × β2 > 0 within the data range. As a result, Csp = C0e−kv always decreases with v.
In the PhysGPR model with the ARD Matérn 3/2 model, we find that the length scale of scan rate (γv = 1.4) is much larger than that of surface area (γSmicro = 0.27 and γSmeso = 0.096), implying that predictions are smoother in terms of the scan rate than that of the surface areas. Comparing the specific capacitance-scan rate plot with that of the non-ARD kernel model (see Fig S2, ESI†), we see that the smoothness of the predicted curve for the capacitance as a function of the scan rate is necessary in order to avoid overfitting.
Optimizing capacitive performance
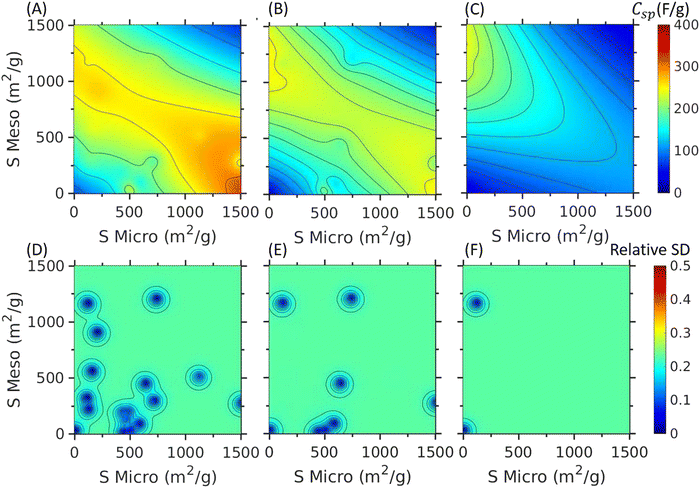
Fig. 5 shows the specific capacitance versus micropore and mesopore surface areas predicted by PhysGPR at 3 different scan rates, 5 mV s−1, 50 mV s−1 and 200 mV s−1. At the low scan rate (5 mV s−1), the ML model predicts that high micropore surface area would lead to high capacitance. At the high scan rate (200 mV s−1), the specific capacitance is drastically reduced for the carbon electrodes with large micropore surface area due to the large resistance on ion transport. In this case, the contribution from mesopore surface area is relatively insensitive to the scan rate. Fig. 5(d)–(f) indicates that the predictive standard deviation by PhysGPR is about 25%, indicating small uncertainty associated with the PhysGPR prediction.According to Fig. 5(A), PhysGPR predicts that the specific capacitance does not increase with the surface area when the total surface area exceeds about 1500 m2 g−1. This prediction is consistent with the experimental observations and the ANN model.40,41 However, different from the ANN model, PhysGPR also predicts that the capacitance would rise with the micropore surface area at low scan rate before the total surface area becomes too high. At high scan rate, the electrode with high mesopore surface area and low micropore surface area would have the highest capacitance. From Fig. 5, we can find that the capacitance decreases with the total surface area at very high total surface area, regardless of the pore size distribution. Under extreme conditions, the reduction in capacitance may be related to interactions between electrolytes in neighboring pores.40
Fig. 6(A) shows the Ragone plot for the energy density and power density (calculated by eqn (S1) and (S2), ESI†) of EDL capacitators made of pristine carbon. The lines are constructed with the PhysGPR model in the range of Smicro < 1500 m2 g−1 and Smeso < 1500 m2 g−1 with the scan rate 5 mV s−1 ≤ v ≤100 mV s−1. For comparison, the figure also includes the results predicted by the ANN model7 in the range of 250 m2 g−1 < Smeso < 1500 m2 g−1 (in order to avoid the unphysical predictions). Interestingly, the maximum energy density and the maximum power density predicted by PhysGPR and ANN are close to each other. The PhysGPR model predicts that the largest energy density happens at Smicro = 1500 m2 g−1, Smeso = 160 m2 g−1 with a scan rate of 5 mV s−1, and the largest power density happens at Smicro = 0 m2 g−1, Smeso = 1060 m2 g−1 with a scan rate of 100 mV s−1. Although PhysGPR and ANN predict a similar maximum energy density, the surface areas corresponding to the maximum point are quite different. PhysGPR suggests high micropore surface area while ANN suggests a mix of both type of pores. More data around Stot ≅ 1500 m2 g−1 are needed to know which is more accurate.
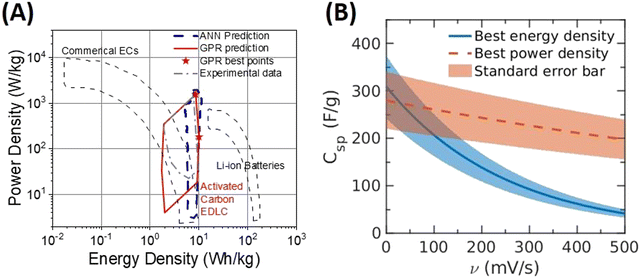 | ||
| Fig. 6 (A) The Ragone plot predicted by two ML models for the power density and energy density of EDL capacitators made of pristine carbon. The red solid line shows the PhysGPR prediction, while the blue dashed line shows the prediction of ANN as reported in our previous work.7 The maximum energy density and power density are shown as red stars on the plot. (B) Specific capacitance (versus the scan rate (v) predicted by PhysGPR with the rational quadratic kernel at the condition corresponding to the maximum energy density and to the maximum power density). The maximum energy density and maximum power density occur at the largest specific capacitance at the scan rates of 5 mV s−1 and 100 mV s−1, respectively. The surface areas are: Smicro = 1500 m2 g−1, Smeso = 160 m2 g−1 at 5 mV s−1 for the maximum energy density, and Smicro = 0 m2 g−1, Smeso = 1060 m2 g−1 at 100 mV s−1 for the maximum power density. | ||
Fig. 6(B) shows the specific capacitance versus the scan rate for these top materials predicted by PhysGPR. At low scan rate, a higher energy density can be reached for an electrode with a larger micropore surface area. However, at high scan rate, an electrode with a larger mesopore surface area shows a higher energy density while its performance at low scan rate is comparable to electrodes with high micropore surface areas. PhysGPR predicts that a pristine activated carbon with high mesopore surface area and low micropore surface area performs well in a large range of scan rates. While a similar conclusion can be reached from the ANN model, its prediction in that range is unreliable because of the unphysical behavior. Because active carbons with high mesopore and low micropore surface area are hard to produce, such materials have not been systematically studied before but would be a good direction for electrode material design.
Conclusions
In this work, we developed a physics-informed Gaussian process regression (PhysGPR) model and tested its performances for predicting the electric-double layer (EDL) capacitance of carbon electrodes. The PhysGPR models the logarithm of the capacitance and incorporates physics information into the mean of the GPR, which eliminates unphysical predictions that would be encountered with conventional GPR. Although transforming the output and modeling the mean structure have been considered in prior studies on developing GP emulators,43 it was not realized that these modeling steps can help eliminate unphysical predictions from conventional GPR. Quantitative correlations were established between the surface areas of the carbon materials and their capacitive behavior in good agreement with experimental data.The results are compared with conventional machine-learning (ML) models such as ANN and GPR. Among the different ML models investigated in this work, we found that ConvGPR with the ‘pure quadratic’ basis and the ARD Matérn 3/2 kernel could yield the best performance in terms of out-of-sample predictions. However, both ANN and ConvGPR predict unphysical capacitance–scan rate relationships at high scan rates, while the predictions by PhysGPR eschew such issues because it incorporates a semi-empirical model accounting for the dependence of the capacitance on the scan rate. Among various forms of PhysGPR models, ARD Matérn 3/2 kernel provides the best correlation to the experimental data. The PhysGPR model captures the impact of the micropore and mesopore surface area on the EDL capacitance. The model was used to construct the Ragone plot that predicts the largest energy and power density of EDL capacitors made of pristine active carbons and the corresponding characteristic parameters.
Besides introducing the physical basis in a supervised ML method, there are other methods to avoid the unphysical behavior in ML, including constructing a shape constrained function through imposing constraints on process derivatives in GPR by indicator functions, and computing conditional distributions to make predictions.42 However, applying these methods to a multivariate GPR is significantly more computationally demanding than applying a physics-informed model. Another advantage of GPR is the availability of the uncertainty of the prediction. The assessed uncertainty can be used to design the minimum number of experiments to improve the predictive accuracy of the input region without enough data through active learning,44 and to find the optimal experimental conditions or material to design EDL capacitors through Bayesian optimization.45
This work introduces the physics basis in a supervised ML method. The ML model suggests that active carbon with high mesopore and low micropore surface area can be utilized to produce EDL capacitors with the best performance in a large range of scan rates. We note that, in addition to optimizing the micropore and mesopore surface areas, the performance of the carbon supercapacitors can be further improved by chemical modifications such as heteroatom doping. The physics-informed ML model can be similarly applied to such materials. We hope that this work provides fresh insights for the design and synthesis of carbon electrodes for capacitive energy storage.
Conflicts of interest
There are no conflicts to declare.Acknowledgements
Musen Zhou participated in the early stage of this research. This work is financially supported by the National Science Foundation Harnessing the Data Revolution Big Idea under grant no. NSF 1940118. Gu acknowledges partial support from the National Science Foundation under award no. DMS-2053423.References
- A. Berrueta, et al., Supercapacitors: Electrical Characteristics, Modeling, Applications, and Future Trends, IEEE Access, 2019, 7, 50869–50896 Search PubMed.
- A. Ghosh and Y. H. Lee, Carbon-based electrochemical capacitors, ChemSusChem, 2012, 5(3), 480–499 CrossRef CAS PubMed.
- C. Lian, et al., A Generic Model for Electric Double Layers in Porous Electrodes, J. Phys. Chem. C, 2016, 120(16), 8704–8710 CrossRef CAS.
- S. Fleischmann, et al., Continuous transition from double-layer to faradaic charge storage in confined electrolytes, Nat. Energy, 2022, 7(3), 222–228 CrossRef CAS.
- J. Wu, Understanding the Electric Double-Layer Structure, Capacitance, and Charging Dynamics, Chem. Rev., 2022, 122(12), 10821–10859 CrossRef CAS PubMed.
- L. Lue, Equation of state for polymer chains in good solvents, J. Chem. Phys., 2000, 112(7), 3442–3449 CrossRef CAS.
- M. S. Zhou, et al., Insights from machine learning of carbon electrodes for electric double layer capacitors, Carbon, 2020, 157, 147–152 CrossRef CAS.
- A. J. Pak and G. S. Hwang, Charging Rate Dependence of Ion Migration and Stagnation in Ionic-Liquid-Filled Carbon Nanopores, J. Phys. Chem. C, 2016, 120(43), 24560–24567 CrossRef CAS.
- C.-q Yi, et al., Recent advances in pseudocapacitor electrode materials: Transition metal oxides and nitrides, Trans. Nonferrous Met. Soc. China, 2018, 28(10), 1980–2001 CrossRef CAS.
- G. J. Lee and S. I. Pyun, Theoretical approach to ion penetration into pores with pore fractal characteristics during double-layer charging/discharging on a porous carbon electrode, Langmuir, 2006, 22(25), 10659–10665 CrossRef CAS PubMed.
- L. Eliad, et al., Ion sieving effects in the electrical double layer of porous carbon electrodes: Estimating effective ion size in electrolytic solutions, J. Phys. Chem. B, 2001, 105(29), 6880–6887 CrossRef CAS.
- G. Hasegawa, et al., New Insights into the Relationship between Micropore Properties, Ionic Sizes, and Electric Double-Layer Capacitance in Monolithic Carbon Electrodes, J. Phys. Chem. C, 2012, 116(50), 26197–26203 CrossRef CAS.
- O. A. Vasilyev, A. A. Kornyshev and S. Kondrat, Connections Matter: On the Importance of Pore Percolation for Nanoporous Supercapacitors, ACS Appl. Energy Mater., 2019, 2(8), 5386–5390 CrossRef CAS.
- J. Chmiola, et al., Anomalous increase in carbon capacitance at pore sizes less than 1 nanometer, Science, 2006, 313(5794), 1760–1763 CrossRef CAS PubMed.
- G. Feng and P. T. Cummings, Supercapacitor Capacitance Exhibits Oscillatory Behavior as a Function of Nanopore Size, J. Phys. Chem. Lett., 2011, 2(22), 2859–2864 CrossRef CAS.
- D. E. Jiang, Z. Jin and J. Wu, Oscillation of capacitance inside nanopores, Nano Lett., 2011, 11(12), 5373–5377 CrossRef CAS PubMed.
- S. Kondrat, et al., A superionic state in nano-porous double-layer capacitors: insights from Monte Carlo simulations, Phys. Chem. Chem. Phys., 2011, 13(23), 11359–11366 RSC.
- S. Zhu, et al., Artificial neural network enabled capacitance prediction for carbon-based supercapacitors, Mater. Lett., 2018, 233, 294–297 CrossRef CAS.
- H. Su, et al., Predicting the capacitance of carbon-based electric double layer capacitors by machine learning, Nanoscale Adv., 2019, 1(6), 2162–2166 RSC.
- M. Rahimi, M. H. Abbaspour-Fard and A. Rohani, Synergetic effect of N/O functional groups and microstructures of activated carbon on supercapacitor performance by machine learning, J. Power Sources, 2022, 521, 230968 CrossRef CAS.
- J. Wang, et al., Modifying the microstructure of algae-based active carbon and modelling supercapacitors using artificial neural networks, RSC Adv., 2019, 9(26), 14797–14808 RSC.
- M. Zhou, A. Vassallo and J. Wu, Data-Driven Approach to Understanding the In-Operando Performance of Heteroatom-Doped Carbon Electrodes, ACS Appl. Energy Mater., 2020, 3(6), 5993–6000 CrossRef CAS.
- C. E. Rasmussen and C. K. I. Williams, Gaussian Processes for Machine Learning, The MIT Press, Cambridge, Massachusetts, 2005 Search PubMed.
- J. Wu and M. Gu, Emulating the first principles of matter: A probabilistic roadmap, arXiv, arXiv:2010.05942, 2020, preprint.
- V. L. Deringer, et al., Gaussian Process Regression for Materials and Molecules, Chem. Rev., 2021, 121(16), 10073–10141 CrossRef CAS PubMed.
- M. C. Kennedy and A. O’Hagan, Bayesian calibration of computer models, J. R. Stat. Soc. Series B Stat. Methodol., 2001, 63(3), 425–464 CrossRef.
- H. Wu, et al., The effect of activation technology on the electrochemical performance of calcium carbide skeleton carbon, J. Solid State Electrochem., 2012, 16(9), 2941–2947 CrossRef CAS.
- J. T. Zhang, et al., Preparation of activated carbon from waste Camellia oleifera shell for supercapacitor application, J. Solid State Electrochem., 2012, 16(6), 2179–2186 CrossRef CAS.
- L. Jiang, et al., High rate performance activated carbons prepared from ginkgo shells for electrochemical supercapacitors, Carbon, 2013, 56, 146–154 CrossRef CAS.
- Y. T. Li, et al., Hierarchical porous active carbon from fallen leaves by synergy of K2CO3 and their supercapacitor performance, J. Power Sources, 2015, 299, 519–528 CrossRef CAS.
- L. L. Jiang, et al., Construction of nitrogen-doped porous carbon buildings using interconnected ultra-small carbon nanosheets for ultra-high rate supercapacitors, J. Mater. Chem. A, 2016, 4(29), 11388–11396 RSC.
- W. Yang, et al., Template-free synthesis of ultrathin porous carbon shell with excellent conductivity for high-rate supercapacitors, Carbon, 2017, 111, 419–427 CrossRef CAS.
- D. D. Zhang, et al., Scalable synthesis of hierarchical macropore-rich activated carbon microspheres assembled by carbon nanoparticles for high-rate performance supercapacitors, J. Power Sources, 2017, 342, 363–370 CrossRef CAS.
- C. Pean, et al., On the dynamics of charging in nanoporous carbon-based supercapacitors, ACS Nano, 2014, 8(2), 1576–1583 CrossRef CAS PubMed.
- R. G. Compton and C. E. Banks, Understanding Voltammetry, 2010 Search PubMed.
- C. Pean, et al., On the Dynamics of Charging in Nanoporous Carbon-Based Supercapacitors, ACS Nano, 2014, 8(2), 1576–1583 CrossRef CAS PubMed.
- T. Aslyamov, K. Sinkov and I. Akhatov, Relation between Charging Times and Storage Properties of Nanoporous Supercapacitors, Nanomaterials, 2022, 12(4), 587 CrossRef CAS PubMed.
- A. Allagui, et al., Reevaluation of Performance of Electric Double-layer Capacitors from Constant-current Charge/Discharge and Cyclic Voltammetry, Sci. Rep., 2016, 6, 38568 CrossRef CAS PubMed.
- C. E. Rasmussen, Gaussian Processes in Machine Learning, in Advanced Lectures on Machine Learning: ML Summer Schools 2003, Canberra, Australia, February 2–14, 2003, Tübingen, Germany, August 4–16, 2003, Revised Lectures, ed. O. Bousquet, U. von Luxburg and G. Rätsch, Springer Berlin Heidelberg, Berlin, Heidelberg, 2004, p. 63–71 Search PubMed.
- O. Barbieri, et al., Capacitance limits of high surface area activated carbons for double layer capacitors, Carbon, 2005, 43(6), 1303–1310 CrossRef CAS.
- T. Lu, J. Guan and C. An, Preoperative trepanation and drainage for acute subdural hematoma: Two case reports, Exp. Ther. Med., 2015, 10(1), 225–230 CrossRef PubMed.
- X. Wang and J. O. Berger, Estimating Shape Constrained Functions Using Gaussian Processes, SIAM-ASA J. Uncertain. Quan, 2016, 4(1), 1–25 CrossRef CAS.
- M. Gu and J. O. Berger, Parallel partial Gaussian process emulation for computer models with massive output, Ann. Appl. Stat., 2016, 10(3), 1317–1347 Search PubMed.
- X. Fang, M. Gu and J. Wu, Reliable emulation of complex functionals by active learning with error control, J. Chem. Phys., 2022, 157(21), 214109 CrossRef CAS PubMed.
- B. J. Shields, J. Stevens, J. Li, M. Parasram, F. Damani, J. I. M. Alvarado and A. G. Doyle, Bayesian reaction optimization as a tool for chemical synthesis, Nature, 2021, 590(7844), 89–96 CrossRef CAS PubMed.
Footnote |
| † Electronic supplementary information (ESI) available: The formulas for calculating capacitance, the input data used for training the machine learning models and model and methodology of Gaussian Process Regression (GPR). See DOI: https://doi.org/10.1039/d3ya00071k |
| This journal is © The Royal Society of Chemistry 2023 |

