 Open Access Article
Creative Commons Attribution 3.0 Unported Licence
Copper and iron co-doping effects on the structure, optical energy band gap, and catalytic behaviour of Co3O4 nanocrystals towards low-temperature total oxidation of toluene†
Hippolyte Todou
Assaouka
a,
Issah Ngouh
Nsangou
a,
Daniel Manhouli
Daawe
b,
Daniel Onana
Mevoa
a,
Abraham Atour
Zigla
b,
Patrick Ndouka
Ndouka
a and
Patrick Mountapmbeme
Kouotou
 *bcd
*bcd
aDepartment of Chemistry, Faculty of Sciences, University of Maroua, Maroua P.O. Box 55, Cameroon
bNational Advanced School of Engineering, University of Maroua, P.O. Box. 46, Maroua, Cameroon
cAdvanced School of Agriculture, Forestry, Water and Environment, University of Ebolowa, P.O. Box 786, Ebolowa, Cameroon
dInstitute of Engineering Thermophysics, Chinese Academy of Sciences, Beijing 100190, China. E-mail: mkpatrick1982@gmail.com
First published on 18th April 2023
Abstract
This study reports the effect of Cu and Fe addition on the structure, morphology, optical energy band gap and the catalytic performance of Co3O4 nanocrystals (NCs). Single-oxide (CuO, Fe3O4, and Co3O4) and trimetallic oxide (Cu0.75Fe0.25Co2O4) NCs were prepared by a co-precipitation technique. The physico-chemical properties of the as-prepared NCs were thoroughly investigated and their performance as catalysts was successfully evaluated. Compared with single oxides, the Cu0.75Fe0.25Co2O4 spinel with a dome top-like morphology exhibited the highest performance with almost 100% oxidation of C7H8 at 220 °C at a gas hourly space velocity (GHSV) of 22![[thin space (1/6-em)]](https://www.rsc.org/images/entities/char_2009.gif) 500 mL g−1 h−1. The sequence of the catalytic performance was found to be proportional to the activation energy (Ea (kJ mol−1)) and the performance order is as follows: Cu0.75Fe0.25Co2O4 (35.2) > Co3O4 (55.5) ∼ CuO (75.5) > Fe3O4 (83.4). The excellent performance of Cu0.75Fe0.25Co2O4 towards toluene total oxidation is suggested to be assigned to the Cu and Fe co-doping effect and behave as promoters in the matrix of the Co3O4 spinel. The promotion effect can be ascribed to: (a) the smallest crystallite grain size as responsible for the largest surface specific area, (b) the lowest-temperature reducibility responsible for the highest population of oxygen vacancies, (c) the highest mobility of oxygen species due to its good redox capability and (d) the highest ratio of active species (OLat/OAds, Co3+/Co2+, Cu2+/Cu+, and Fe3+/Fe2+) and the lowest Eoptg. The overall findings suggest that toluene total oxidation over Cu0.75Fe0.25Co2O4 might follow a Mars van Krevelen process.
500 mL g−1 h−1. The sequence of the catalytic performance was found to be proportional to the activation energy (Ea (kJ mol−1)) and the performance order is as follows: Cu0.75Fe0.25Co2O4 (35.2) > Co3O4 (55.5) ∼ CuO (75.5) > Fe3O4 (83.4). The excellent performance of Cu0.75Fe0.25Co2O4 towards toluene total oxidation is suggested to be assigned to the Cu and Fe co-doping effect and behave as promoters in the matrix of the Co3O4 spinel. The promotion effect can be ascribed to: (a) the smallest crystallite grain size as responsible for the largest surface specific area, (b) the lowest-temperature reducibility responsible for the highest population of oxygen vacancies, (c) the highest mobility of oxygen species due to its good redox capability and (d) the highest ratio of active species (OLat/OAds, Co3+/Co2+, Cu2+/Cu+, and Fe3+/Fe2+) and the lowest Eoptg. The overall findings suggest that toluene total oxidation over Cu0.75Fe0.25Co2O4 might follow a Mars van Krevelen process.
1. Introduction
Volatile organic compounds (VOCs) released by factories, transportation as well as human activities are well known as hazardous air waste due to their toxic, mutagenic and cyanogenic nature. VOCs are also great precursors of ozone and smog in the atmosphere.1–3 Low-temperature catalytic oxidation is established as an effective approach for mitigating environmental emission, owing to its inexpensive operating cost, low energy consumption, high conversion efficiency and low thermal NOx emissions.4,5 Presently, two types of catalysts, namely, supported noble metals (Ag, Au, Pt and Pd)6–9 and metal oxides are established for the total conversion of toluene.10–15 Particularly, transition metal oxides (TMOs) possess the advantages of availability, low cost, high thermal stability, considerable reducibility, strong resistance to poisons and promising catalytic performance.16–18 Therefore, TMOs have attracted much attention in the total abatement of VOCs. Recently, TMO catalysts have drawn considerable attention owing to their synergistic effect with numerous advantageous properties.19 Referring to single-metal oxides, Co3O4 has gained growing interest as an effective, inexpensive and active catalyst with comparable performance to supported precious metal catalysts.Earlier, numerous synthesis approaches have been applied to fabricate Co3O4 in the form of thin films or powder nanocrystals (NCs) with various morphologies and physico-chemical properties. However, the good activity of Co3O4 towards the total conversion of VOCs was assigned more to the high specific surface area and the occurrence of oxygen vacancies than to the ordered structures.6 Analogously, acidic leaching has been used as a strategy to modify the chemistry and structure of Co3O4, and the as-synthesized Co3O4 NCs with mesoporous structure exhibit improved performance towards toluene conversion into CO2 and H2O.10 The better surface specific area, abundant surface Co2+, adsorbed oxygen (OAds.) species and/or oxygen vacancy (Ov) were reported to play a decisive role in the catalytic oxidation process.20,21 Despite the previously applied strategy, there is significant interest in enhancing the catalytic performance of Co3O4 for various VOCs in order to expand the range of feasibility and meet the requirements of practical applications in catalysis. Therefore, a doping strategy which consists of the substitution and/or addition of a second metal cation in the Co3O4 lattice is presently investigated as a prospective route to additionally improve the performance of Co3O4 catalysts.
Recently, extensive practical and theoretical investigation on the influence of transition metal cation dopant features on the physicochemical and redox properties of cobalt-based binary oxide catalysts have been reported.10,14 The authors have established that doping could redesign the chemical composition and ionic states, ionic radius, as well as chemical bonding in the bulk and surface of Co3O4, which might result in an excellent catalytic performance.
To date, several binary metal (Mn, Cu, Ni, and Fe)-doped Co3O4 thin films and nanocrystal powder have been prepared and successfully tested as catalysts.13,15,22 Among TMO-based catalysts, Co–Cu and Co–Fe oxide catalysts exhibit promising performance in the elimination of VOCs. In fact, by introducing different types of transition metals (TMs) into the pure TMO lattice, the redox behaviour and chemical activity of the obtained mixed-TMO can be modified due to many factors.23,24 On the structural aspect, numerous defects with high chemical activity can be formed due to the stress provoked by doping or insertion of a second metal in the matrix of a single TMOs. In addition, TM ↔ TM or TM ↔ oxygen ↔ TM can open the way to new electronic properties, absent in single TMOs.25
Although doping has a significant impact on the catalytic behavior of individual oxides, research has mainly focused on binary oxides, and there have been only a few studies investigating catalytic oxidation with ternary or trimetallic oxide-based TMs.13,26 However, it is not a priori clear what type and number of metals are required to enhance single-TMO catalytic activity and the lattice stability at high temperatures. Ternary oxides are generally used as electrocatalysts with a wide variety of critical physicochemical properties and excellent stability for several applications; such materials can also be highly active catalysts and display an exceptional activity compared to single and binary oxides.27,28 Recently, Waqas et al., have reported a preliminary study on the application of Cu–Co–Fe oxide thin films as catalysts for low-temperature CO, although it has shown a potential catalytic application, the as-prepared catalyst shows weak stability and durability upon continuous time-on-stream.29 It is therefore interesting to perform a systematic study on the influence of both Cu and Fe with appropriate contents on the properties of Co-based oxides. The designed ternary oxide CuFeCoO is expected to exhibit superior properties beneficial for the catalytic performance and stability.
Herein, three single-oxide (CuO, Co3O4, and Fe3O4) and one trimetallic oxide (Cu0.75Fe0.25Co2O4) catalysts were prepared by a co-precipitation technique. The as-prepared catalysts were thermally treated before their use as catalysts for toluene oxidation. Particularly, attention was paid to understand the influence of Cu and Fe co-doping on the physicochemical and catalytic properties of the as-prepared NCs. An attempt was made to correlate the catalytic behavior of Cu0.75Fe0.25Co2O4 NCs with the abundant metallic surface and reactive oxygen species, and open porosity of NCs with high SBET, as well as the highest reducibility and lowest Eoptg.
2. Results and discussion
2.1. Structure and texture of catalysts by XRD
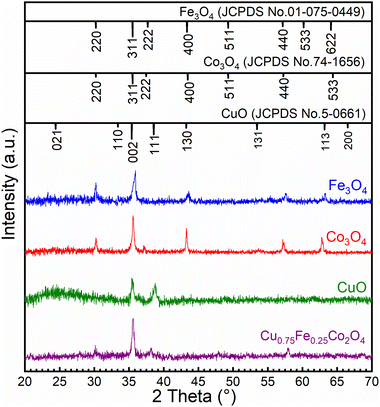
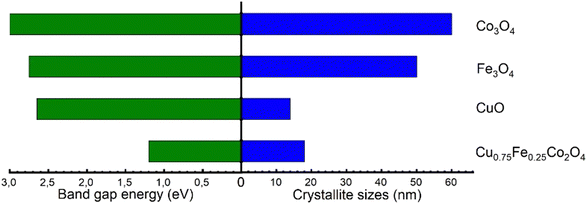
The structures of CuO, Fe3O4, Co3O4 and Cu0.75Fe0.25Co2O4 were examined by XRD, as displayed in Fig. 1, while the summary quantification details are shown in Table 1. The XRD spectrum of Fe3O4 exhibited a peak located at 2θ = 30.8°, 35.75°, 43.92°, 58.52° and 64,20°, which could be assigned to the (220), (311), (400), (440), and (622) crystal planes (JCPDS No. 01-075-0449) respectively. For the Co3O4 sample, the crystal structure and diffraction signals at 2θ values of 31.5°, 35.81°, 36.78°, 43.95°, 58.33° and 64.18° could be assigned to the (220), (311), (222), (400), (440), and (533) crystal planes (JCPDS No. 74-1656) respectively. As for CuO, two prominent peaks located at 35.3° (002) and 38.6° (111) are detected on the diffraction spectrum, which can be perfectly indexed to monoclinic CuO (JCPDS no. 05-0661). No other characteristic diffraction peaks including CoO, Co2O3, and FeO were detected in these single oxides, attesting for the purity of samples. However, Cu0.75Fe0.25Co2O4 samples with a spinel exhibit clear signals, which fit well with some XRD diffraction peaks characteristic of Co3O4, Fe3O4 and CuO single oxides. The obtained XDR spectrum is in close agreement with early reported results.30 Additionally, no other specific signals were observed, which attest of the purity of the as-prepared samples. The particle sizes of all the samples were estimated from the most intense diffraction signals using Scherrer's formula. The crystallite size was calculated to be 18 ± 2 nm, as displayed in Fig. 1. The crystallite size of the Cu0.75Fe0.25Co2O4 sample was found to be smaller than the ones of CuO (∼14 nm), Fe3O4 (∼50 nm) and Co3O4 (∼60 nm) respectively, suggesting that Cu0.75Fe0.25Co2O4 facilitates high dispersion.31 Furthermore, it is well established that a small particle size showed a beneficial effect on the active site dispersion.32 The synergy between Fe, Cu, and Co species and the Cu0.75Fe0.25Co2O4 structure is expected to play an important role in the C7H8 total oxidation process that could improve the catalytic performance.| Samples | PSa (nm) | S BET (m2 g−1) | T (°C) TPRc peaks | E a (kJ mol−1) | T 90 (°C) |
|---|---|---|---|---|---|
| a Average crystallite size. b Specific surface area by BET method. c H2-temperature programmed reduction (x1st, y2nd k and z3rd peak). d Activation energy. e Temperature at 90% conversion. | |||||
| Co3O4 | 60 | 48 | 390x and 487y | 75.5 | 250 |
| CuO | 14 | 87 | 251x | 55.5 | 250 |
| Fe3O4 | 50 | 23 | 438x and 720y | 83.4 | 270 |
| Cu0.75Fe0.25Co2O4 | 18 | 137 | 180x, 210y and 249z | 35.2 | 225 |
2.2. Fourier transform infra-red analysis
FTIR emission was also performed in order to analyze the functional group at the surface of CuO, Co3O4, Fe3O4 and Cu0.75Fe0.25Co2O4 samples. The FTIR spectrum of singles and trimetallic oxides and their corresponding description are presented in ESI 3† (Fig. S1 and S2 respectively).2.3. Morphology analysis
The microstructural features of Cu0.75Fe0.25Co2O4, CuO, Co3O4, and Fe3O4 samples were studied using a scanning electron microscope, as displayed in Fig. 2. Fe3O4 catalysts present a needle-like morphology (Fig. 2a and b), resulting from the aggregation of narrow particles to form clusters with an average crystallite size of ∼50 nm.33 From Fig. 2c and d, it was observed that the Co3O4 sample exhibits a cubic-like morphology formed by quasi uniform microstructures with a grain size of different diameters and the average diameter estimated to be approximately ∼60 nm. Fig. 2e and f present the CuO micrograph images, with regular and uniform particles strongly agglomerated together and which form regular grains of same shape and size (∼14 nm). Fig. 2g and h show Cu0.75Fe0.25Co2O4, with dome top-like morphology composed of small particles (∼18 nm). Moreover, the dome top-like morphology of Cu0.75Fe0.25Co2O4 increases the specific surface area (137 m2 g−1) of the targeted catalyst, which additionally furnishes further sites for electrophilic species (O22− or O−) accumulation, minimizing the diffusion length of oxygen species.34 Aside from the dome top-like structure, considerable narrow holes (open porosity) are also detected and are suggested to be created due to competitive growth among Cu, Fe and Co oxides during the co-precipitation. Therefore, these small holes, surface open porosity, and increased surface area of the catalysts potentially consisted of more chemisorbed and physisorbed surface-active oxygen species are expected to play an important role in catalytic performance in agreement with the literature.35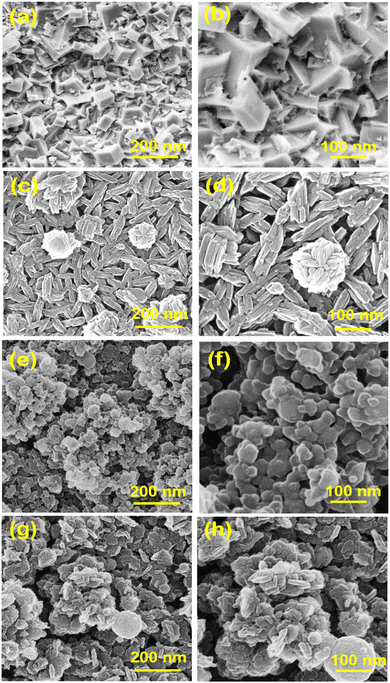 | ||
| Fig. 2 Low- and high-magnification SEM images of spinel Co3O4 (a and b), Fe3O4 (c and d), CuO (e and f), and Cu0.75Fe0.25Co2O4 (g and h). | ||
2.4. Bulk composition (EDS)
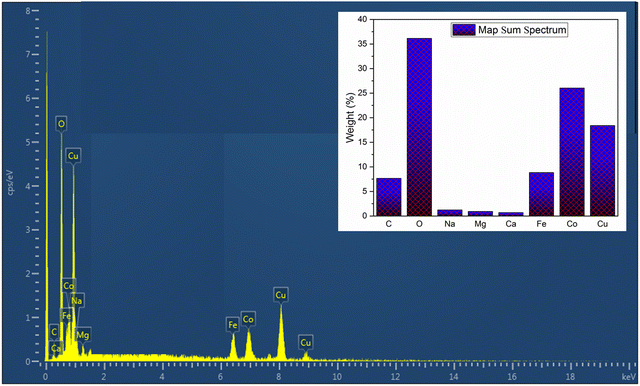
Energy-dispersive spectroscopy (EDS) was employed to analyze the bulk composition of the overall catalysts. Since our main target in this study is the trimetallic oxide, we present the corresponding EDS spectrum of Cu0.75Fe0.25Co2O4 (Fig. 3) in the main manuscript, and spectra for Co3O4, CuO and Fe3O4 can be found in the ESI† (Fig. S3). As presented in Fig. 3, the EDS result of the obtained ternary Cu0.75Fe0.25Co2O4 displays peaks corresponding to iron (Fe: 6.20%), copper (Cu: 8.00%), carbon (C: 1.36%), cobalt (Co: 21.7%), and oxygen (O: 49.24%) elements. The EDS results for single metal oxides revealed the atomic percentages of elements as follows: CuO: 50.76% Cu and 50.24% O; Co3O4: 53.18% Co and 46.82% O; and Fe3O4: 48.72 Fe and 51.28% O free of all other metals and contaminants. These findings confirm on the chemically pure nature of the synthesized oxides by a precipitation method.2.5. Composition and ionic states (XPS)
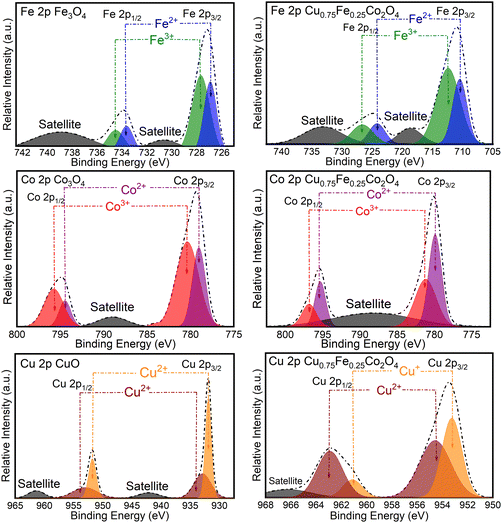
The surface chemical composition and ionic states of CuO, Co3O4, Fe2O3 and Cu0.75Fe0.25Co2O4 were analyzed by XPS, as shown in Fig. 4, and the related characteristic details are listed in Table 2. The Fe 2p spectra of Cu0.75Fe0.25Co2O4 and Fe2O3 exhibit a significant peak at 711.15 and 780.7 eV, assigned to the Fe 2p3/2 and Fe 2p1/2 core shell respectively, in close agreement with the reported value.36 The Fe 2p3/2 spectra of Cu0.75Fe0.25Co2O4 are separated into Fe3+ and Fe2+ components at 779. 7 and ∼781 eV respectively, while and Fe 2p1/2 is also deconvoluted into the same constituents located at 725.8 and 727.45 eV, respectively. The signals at ∼718 and ∼734 eV correspond to satellite peaks. The deconvolution results of the Fe3O4 spectrum showed two components at 727.03 and 728.10 eV, which could be attributed to the Fe2+ and Fe3+ species, respectively. This attribution is based on the close value (8.47 eV) of the spin-orbital splitting reported earlier in the literature.37 Additionally, satellite peaks are observed at lower (∼731.15 eV) and higher (∼739.62 eV) binding energies. Similarly, the Co 2p XPS profile for Cu0.75Fe0.25Co2O4 and Co3O4 exhibited two significant peak located at 780.6 and 796.7 eV respectively assigned to Co 2p3/2 and Co 2p1/2, in close agreement with the literature.38,39| Samples | Co3+/Co2+ (%) | Fe3+/Fe2+ (%) | Cu2+/Cu+ (%) | OLat. (CuO/CoO/FeO/CuCoFeO) | OAds. (–OH) | OAds. (–CO32−) | OAds./OLat. (%) | Ov (%) | |||
|---|---|---|---|---|---|---|---|---|---|---|---|
| At (%) | BE (eV) | At (%) | BE (eV) | At (%) | BE (eV) | ||||||
| Note: BE stands for binding energy; At% is the atomic percentage. | |||||||||||
| CuO | — | — | 0.48 | 48.58 | 529.50 | 17.42 | 531.80 | 03.74 | 532.90 | 0.45 | 49.36 |
| Co3O4 | 0.43 | — | — | 50.94 | 529.10 | 25.30 | 530.14 | 50.62 | 532.26 | 0.55 | 56.34 |
| Fe3O4 | — | 0.46 | — | 58.16 | 529.85 | 20.93 | 530.42 | — | — | 0.36 | 41.18 |
| Cu0.75Fe0.25Co2O4 | 0.57 | 0.54 | 0.52 | 33.12 | 53.50 | 63.23 | 532.15 | — | — | 1.90 | 71.25 |
The Gaussian fitting data show two signals that could be deconvoluted into two doublets, suggesting the coexistence of Co cations in both divalent- (Co2+) and trivalent (Co3+) oxidation states at the surface as well as in the lattice of Cu0.75Fe0.25Co2O4. The signals located at ∼780.01 and ∼796.7 eV were associated with the presence of Co3+, whereas the peaks centered at ∼781.1 and ∼795.9 eV were allied to the occurrence of Co2+ species in Cu0.75Fe0.25Co2O4.39,40 It is worth that, the signals at ∼790.02 eV were assigned to satellite signals. Following the same procedure, Co3O4 fitting results displayed the Co 2p spectrum with asymmetric peaks, with an evident shift of BE towards to higher values and which is made of several overlapping features emerging from 2p3/2 (∼783.3 eV) and 2p1/2 (∼796.5 eV) signals ascribed to Co2+ and Co3+. Satellite peaks were detected at low BE (∼788.5 eV).41 Finally, Cu0.75Fe0.25Co2O4 and CuO exhibit two intense signals centered at ∼952.0 and ∼931.9 eV assigned to Cu 2p1/2 and Cu 2p3/2, respectively.42 Since the discrimination of different Cu oxidation states (Cu0 Cu+ and Cu2+) by XPS cannot be easily performed, the Auger spectrum was recorded, and is shown in Fig. S4 (ESI†). As displayed in Fig. S4 (ESI†), a comparison with the characteristic feature of Cu LMM BE located at ∼934.1 eV for CuO samples (in Fig. S4a, ESI†) indicates that Cu0 and Cu+ do not seem to be present in the as-prepared CuO NPs. Moreover, the signals at ∼953.05 and ∼963.07 eV with the difference of ∼10.02 eV showed that copper in Cu0.75Fe0.25Co2O4 exhibits mainly II+ oxidation state.11 Therefore, one can conclude that the oxidation state of copper in CuO NPs is mainly Cu2+, in excellent agreement with the literature.43,44 In contrast, the characteristic feature of Cu LMM for Cu0.75Fe0.25Co2O4 NPs (see Fig. S4b, ESI†) is located at ∼954.7 eV. By comparison with the chemical shifts of the standard sample, the bands located at a binding energy ranging from 961.00 to 948.00 eV could be ascribed to the states of both Cu2+ and Cu+, in good agreement with the literature.45
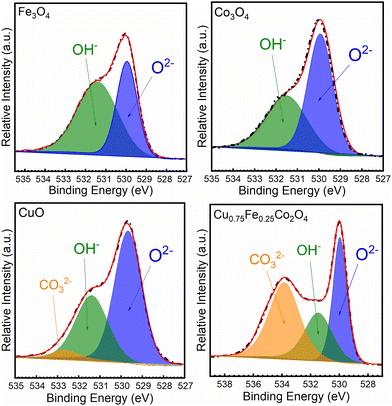
The O 1s core–shell spectra of the synthesized oxides have been recorded and deconvoluted into several prominent peaks, as shown in Fig. 5. The O 1s patterns of the Cu0.75Fe0.25Co2O4 sample exhibit a close profile to that of CuO and a totally different profile to that of Fe3O4 and Co3O4. From the XPS spectra profiles, two to three prominent signals located at BEs of ∼529, ∼531 and ∼532 eV were detected. The most prominent signal detected at the lowest BE (∼529.5 eV) could be ascribed to the lattice oxygen (OLat.) in the metal (Cu0.75Fe0.25Co2O4, CuO, Fe3O4 and Co3O4)–oxygen framework or electrophilic oxygen species (O2−) in surface oxygen vacancies (Ov) and adsorbed oxygen (OAds.), respectively. The two other signals detected at ∼531.2 and ∼532.3 eV were ascribed to the hydroxyl (OH−) and carbonyl groups weakly bonded at the surface of the metal oxide, respectively.46 As for Cu0.75Fe0.25Co2O4, for which the peaks of OAds. were most intense than that of OLat., a completely different profile was shown. The proportions of surface oxygenated species and their ratio (OLat./OAds.) were estimated, and the results are summarized in Table 2. The highest OAds./OLat. ratio of ∼1.90 was obtained for the Cu0.75Fe0.25Co2O4 catalyst, while those of Co3O4 (∼0.55), CuO (∼0.45) and Fe3O4 (∼0.36) were remarkably lower. Obviously, Cu0.75Fe0.25Co2O4 exhibits the largest content of OAds. It is well known that the OAds./OLat. ratio on the metal oxide catalyst surface attests to the presence of more active Ov species.47 OAds. and OLat. are reported to be strongly reactive sites that can attack VOCs in the neighborhood of the maximum electron density and thereby oxidize the carbon framework.48 The presence of superabundant oxygen species and O22− or O− is well known to be beneficial for the catalytic oxidation of CO and C7H8.49 In this regard, it will be rational to deduce that the C7H8 catalytic oxidation process over Cu0.75Fe0.25Co2O4 can occur on OAds. and/or on OLat.in the present investigation.
2.6. Optical energy band gap analysis
Further characterization of the single (CuO, Fe3O4, and Co3O4) and ternary (Cu0.75Fe0.25Co2O4) oxides was achieved by UV-Vis absorption spectroscopy, and typical spectra are shown in Fig. 6. In Fig. 6a, c, e and g, the characteristic bands of each sample were observed, with the absorption spectra decreasing as the wavelength increased in the visible region. These observations are in good agreement with the literature.50 The obtained absorption spectra were used to estimate the bandgap energies from Tauc's equation, and corresponding Tauc plot obtained from (αhυ)2vs. hυ is presented in Fig. 6b, d, f and h. The targeted sample Cu0.75Fe0.25Co2O4 exhibits two optical energy bandgap (EOptg) at 1.2 and 1.55 ± 0.05 eV, values that are much smaller than that of CuO (∼2.65 eV), Fe3O4 (∼2.75 eV), and Co3O4 (∼1.85 and 3.4 eV), respectively. The occurrence of three transition metals with different oxidation states may have provoked microstructural modification as well as an interruption of the band structure, causing the shift of Cu0.75Fe0.25Co2O4EOptg towards a lower value. Additionally, it is well established that the particle size of metals in addition oxides can be used to monitor EOptg, and metal oxides catalysts with small particles size generally exhibits narrow EOptg.51 From a physical point of view, two fundamental reasons in relation to the presence of oxygen vacancies (Ov) and several metals in the matrix of mixed oxides can explain the decrease in EOptg of mixed metal oxide. Firstly, doping can induce an increase of the Ov population in both surface and bulk of the mixed oxides, which, in turn, promotes delocalization of the defect states near the valence band edge. This leads to a decrease in EOptg due to the overlap with the valence band edge, causing the top of the valence band to shift to the forbidden gap.52 Second, metal excess (nonstoichiometric Ov) or deficiency (oxygen excess) in the matrix of mixed oxide induces n-type conductivity and p-type conductivity respectively.53 Therefore, as the Ov concentration gradually increases upon doping, a considerable increase in the electron mass in the conduction band occurs, forcing edge band conduction into the bandgap that, in turn, becomes narrower.54 It is therefore suggested that the observed reduction in the bandgap of Cu0.75Fe0.25Co2O4 nanocrystals can be correlated with Ov created due to the Cu and Fe co-doping,55 as well as with the narrowest particle size displayed by the ternary oxide, as evidenced by XPS, XRD, and SEM analyses. Kouotou et al.11 have previously reported a close correlation between EOptg and the metal oxide catalytic behavior in the oxidation processes. The lowest EOptg obtained for Cu0.75Fe0.25Co2O4 in the present work could facilitate electron mobility in the matrix of the trimetallic oxide and thus enhanced its catalytic performance.56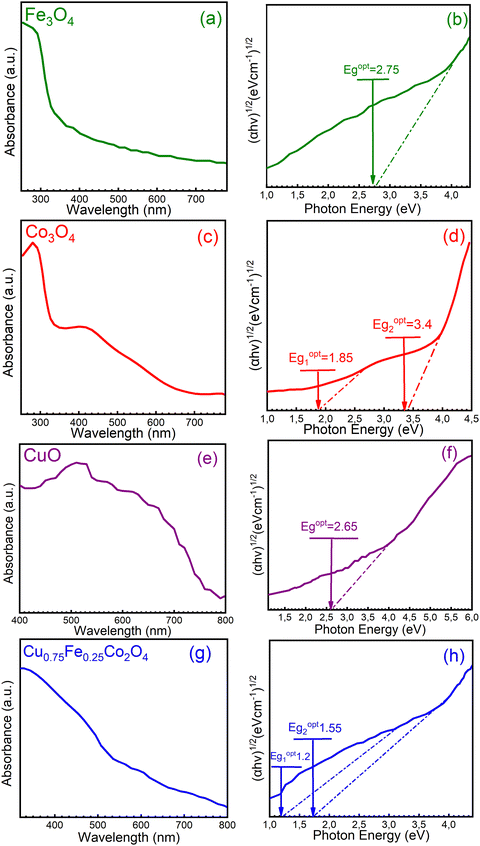 | ||
| Fig. 6 UV-Vis spectrum (a, c, e and g) and (b, d, f and h) (ahν)2vs. hν for (a and b) Fe3O4, (c and d) Co3O4, (e and f) CuO, and (g and h) Cu0.75Fe0.25Co2O4. | ||
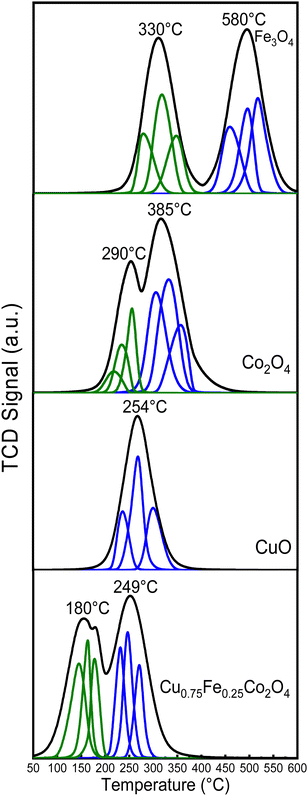
2.7. Temperature-programmed reduction under H2 flow analysis (H2-TPR)
Temperature-programmed reduction under H2 flow (H2-TPR) is a well-established and suitable approach to study the reducibility potential of catalysts. In this work, H2-TPR was performed at a temperature ranging from 100 to 700 °C, as depicted in Fig. 7. The Fe3O4 spectrum shows two reduction peaks, at ∼330 and ∼580 °C, which were ascribed to the reduction of Fe3+ to Fe2+ and of Fe2+ to Fe0 respectively. The characteristic peaks of Co3O4 sample located at ∼290 and ∼385 °C were assigned to the reduction of Co3+ to Co2+ and Co2+ to Co0, respectively.10,19 As far as the H2-TPR profile of CuO is concerned, a single reduction peak at ∼254 °C was observed, which could be attributed to the reduction of Cu2+ to Cu0. Furthermore, three distinct and prominent reduction peaks at 180, 210 and ∼249 °C, which could be ascribed to Cu2+ to Cu0, Co3+ to Co0 and Fe3+ to Fe0 respectively were identified for the Cu0.75Fe0.25Co2O4 spinel, which is in good agreement with previous reported studies.57 According to the detailed quantitative results from Table 3, the relative peak area ratio of peak I and peak II was equal to ∼3.15 for the Co3O4 catalyst, which was slightly superior to the theoretical ratio of 3, which probably revealed an incomplete reduction of Co3+ to Co2+ during the first reduction peak. Compared to pure Co3O4, the reduction processes over Cu0.75Fe0.25Co2O4 shifted to much lower temperatures, with the first peak moving to 180 °C and the second peak to 249 °C. The left-shift of the reduction temperature was a typical signal for better reducibility. In addition, the relative area ratio between peak I and peak II decreased to 1.70, which was lower than the theoretical value of Co3O4 and could be due to the co-doping of Co3O4 with both Cu and Fe, which have generated more active surface oxygen species (see XPS results) over Cu0.75Fe0.25Co2O4, which coupled with H2 at a relatively low-temperature. We can therefore conclude that the synergistic interaction between dopants (Cu and Fe) and Co3O4 caused facile and complete reduction of Cu0.75Fe0.25Co2O4 at lower temperatures, which have easily improved the extraction of OLat. species and weakened the Cu0.75Fe0.25Co2O4 bond. It can be thus proposed that the relocation of OLat. from the bulk to the surface of the Cu0.75Fe0.25Co2O4 catalyst occurred at a relatively low reduction temperature on account of its easy reduction ability, that is favorable for the improvement of the catalytic performance compared to that of individual single oxide.10,58| Catalysts | Deconvoluted peaks | Peak area ratio II/I | ||
|---|---|---|---|---|
| Peak no. | Center (°C) | Area | ||
| Co3O4 | I | 278.4 | 1.01 | 3.15 |
| 259.2 | 1.05 | |||
| 250.3 | 1.15 | |||
| II | 378.1 | 3.87 | ||
| 352.3 | 4.10 | |||
| 325.7 | 2.17 | |||
| Cu0.75Fe0.25Co2O4 | I | 171.9 | 2.20 | 1.70 |
| 162.8 | 2.31 | |||
| 149.9 | 2.10 | |||
| II | 271.3 | 3.7 | ||
| 245.4 | 3.95 | |||
| 231.1 | 3.5 | |||
3. Catalytic performance analysis
To assess the catalytic efficiency of each synthesized sample, C7H8 oxidation was measured in the temperature range of 100–300 °C, and the result is displayed in Fig. 8. With regard to all samples shown in Fig. 8, the C7H8 conversion is temperature-dependent and increases as the reaction temperature rises. Under 120 °C, there is no readily apparent variation in the performances of the catalysts. However, there is a significant variation in the temperature at which the final total oxidation is achieved. Then, C7H8 was gradually, easily and rapidly degraded as the reaction temperature was increased and the following performance order was obtained: Cu0.75Fe0.25Co2O4 > CuO > Co3O4 > Fe3O4. When compared to single-metal oxides (CuO, Co3O4, and Fe3O4), the spinel Cu0.75Fe0.25Co2O4 sample exhibits a higher catalytic performance, reaching 50, 90, and 100% conversion into CO2 and H2O at 190, 210, and 220 °C, respectively. Co3O4 and Fe3O4 exhibit the least effective performance of the tested catalysts, with only a 20% conversion at around 205 °C. Furthermore, the performance of a single CuO at T100 = 230 °C is of about 10 °C, which is slightly lower than that of Cu0.75Fe0.25Co2O4 (T100 = 220 °C), while there is a significant shift in T50 in the direction of the low reaction temperature compared to Co3O4 and Fe3O4. It is clear from the catalytic activity tests that the Cu0.75Fe0.25Co2O4 sample performs better in the deep oxidation of C7H8 due to the substitution of Co by Cu and Fe species in the matrix of Co3O4, which is responsible for the cooling of the reaction temperatures. The results clearly indicated that the performance of the Cu0.75Fe0.25Co2O4 catalyst can be significantly and remarkably improved by the co-presence of Cu and Fe species.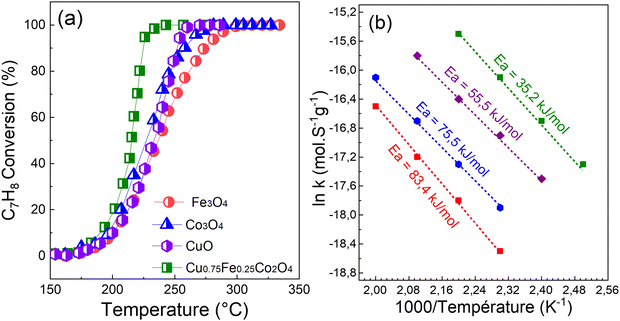 | ||
| Fig. 8 (a) Light-off curves and (b) apparent activation energy (Eg) of C7H8 reaction rates over spinel CuO, Co3O4, Fe3O4, and Cu0.75Fe0.25Co2O4. | ||
The active samples (CuO, Co3O4, Fe3O4, and Cu0.75Fe0.25Co2O4) in this study were compared with other catalysts from earlier published works in order to more accurately assess their performances. The results are shown in Table 4. According to an analysis of the data in this table, under what at first glance appear to be the same test conditions, CuO, Co3O4, Fe3O4, and Cu0.75Fe0.25Co2O4 all demonstrate significantly outstanding catalytic performance.
| Material | Weight (mg) | Gas composition | WHSV (mL g−1 h−1) | T 50 (°C) | T 90 (°C) | Ref. |
|---|---|---|---|---|---|---|
| Singles oxides | ||||||
| CuO | 60 | 5% C7H8/20% O2 in Ar | 20![[thin space (1/6-em)]](https://www.rsc.org/images/entities/char_2009.gif) 000 000 |
237 | 271 | TW |
| Co3O4 | 60 | 5% C7H8/20% O2 in Ar | 20![[thin space (1/6-em)]](https://www.rsc.org/images/entities/char_2009.gif) 000 000 |
215 | 224 | TW |
| Fe3O4 | 60 | 5% C7H8/20% O2 in Ar | 20![[thin space (1/6-em)]](https://www.rsc.org/images/entities/char_2009.gif) 000 000 |
216 | 230 | TW |
| CuO | 300 | 1% C7H8/21% O2 in N2 | 36![[thin space (1/6-em)]](https://www.rsc.org/images/entities/char_2009.gif) 000 000 |
370 | — | 58 |
| MnO2 | 100 | 5% C7H8/20% O2 in Ar | 20![[thin space (1/6-em)]](https://www.rsc.org/images/entities/char_2009.gif) 000 000 |
240 | 280 | 59 |
| Co3O4 | 0.06 | 500 ppm C7H8/20% O2 in Ar | 20![[thin space (1/6-em)]](https://www.rsc.org/images/entities/char_2009.gif) 000 000 |
289 | 292 | 10 |
| Mn2O3 | 100 | 1000 ppm C7H8/20% O2 in Ar | 60![[thin space (1/6-em)]](https://www.rsc.org/images/entities/char_2009.gif) 000 000 |
241 | 275 | 60 |
| Fe2O3 | 600 | 500 ppm C7H8/10% O2 in N2 | 50![[thin space (1/6-em)]](https://www.rsc.org/images/entities/char_2009.gif) 000 000 |
312 | 338 | 61 |
| Co3O4 nanoclusters | 300 | 1000 ppm C7H8/10% O2 in N2 | 20![[thin space (1/6-em)]](https://www.rsc.org/images/entities/char_2009.gif) 000 000 |
264 | 277 | 62 |
| CeO2/SBA-15 | 60 | 0.2% C7H8/4.6% O2 in He | 36![[thin space (1/6-em)]](https://www.rsc.org/images/entities/char_2009.gif) 000 000 |
319 | 410 | 63 |
| Co3O4 | 50 | 2.5 C7H8/5% O2 H2O | 36![[thin space (1/6-em)]](https://www.rsc.org/images/entities/char_2009.gif) 000 000 |
275 | 300 | 64 |
| MnOx | 100 | 100 ppm C7H8/2.5% H2O | 20![[thin space (1/6-em)]](https://www.rsc.org/images/entities/char_2009.gif) 000 000 |
240 | 290 | 65 |
| 3D Co3O4 nanoflower | 0.1 | 1000 ppm C7H8/20% O2 in N2 | 48![[thin space (1/6-em)]](https://www.rsc.org/images/entities/char_2009.gif) 000 000 |
229 | 274 | 66 |
| Mixed oxides | ||||||
| Cu0.75Fe0.25Co2O4 | 60 | 5% C7H8/20% O2 in Ar | 20![[thin space (1/6-em)]](https://www.rsc.org/images/entities/char_2009.gif) 000 000 |
189 | 215 | TW |
| Co2.3Zr0.27O4 | 50 | 2.5 C7H8/5% O2 H2O | 36![[thin space (1/6-em)]](https://www.rsc.org/images/entities/char_2009.gif) 000 000 |
250 | 270 | 64 |
| MnxCoyCezOn | 5 | 1000 ppm C7H8/20% O2 in N2 | 100![[thin space (1/6-em)]](https://www.rsc.org/images/entities/char_2009.gif) 000 000 |
216 | 249 | 67 |
| LaFeO | 200 | 1% C7H8/20% O2 in N2 | 100![[thin space (1/6-em)]](https://www.rsc.org/images/entities/char_2009.gif) 000 000 |
260 | 282 | 68 |
| Co2AlO4 | 3482 | 1% C7H8/20% O2 in N2 | 100![[thin space (1/6-em)]](https://www.rsc.org/images/entities/char_2009.gif) 000 000 |
300 | 325 | 62 |
| MgCo2O4 | 100 | 2.5 C7H8/5% O2 H2O | 36![[thin space (1/6-em)]](https://www.rsc.org/images/entities/char_2009.gif) 000 000 |
242 | 250 | 10 |
| Co–Zr | 600 | 2.5 C7H8/5% O2 H2O | 36![[thin space (1/6-em)]](https://www.rsc.org/images/entities/char_2009.gif) 000 000 |
251 | 278 | 41 |
| MnOx–CeO2 | 300 | 1000 ppm C7H8/20% O2 in N2 | 60![[thin space (1/6-em)]](https://www.rsc.org/images/entities/char_2009.gif) 000 000 |
212 | 220 | 69 |
| Cu0.8Mn2Ce0.2Ox | 200 | 2000 ppm C7H8, air balance | 10000 | 240 | 275 | 70 |
| Cu2Mn1O | 1000 ppm C7H8/20% O2 in N2 | 60![[thin space (1/6-em)]](https://www.rsc.org/images/entities/char_2009.gif) 000 000 |
224 | 229 | 71 | |
| CuCe0.75Zr0.25/TiO2 | 300 | 0.5% C7H8, air balance | 60![[thin space (1/6-em)]](https://www.rsc.org/images/entities/char_2009.gif) 000 000 |
225 | 234 | 72 |
| Supported noble metals | ||||||
| Ag/MnO2 | 60 | 500 ppm C7H8/10% O2 in N2 | 36![[thin space (1/6-em)]](https://www.rsc.org/images/entities/char_2009.gif) 000 000 |
200 | 210 | 59 |
| Pt-MOR | 300 | 1000 ppm C7H8/20% O2 in N2 | 60![[thin space (1/6-em)]](https://www.rsc.org/images/entities/char_2009.gif) 000 000 |
190 | 220 | 73 |
| Pt–pdAl2O3 | 600 | 950 ppm C7H8/20% O2 in N2 | 19![[thin space (1/6-em)]](https://www.rsc.org/images/entities/char_2009.gif) 500 500 |
188 | 214 | 74 |
| Pt–pd-HMS | 200 | 1000 ppm C7H8/20% O2 in N2 | 26![[thin space (1/6-em)]](https://www.rsc.org/images/entities/char_2009.gif) 000 000 |
200 | 235 | 75 |
| Ag–CeO2/SBA-15 | 100 | 0.2% C7H8/4.6% O2 in He | 36![[thin space (1/6-em)]](https://www.rsc.org/images/entities/char_2009.gif) 000 000 |
234 | 250 | 63 |
| Ag2O/SBA-15 | 300 | 0.2% C7H8/4.6% O2 in He | 100![[thin space (1/6-em)]](https://www.rsc.org/images/entities/char_2009.gif) 000 000 |
255 | 270 | 63 |
| Pd/SiO2 | 60 | 1% C7H8/20% O2 in N2 | 100![[thin space (1/6-em)]](https://www.rsc.org/images/entities/char_2009.gif) 000 000 |
185 | 218 | 76 |
| Pd/NiO | 0.5 | 500 ppm C7H8/10% O2 in N2 | 180![[thin space (1/6-em)]](https://www.rsc.org/images/entities/char_2009.gif) 000 000 |
200 | 230 | 77 |
| Pt/Al2O3(S)–I | 100 | 1% C7H8/20% O2 in N2 | 24![[thin space (1/6-em)]](https://www.rsc.org/images/entities/char_2009.gif) 000 000 |
240 | 265 | 78 |
| Pt–Pd–Al2O3 | 600 | 1% C7H8/20% O2 in N2 | 1950 | 190 | 215 | 74 |
Two distinct reaction mechanisms involved in the oxidation of C7H8 over spinel-type mixed oxides were studied and reported by Hertl and Farrauto.14,79 Generally, the decomposition of the carbonyl group at the surface of the catalyst is beneficial for the total oxidation of C7H8 at a temperature ranging from 80 to 200 °C. According to Hertl et al., metal oxide surface lattice oxygen generally reacts with C7H8 molecules at low temperatures (80–200 °C), while carbonate groups from adsorbed oxygen participate in C7H8 total oxidation above ∼200 °C and form H2O and CO2.79 Moreover, it is also possible that an Eley–Rideal (ER) mechanism can be used to complete the oxidation of C7H8 over Cu0.75Fe0.25Co2O4 nanoparticles, with an excessive amount of absorbed oxygen species, serving as active oxygen species. This result shows that co-doping of Co3O4 with Cu and Fe had a significant impact on the physicochemical characteristics of Cu0.75Fe0.25Co2O4. This is because the co-doping provides excellent thermal conductivity and scattering of the charge carrier via agglomeration of copper, iron, and cobalt, leading to better catalytic performance than that of single-metal oxides.80
It has been well established that Polaron jumps can cause an increase in the electrical conductivity of the spinel oxide between the nearby octahedron cations.81 As a result, anionic vacancies near octahedral cations may be suitable location to trap oxygen species. This can increase the electrical resistivity by increasing the distance between octahedral site anions and also improve the catalytic performance by allowing for mass transfer of reactive oxygen species. Numerous characteristics including crystal size and structure, morphology, chemical composition, surface metal content, and oxygen species of a metal oxide catalyst have been reported to have a significant impact on the low-temperature C7H8 catalytic oxidation.15 Therefore, the fast mobility of reactive oxygen species, high active surface area, and good porosity, which result in a long contact time between catalysts and reactants provided by the ternary oxide, as well as the synergetic effects of (Cu, Fe, and Co) metal species, could also be beneficial for the catalytic performance. When ternary oxide (Cu0.75Fe0.25Co2O4) NCs are used as catalysts for C7H8 oxidation, the additional role of synergistic effects among Cu2+, Fe3+, and Co3+ is to enhance the catalytic activity. Additionally, the microstructure analysis revealed a dome top-like morphology with exposition of active sites, which could absorb more oxygen and expose more surface area, leading to the oxidation at relatively low temperatures. In addition, the apparent activation energies (Eappa), calculated using the Arrhenius equation based on the light-off curve in the region where the C7H8 conversion was less than 15%,22 were used to compare the catalytic activity.22Fig. 8b shows the comparison between the achieved Eappa in the current work and the apparent activation energies reported in the literature. Compared to the corresponding Eappa values of pure copper oxide (55.5 kJ mol−1), cobalt oxide (75.5 kJ mol−1), and iron oxide (83.4 kJ mol−1) in the C7H8 total oxidation reaction, Eappa of Cu0.75Fe0.25Co2O4 was found to be the smallest (35.2 kJ mol−1). The Eappa of ternary Cu0.75Fe0.25Co2O4 in its as-prepared state shows that, the agglomeration of the corresponding oxide leads to a dramatic decrease in the Eappa, while the EOptg is becoming narrow with the decrease of the particle size (see Fig. 9) which in turn promotes the catalytic performance as mentioned previously.11
3.1. Reaction mechanism study
In order to explore and propose a possible reaction mechanism involved in the toluene total oxidation over Cu0.75Fe0.25Co2O4, in situ DRIFTS experiments were performed. The experiment was performed at several temperatures and for each temperature, the reaction was maintained for 2 hours. Fig. 10 displays the typical in situ DRIFTS spectra at a reaction temperature ranging from 100 to 230 °C. The typical adsorption bands of toluene can be divided into three wavenumber regions ranging from 1560 to 1355; 1850 to 1610 and 2360 to 2338 cm−1, which can be attributed to the acid carboxylic group, the stretching vibration mode of C![[double bond, length as m-dash]](https://www.rsc.org/images/entities/char_e001.gif) O and adsorbed and/or gaseous carbon monoxide respectively. The asymmetric υ(C
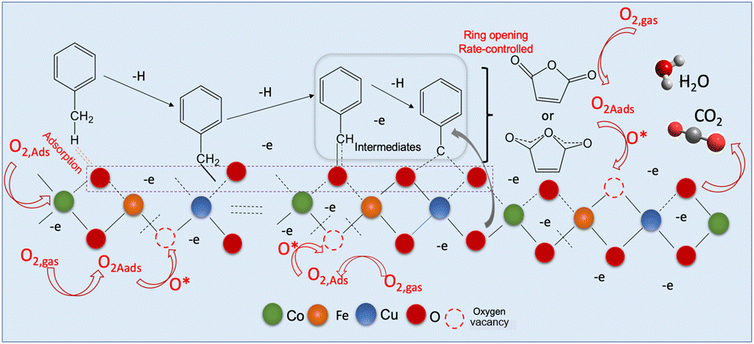
O and adsorbed and/or gaseous carbon monoxide respectively. The asymmetric υ(C![[double bond, length as m-dash]](https://www.rsc.org/images/entities/char_e001.gif) O) stretching vibration signals detected around 1560 cm−1 indicate the occurrence of intermediate products during the reaction process18,82 while the most intense band assigned to carboxylate species (1355–1560 cm−1) makes us believe that benzoate is the crucial intermediate. The signal located at the neighbourhood of 1355 cm−1 is ascribed to the acetate species in agreement with the literature.19 The typical signal of toluene initially increased and later decreased as the temperature increased from 120 to 200 °C, attesting that toluene was effectively decomposed to maleic anhydride species and gradually agglomerated onto the surface of Cu0.75Fe0.25Co2O4. Upon further increase in the reaction temperature to 230 °C, the corresponding benzoate signals (1560–1355 cm−1) totally vanish. This may be due to the further conversion of intermediates (benzyl alcohol/benzoate) to anhydride/acetate, followed by oxidation and complete transformation into CO2 and H2O. Based on the in situ DRIFTS analysis, a most plausible mechanism of toluene total oxidation is proposed as follows: toluene was first adsorbed at the active sites, transformed to a benzyl derivative followed by anhydride and acetate formation, before complete conversion into CO2 and H2O, as displayed in Fig. 11. In this process, indeterminate species vacate from the surface of Cu0.75Fe0.25Co2O4 to create Ov; afterwards, the catalyst upholds gaseous oxygen in the airflow to replenish Ov. Herein, it is worth nothing that the rate-determining step in the toluene deep oxidation is the breakage of the aromatic ring.
O) stretching vibration signals detected around 1560 cm−1 indicate the occurrence of intermediate products during the reaction process18,82 while the most intense band assigned to carboxylate species (1355–1560 cm−1) makes us believe that benzoate is the crucial intermediate. The signal located at the neighbourhood of 1355 cm−1 is ascribed to the acetate species in agreement with the literature.19 The typical signal of toluene initially increased and later decreased as the temperature increased from 120 to 200 °C, attesting that toluene was effectively decomposed to maleic anhydride species and gradually agglomerated onto the surface of Cu0.75Fe0.25Co2O4. Upon further increase in the reaction temperature to 230 °C, the corresponding benzoate signals (1560–1355 cm−1) totally vanish. This may be due to the further conversion of intermediates (benzyl alcohol/benzoate) to anhydride/acetate, followed by oxidation and complete transformation into CO2 and H2O. Based on the in situ DRIFTS analysis, a most plausible mechanism of toluene total oxidation is proposed as follows: toluene was first adsorbed at the active sites, transformed to a benzyl derivative followed by anhydride and acetate formation, before complete conversion into CO2 and H2O, as displayed in Fig. 11. In this process, indeterminate species vacate from the surface of Cu0.75Fe0.25Co2O4 to create Ov; afterwards, the catalyst upholds gaseous oxygen in the airflow to replenish Ov. Herein, it is worth nothing that the rate-determining step in the toluene deep oxidation is the breakage of the aromatic ring.
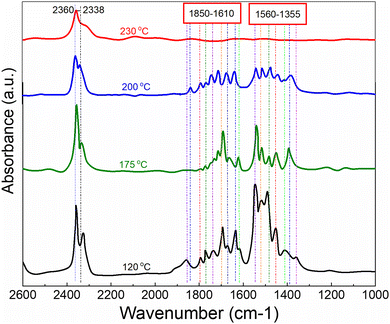 | ||
| Fig. 10 In situ DRIFTS spectra of toluene total oxidation as a function of temperature over Cu0.75Fe0.25Co2O4 in a feed gas composed of 500 ppm toluene + O2 dilute in Ar. | ||
3.2. Stability and reproducibility test of Cu0.75Fe0.25Co2O4
The catalyst durability test also known as stability under prolonged time-on-stream (TOS) was performed at a constant reaction temperature (T100 = ∼225 °C). This experiment was performed in order to evaluate the catalyst ability to remain stable under prolonged reactions. The catalyst ability to reproduce results and the long-term stability are some of the key criteria required for their industrial applications. Herein, both experimental tests were performed, and the results are presented in Fig. 12.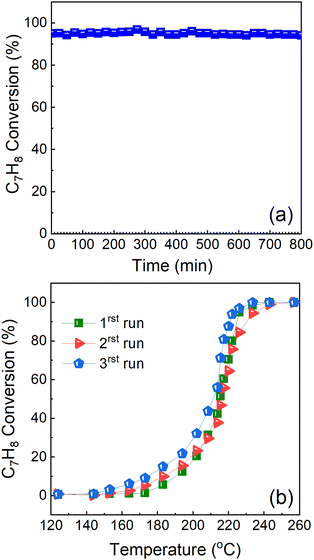 | ||
| Fig. 12 (a) Reproducibility/stability and (b) long-term durability test study of Cu0.75Fe0.25Co2O4 in DME deep oxidation with time-on-stream at 225 °C. | ||
The cycling stability of the Cu0.75Fe0.25Co2O4 catalyst was performed, and the results are presented in Fig. 12a. The results show that the Cu0.75Fe0.25Co2O4 catalyst exhibits excellent cycling stability, after 3 consecutive running steps, indicating a good potential for industrial application as revealed by the excellent cycling stability results. Additionally, stability tests for the Cu0.75Fe0.25Co2O4 sample have been performed over 800 min at a constant T100 = 225 °C, as shown in Fig. 12b. The results indicated that Cu0.75Fe0.25Co2O4 catalysts revealed excellent durability upon continuous toluene conversion, and no significant deactivation was noticed after 800 min time-on-stream. From the obtained results, Cu0.75Fe0.25Co2O4 maintained over 96% toluene conversion and just a negligible decrement in performances of 4% was observed and can be assigned to the coverage of the surface-active sites on Cu0.75Fe0.25Co2O4 NCs by soot particles generated during the oxidation process.
4. Experimental
4.1. Catalyst preparation
The NCs of CuO, Fe3O4, Co3O4 and Cu0.75Fe0.25Co2O4 were prepared by a co-precipitation method and the experimental procedure is detailed below.4.2. Catalyst characterization
Numerous analysis tools were used to analyze the thermally treated CuO, Fe3O4, Co3O4 and CuFeCoO NPs. The details of the characterization methods are presented in ESI 1.†4.3. Catalytic activity analysis
The catalytic behavior of CuO, Fe3O4, Co3O4 and Cu0.75Fe0.25Co2O4 was investigated using a tubular fixed-bed reactor system, and 0.6 g of catalyst was placed in a fixed-bed rector. Complete details of the catalytic performance tests are given in ESI 2.†5 Conclusions
In conclusion, single-oxide (CuO, Co3O4, Fe3O4) and ternary mixed-oxide (Cu0.75Fe0.25Co2O4) catalysts for C7H8 oxidation have been successfully synthesized via a simple co-precipitation approach. Analyses were performed on the catalyst's structure, morphology, composition, and ionic states as well as its optical energy band gap properties. In addition, H2-TPR was used to analyze the reduction characteristics of the prepared oxides. XRD and FTIR analysis revealed nano-sized crystallites. The results of the SEM analysis of the surface microstructure revealed a dome top-like morphology for ternary Cu0.75Fe0.25Co2O4, a homogeneous morphology with fine interconnected particles for CuO, a densely packed morphology for Fe3O4 and a cubic morphology for Co3O4. Ternary Cu0.75Fe0.25Co2O4 exhibits the lowest bandgap energy and reducing properties compared to the synthesized single-metal oxides. The catalytic tests indicated that ternary Cu0.75Fe0.25Co2O4 was the most active sample compared with the single oxides CuO, Co3O4, and Fe3O4. The attractive catalytic performance of ternary Cu0.75Fe0.25Co2O4 was assigned to the combination of synergistic effects between cation sites (Cu2+, Fe2+, Fe3+, Co2+, and Co3+) and chemisorbed oxygen species (O22−, and O−), low-temperature reducibility, low Eoptg, the open porosity observed on the morphology as well as the greater number of oxygen species that provided ideal active sites for the oxidation reaction. Due to the high efficiency, ecological friendliness, and energy-saving qualities of the co-precipitation technique, this work offered a novel method for the development of effective ternary oxides. Therefore, co-doping of Cu and Fe to obtain trimetallic oxides with spinel structure is an effective and useful strategy to enhance the catalytic behavior of single Co3O4 with spinel structure.Author contributions
Hippolyte Todou Assaouka: conceptualization, data curation, formal analysis, investigation, validation, methodology, visualization, writing – original draft. Issah Ngouh Nsangou: conceptualization, data curation, formal analysis, investigation, validation, methodology, visualization, writing – original draft, Daniel Manhouli Daawe: methodology, data curation, formal analysis, visualization, software. Daniel Onana Mevoa: formal analysis, methodology. Abraham Atour Zigla: resources, methodology, writing – review & editing. Patrick Ndouka Ndouka: methodology, data curation, formal analysis, visualization. Patrick Mountapmbeme Kouotou: conceptualization, visualization, formal analysis, writing – original draft, writing – review & editing, funding acquisition, supervision.Conflicts of interest
There are no conflicts to declare.Acknowledgements
Dr Muhammad Waqas from the Department of Mechanical Engineering, College of Engineering and Technology, University of Sargodha, Sargodha 40100, Pakistan is deeply acknowledged to have facilitated some analysis in the present study.References
- N. Li and F. Gaillard, Appl. Catal., B, 2009, 88, 152–159 CrossRef CAS
.
- F. N. Aguero, B. P. Barbero, L. Gambaro and L. E. Cadús, Appl. Catal., B, 2009, 91, 108–112 CrossRef CAS
.
- K. F. Kalz, R. Kraehnert, M. Dvoyashkin, R. Dittmeyer, R. Gläser, U. Krewer, K. Reuter and J.-D. Grunwaldt, ChemCatChem, 2017, 9, 17–29 CrossRef CAS PubMed
.
- A. Sharma and B.-K. Lee, Appl. Catal., A, 2016, 523, 272–282 CrossRef CAS
.
- X. Wang, K. Huang, J. Qian, Y. Cong, C. Ge and S. Feng, Sci. Bull., 2017, 62, 658–664 CrossRef CAS PubMed
.
- W. Tang, W. Xiao, S. Wang, Z. Ren, J. Ding and P.-X. Gao, Appl. Catal., B, 2018, 226, 585–595 CrossRef CAS
.
- M. Wang, D. Chen, N. Li, Q. Xu, H. Li, J. He and J. Lu, ACS Appl. Mater. Interfaces, 2020, 12, 13781–13789 CrossRef CAS PubMed
.
- Q. Zhang, S. Mo, J. Li, Y. Sun, M. Zhang, P. Chen, M. Fu, J. Wu, L. Chen and D. Ye, Catal. Sci. Technol., 2019, 9, 4538–4551 RSC
.
- L. Li, F. Zhang, Z. Zhong, M. Zhu, C. Jiang, J. Hu and W. Xing, Ind. Eng. Chem. Res., 2017, 56, 13857–13865 CrossRef CAS
.
- A. A. Zigla, T. Kox, D. Mevoa, H. T. Assaouka, I. N. Nsangou, D. M. Daawe, S. Kenmoe and P. M. Kouotou, Catalysts, 2022, 12, 411 CrossRef CAS
.
- P. M. Kouotou, H. Vieker, Z. Y. Tian, P. T. Ngamou, A. El Kasmi, A. Beyer, A. Gölzhäuser and K. Kohse-Höinghaus, Catal. Sci. Technol., 2014, 4, 3359–3367 RSC
.
- Y. Dong, J. Zhao, J.-Y. Zhang, Y. Chen, X. Yang, W. Song, L. Wei and W. Li, Chem. Eng. J., 2020, 388, 124244 CrossRef CAS
.
- R. Huang, L. Luo, W. Hu, Z. Tang, X. Ji, L. Chen, Z. Yu, Y. Zhang, D. Zhang and P. Xiao, Catal. Sci. Technol., 2022, 12, 4157–4168 RSC
.
- P. M. Kouotou, M. Waqas, A. El Kasmi, Z. Atour and Z.-Y. Tian, Appl. Catal., A, 2021, 612, 117990 CrossRef
.
- S.-B. Fan, P. M. Kouotou, J.-J. Weng, G.-F. Pan and Z.-Y. Tian, Proc. Combust. Inst., 2017, 36, 4375–4382 CrossRef CAS
.
- L. F. Liotta, Appl. Catal., B, 2010, 100, 403–412 CrossRef CAS
.
- V. H. Vu, J. Belkouch, A. Ould-Dris and B. Taouk, AIChE J., 2008, 54, 1585–1591 CrossRef CAS
.
- S. Mo, Q. Zhang, J. Li, Y. Sun, Q. Ren, S. Zou, Q. Zhang, J. Lu, M. Fu and D. Mo, Appl. Catal., B, 2020, 264, 118464 CrossRef CAS
.
- C. Dong, Z. Qu, Y. Qin, Q. Fu, H. Sun and X. Duan, ACS Catal., 2019, 9, 6698–6710 CrossRef CAS
.
- G. Li, C. Zhang, Z. Wang, H. Huang, H. Peng and X. Li, Appl. Catal., A, 2018, 550, 67–76 CrossRef CAS
.
- Q. Ren, S. Mo, R. Peng, Z. Feng, M. Zhang, L. Chen, M. Fu, J. Wu and D. Ye, J. Mater. Chem. A, 2018, 6, 498–509 RSC
.
- Z.-Y. Tian, P. H. T. Ngamou, V. Vannier, K. Kohse-Höinghaus and N. Bahlawane, Appl. Catal., B, 2012, 117, 125–134 CrossRef
.
- Q. Fu, H. Saltsburg and M. Flytzani-Stephanopoulos, Science, 2003, 301, 935–938 CrossRef CAS PubMed
.
- S. D. Park, S. Won Lee, S. Kang, I. C. Bang, J. H. Kim, H. S. Shin, D. W. Lee and D. Won Lee, Appl. Phys. Lett., 2010, 97, 023103 CrossRef
.
- J. A. Rodriguez, Catal. Today, 2003, 85, 177–192 CrossRef CAS
.
- H. Jiang, X. Xu, R. Zhang, Y. Zhang, J. Chen and F. Yang, RSC Adv., 2020, 10, 5116–5128 RSC
.
- S. Khan and A. K. Narula, Mater. Sci. Eng., B, 2019, 243, 86–95 CrossRef CAS
.
- X. Cao, E. Johnson and M. Nath, ACS Sustainable Chem. Eng., 2019, 7, 9588–9600 CrossRef CAS
.
- M. Waqas, P. M. Kouotou, A. El Kasmi, Y. Wang and Z.-Y. Tian, Chin. Chem. Lett., 2020, 31, 1201–1206 CrossRef CAS
.
- N. V. Suramwar, S. R. Thakare and N. T. Khaty, Int. J. Nano Dimens., 2012, 3, 75–80 Search PubMed
.
- D. Lu, O. A. Zelekew, A. K. Abay, Q. Huang, X. Chen and Y. Zheng, RSC Adv., 2019, 9, 2018–2025 RSC
.
- K. Qadir, S. H. Joo, B. S. Mun, D. R. Butcher, J. R. Renzas, F. Aksoy, Z. Liu, G. A. Somorjai and J. Y. Park, Nano Lett., 2012, 12, 5761–5768 CrossRef CAS PubMed
.
- J. Ma, J. Teo, L. Mei, Z. Zhong, Q. Li, T. Wang, X. Duan, J. Lian and W. Zheng, J. Mater. Chem., 2012, 22, 11694–11700 RSC
.
- R. Lakshmi and S. Sasikumar, Int. J. Nanomed., 2015, 10, 129 CAS
.
- N. Bahlawane, E. F. Rivera, K. Kohse-Höinghaus, A. Brechling and U. Kleineberg, Appl. Catal., B, 2004, 53, 245–255 CrossRef CAS
.
- T. Yamashita and P. Hayes, Appl. Surf. Sci., 2008, 254, 2441–2449 CrossRef CAS
.
- J. Cheng, J. Yu, X. Wang, L. Li, J. Li and Z. Hao, Energy Fuels, 2008, 22, 2131–2137 CrossRef CAS
.
- F. Bao, X. Wang, X. Zhao, Y. Wang, Y. Ji, H. Zhang and X. Liu, Catal. Sci. Technol., 2014, 13, 22–25 Search PubMed
.
- H. Gao, X. Wang, G. Wang, C. Hao, C. Huang and C. Jiang, J. Mater. Chem. C, 2019, 7, 13267–13278 RSC
.
- M. A. Zamudio, S. Bensaid, D. Fino and N. Russo, Ind. Eng. Chem. Res., 2011, 50, 2622–2627 CrossRef CAS
.
- X. Zhang, M. Zhao, Z. Song, H. Zhao, W. Liu, J. Zhao and Y. Xing, New J. Chem., 2019, 43, 10868–10877 RSC
.
- W. Liu, B. Wang, C. Cui, Y. Zhang, L. Wang and Z. Wang, Mater. Lett., 2021, 289, 129378 CrossRef CAS
.
- C. Chen, L. Liu, Y. Li, W. Li, L. Zhou, Y. Lan and Y. Li, Chem. Eng. J., 2020, 384, 123257 CrossRef CAS
.
- C. Song, Z. Zhao, H. Li, D. Wang and Y. Yang, RSC Adv., 2016, 6, 102931–102937 RSC
.
- T. Yanom, M. Ebizuka, S. Shibata and M. Yamane, J. Electron Spectrosc. Relat. Phenom., 2003, 131–132, 133–144 CrossRef
.
- J. Lei, S. Wang and J. Li, Ind. Eng. Chem. Res., 2020, 59, 5583–5590 CrossRef CAS
.
- K. Wang, Y. Cao, J. Hu, Y. Li, J. Xie and D. Jia, ACS Appl. Mater. Interfaces, 2017, 9, 16128–16137 CrossRef CAS PubMed
.
- P. Li, D. E. Miser, S. Rabiei, R. T. Yadav and M. R. Hajaligol, Appl. Catal., B, 2003, 43, 151–162 CrossRef CAS
.
- L. F. Liotta, H. Wu, G. Pantaleo and A. M. Venezia, Catal. Sci. Technol., 2013, 3, 3085–3102 RSC
.
- S. Sheik Fareed, N. Mythili, H. Mohamed Mohaideen, K. Saravanakumar, R. Chandramohan and G. Ravi, J. Mater. Sci.: Mater. Electron., 2016, 27, 3420–3426 CrossRef CAS
.
- A. A. Ansari, J. P. Labis, M. Alam, S. M. Ramay, N. Ahmad and A. Mahmood, Acta Metall. Sin. (Engl. Lett.), 2016, 29, 265–273 CrossRef CAS
.
- E. Lee, A. Benayad, T. Shin, H. Lee, D.-S. Ko, T. S. Kim, K. S. Son, M. Ryu, S. Jeon and G.-S. Park, Sci. Rep., 2014, 4, 1–8 Search PubMed
.
- A. N. Banerjee and K. K. Chattopadhyay, Prog. Cryst. Growth Charact. Mater., 2005, 50, 52–105 CrossRef CAS
.
- A. K. M. Alsmadi, B. Salameh and M. Shatnawi, J. Phys. Chem. C, 2020, 124, 16116–16126 CrossRef CAS
.
- Z.-Y. Tian, N. Bahlawane, V. Vannier and K. Kohse-Höinghaus, Proc. Combust. Inst., 2013, 34, 2261–2268 CrossRef CAS
.
- Y.-H. Lin, H. Faber, J. G. Labram, E. Stratakis, L. Sygellou, E. Kymakis, N. A. Hastas, R. Li, K. Zhao and A. Amassian, Adv. Sci., 2015, 2, 1500058 CrossRef PubMed
.
- S. Zhang, J. Ma, Z. Hu, G. Cui and L. Chen, Chem. Mater., 2019, 31, 6033–6065 CrossRef CAS
.
- C. He, Y. Yu, L. Yue, N. Qiao, J. Li, Q. Shen, W. Yu, J. Chen and Z. Hao, Appl. Catal., B, 2014, 147, 156–166 CrossRef CAS
.
- Y. Qin, Y. Wang, J. Li and Z. Qu, Surf. Interfaces, 2020, 21, 100657 CrossRef CAS
.
- X. Yang, X. Yu, M. Lin, X. Ma and M. Ge, Catal. Today, 2019, 327, 254–261 CrossRef CAS
.
- Y. Wang, L. Zhang and L. Guo, ACS Appl. Nano Mater., 2018, 1, 1066–1075 CrossRef CAS
.
- Q. Zhang, S. Mo, B. Chen, W. Zhang, C. Huang and D. Ye, Mol. Catal., 2018, 454, 12–20 CrossRef CAS
.
- N. N. Mikheeva, V. I. Zaikovskii, Y. V. Larichev and G. V. Mamontov, Mater. Today Chem., 2021, 21, 100530 CrossRef CAS
.
- M. Wang, D. Chen, N. Li, Q. Xu, H. Li, J. He and J. Lu, Small, 2020, 16, 2005715 CrossRef CAS PubMed
.
- M. Li, C. Zhang, L. Fan, Y. Lian, X. Niu and Y. Zhu, ACS Appl. Mater. Interfaces, 2021, 13, 10089–10100 CrossRef CAS PubMed
.
- Q. Ren, Z. Feng, S. Mo, C. Huang, S. Li, W. Zhang, L. Chen, M. Fu, J. Wu and D. Ye, Catal. Today, 2019, 332, 160–167 CrossRef CAS
.
- H. Chen, W. Cui, D. Li, Q. Tian, J. He, Q. Liu, X. Chen, M. Cui, X. Qiao and Z. Zhang, Ind. Eng. Chem. Res., 2020, 59, 10804–10812 CrossRef CAS
.
- J. Yang, S. Liu, T. He, L. C. Nengzi, Y. Wang, L. Su and M. Geng, J. Environ. Chem. Eng., 2021, 9, 106361 CrossRef CAS
.
- H. Sun, X. Yu, X. Ma, X. Yang, M. Lin and M. Ge, Catal. Today, 2020, 355, 580–586 CrossRef CAS
.
- B. Heidinger, S. Royer, J.-M. Giraudon, O. Gardoll, H. Alamdari and J.-F. Lamonier, ChemCatChem, 2020, 12, 2271–2282 CrossRef CAS
.
- J. Hu, W. B. Li and R. F. Liu, Catal. Today, 2018, 314, 147–153 CrossRef CAS
.
- C. Zhao, Q. Hao, Q. Zhang, N. Yan, J. Liu, B. Dou and F. Bin, Appl. Catal., A, 2019, 569, 66–74 CrossRef CAS
.
- J. Zhang, C. Rao, H. Peng, C. Peng, L. Zhang, X. Xu, W. Liu, Z. Wang, N. Zhang and X. Wang, Chem. Eng. J., 2018, 334, 10–18 CrossRef CAS
.
- X. Liu, Q. Zhang, P. Ning, T. Tang, J. Hu and W. Su, Catal. Commun., 2018, 115, 26–30 CrossRef CAS
.
- Q. Zhang, W. Su, P. Ning, X. Liu, H. Wang and J. Hu, Chem. Eng. Sci., 2019, 205, 230–237 CrossRef CAS
.
- H. Wang, Y. Zhang, M. Wu, H. Xu, X. Jin, J. Zhou and Z. Hou, Ind. Eng. Chem. Res., 2020, 59, 20316–20324 CrossRef CAS
.
- Q. Meng, J. Liu, X. Weng, P. Sun, J. A. Darr and Z. Wu, Catal. Sci. Technol., 2018, 8, 1858–1866 RSC
.
- T. Gan, X. Chu, H. Qi, W. Zhang, Y. Zou, W. Yan and G. Liu, Appl. Catal., B, 2019, 257, 117943 CrossRef CAS
.
- W. Hertl and R. J. Farrauto, J. Catal., 1973, 29, 352–360 CrossRef CAS
.
- G. E. Childs, L. J. Ericks and R. L. Powell, Mater. Today Chem., 2019, 11, 215–220 Search PubMed
.
- E. J. W. Verwey, Ind. Eng. Chem. Res., 1951, 155, 322–331 Search PubMed
.
- M. Li, K. N. Hui, K. S. Hui, S. K. Lee, Y. R. Cho, H. Lee, W. Zhou, S. Cho, C. Y. H. Chao and Y. Li, Appl. Catal., B, 2011, 107, 245–252 CrossRef CAS
.
Footnote |
| † Electronic supplementary information (ESI) available: ESI 1: catalyst characterization technique(s); ESI 2: catalytic performance measurement conditions; ESI 3: FTIR analysis details; Fig. S1: FTIR spectra of single oxide; Fig. S2: FTIR spectrum of ternary oxide; Fig. S3: EDS spectra of singles oxides; Fig. S4: Auger spectrum; Table S1: H2-TPR quantitative data. See DOI: https://doi.org/10.1039/d3ya00082f |
| This journal is © The Royal Society of Chemistry 2023 |

