Understanding the partitioning behavior of single-walled carbon nanotubes using an aqueous two-phase extraction system composed of non-ionic surfactants and polymers†
Pranjala
Tiwari
*a,
Błażej
Podleśny
a,
Maciej
Krzywiecki
 b,
Karolina Z.
Milowska
 cde and
Dawid
Janas
 *a
*a
aDepartment of Chemistry, Silesian University of Technology, B. Krzywoustego 4, 44-100, Gliwice, Poland. E-mail: Pranjala.Tiwari@polsl.pl; Dawid.Janas@polsl.pl
bInstitute of Physics-CSE, Silesian University of Technology, Konarskiego 22B, 44-100 Gliwice, Poland
cCIC nanoGUNE, 20018 Donostia-San Sebastián, Spain
dIkerbasque, Basque Foundation for Science, 48013 Bilbao, Spain
eTCM Group, Cavendish Laboratory, University of Cambridge, Cambridge CB3 0HE, UK
First published on 2nd March 2023
Abstract
In this work, a Pluronic/Dextran system was developed to discover the mechanism of the aqueous two-phase extraction (ATPE) technique, which is widely employed for the sorting of single-walled carbon nanotubes (SWCNTs) and other types of nanomaterials. The role of the phase-forming components and partitioning modulators was comprehensively investigated to gain greater insights into the differentiation process. The obtained results revealed that sodium dodecyl sulfate and sodium dodecylbenzene sulfonate operated as excellent partitioning modulators, enabling the diameter-based sorting of SWCNTs. Additionally, the data strongly suggested that different densities of various SWCNT species drove the movement of SWCNTs in the ATPE system. Consequently, the largest diameter SWCNTs were first influenced by surfactants and, thus, the nanotubes migrated towards a lower density top phase in the following order (7,5) > (8,3) > (6,5) > (6,4). Based on the in-depth analysis of the partitioning system, a mechanism was proposed that described the method in which the popular ATPE separation technique operates.
New conceptsThe goal of this work was to elucidate the mechanism of the aqueous two-phase extraction (ATPE) method, which has considerable application potential for purifying many classes of nanomaterials. A new Pluronic/Dextran system was developed, and its modus operandi was comprehensively analyzed by sorting polydisperse mixtures of single-walled carbon nanotubes (SWCNTs). Consequently, it was revealed that the phase-forming compounds, commonly regarded as passive participants of the process, actively engage in purification. Moreover, the combination of novel experimental pathways with molecular dynamics unraveled the impact of surfactants on SWCNT partitioning. Previously unreported differences between widely employed sodium dodecylbenzene sulfonate and sodium dodecyl sulfate, which determine interactions with nanomaterials, were uncovered. |
1. Introduction
The physical properties of single-walled carbon nanotubes (SWCNTs) are often determined by the order of carbon atoms in a nanotube.1–3 Consequently, optimization of the material's structure to match SWCNTs with specific applications is both necessary and of considerable interest. However, to date, this problem has only been partially solved due to the formidable challenges in controlling the SWCNT architecture on the atomic scale. Numerous studies have been conducted to achieve structural homogeneity4via selective synthesis5 and post-synthesis separation techniques.6 Among the most popular SWCNT purification techniques, such as chromatography,7 ultracentrifugation,8 electrophoresis,9 selective solubilization,10etc., the aqueous two-phase extraction (ATPE) method exhibits exceptional efficiency, so it is frequently employed to enrich materials with the targeted type of SWCNTs.11–14In general, in the case of SWCNT separation, three types of biphasic systems have been reported: poly(ethylene glycol)/dextran, poly(ethylene glycol)/polyacrylamide, and polyvinylpyrrolidone/dextran.4 The former option is the most commonly used due to the wide availability of such compounds and favorable interactions with SWCNTs.11 During the formation of a biphasic system from poly(ethylene glycol) and dextran, the surfactants facilitate the extraction while the phase-forming components are suspected to play a passive role in the process. Surface-active compounds such as DNA,15 sodium cholate, sodium deoxycholate, sodium dodecyl sulfate, and their combination12,16,17 have been introduced into separation systems to direct specific types of SWCNTs to one of the phases. Furthermore, other factors, including the molecular weight of phase-forming components,18 temperature,19 and pH,20 can influence the separation outcome. Optimization of the parameters has enabled the isolation of SWCNTs with particular length,21 diameter distribution,22 chirality,18 and even handedness.15 Recently, reports have shown that this separation concept can be extended to process large-diameter SWCNTs with high selectivity.12
However, as indicated above, the function of phase-forming components in this process is not fully understood, as they are assumed to play a secondary role in ATPE. Lyu et al. reported that the molecular weight of phase-forming compounds influenced the partition behavior, and an appropriate selection of molecular weight minimized the interfacial trapping of SWCNTs.18 It was found that poly(ethylene glycol) (PEG; 1.5 kDa) combined with dextran (DEX; 250 kDa), due to the action of surfactants, enabled the isolation of multiple SWCNT chiralities with a minimum amount of SWCNTs locked at the interface. Nevertheless, as the differences in the properties of various PEGs and DEXs were not vastly significant, the mechanism of the ATPE of SWCNTs was not fully elucidated.
Dissatisfying progress is unfortunate as a spectrum of other phase-forming compounds may be utilized in ATPE to gain a greater understanding of this purification approach. PEG and DEX can be substituted with other ATPE-relevant compounds to accomplish this goal, provided that they have the capability to host SWCNTs. Pluronics, also known as poloxamers, are non-ionic block copolymer compounds consisting of a propylene oxide hydrophobic long chain surrounded by two hydrophilic poly(ethylene oxide) blocks. Several studies have been conducted on Pluronics, and have shown them as efficient dispersants for single- and multi-walled CNTs because of their high water solubility (up to 10 wt% at 20 °C), which promotes dispersion of higher quantities of SWCNTs.23 Additionally, they are some of the mildest surfactants with minimal cytotoxicity and long-term viability, proving an excellent choice as a solubilizer, especially in biomedical applications.24,25 Besides being an efficient SWCNT dispersant, previous report by our research group has shown that Pluronic could act as an ATPE modulator to favor the separation of SWCNTs depending on their diameter in a typical PEG/DEX system.20 Owing to the Pluronic F-127's structural similarity to PEG, it displays preferential occupation in the top phase, resulting in the extraction of larger diameter SWCNTs from the bottom to the top phase with increasing Pluronic concentration. Beyond the field of SWCNTs, Yeredla et al. combined Pluronic F-127 with DEX, resulting in a biphasic system in which self-assembled poly(lactide-co-glycolide)-based microparticles with various morphologies were obtained.26 Furthermore, the extractability of cytochrome was explored using Pluronic L61- and Pluronic 25R2-based two-phase systems, which were achieved by heating stock solutions of Pluronics above their cloud points.27 However, to the best of our knowledge, the combination of non-ionic polymers with dextran to form a two-phase system for SWCNT separation has yet to be explored.
In this work, Pluronic L-35 was used as a substitute for PEG in a classical PEG/DEX ATPE platform to interpret the underlying factors that govern the separation. Our findings indicated that Pluronic/DEX systems offered a diameter-based purification approach for SWCNTs when anionic surfactants, such as SDS and SDBS, were employed to promote partitioning. Furthermore, subtle differences between widely employed SDS and SDBS were revealed (commonly engaged for the nanomaterial solubilization), which may be exploited to enhance their utility across a broad spectrum of applications. Finally, an in-depth investigation of the parameter space via experimental and molecular dynamics (along with Monte Carlo simulations) pathways enabled the construction of a proposed mechanism for the purification process, highlighting the role of surfactants and phase-forming agents in this process.
2. Results and discussion
2.1. Analysis of the influence of surfactants on the partitioning of SWCNTs
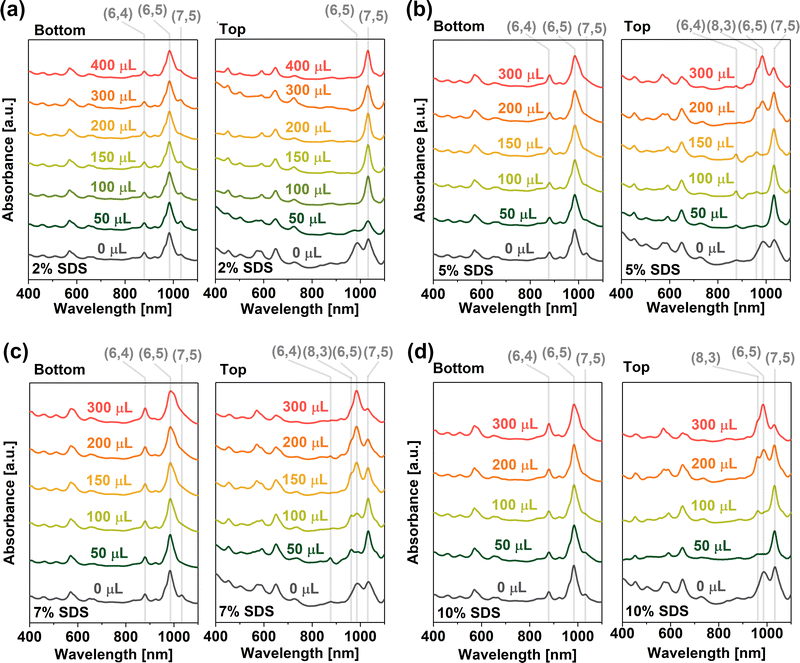
The effects of four different surfactants, namely SC, DOC, SDS, and SDBS, were first examined to determine their suitability towards differentiation of SWCNTs between the phases in the PL-35/DEX system. Initially, we assessed bile salt surfactants (SC and DOC), which generally shifted SWCNTs to the DEX phase20 (Fig. S8, ESI†). We investigated the possibility of producing a monochiral fraction in the top phase by moving all but one type of SWCNTs to the bottom phase. However, the action of both surfactants was too strong. It is known that bile salt surfactants have a very high affinity to SWCNTs, so they can easily exchange Pluronic molecules on the surface. Hence, even small amounts of DOC moved all SWCNTs to the bottom phase (Fig. S8a, ESI†), while the application of a less potent SC at lower concentrations shifted SWCNTs to the bottom phase more gradually (Fig. S8b, ESI†). Nonetheless, the partitioning between the phases was not satisfactory due to the addition of SC and DOC not enabling an appropriate interpretation of the ATPE system; therefore, surfactants (SDS and SDBS) that typically promote the migration of SWCNTs to the top phase were used.2% SDS was employed as a modulating agent in the volume range of 50–400 μL, and the spectra of the separated bottom and top phases were recorded (Fig. 1a). Though the absorption spectra of the bottom phase were similar regardless of SDS added and showed mainly the presence of (6,4), (6,5), and (7,5) chiralities, the top phase spectra presented peculiar results. As soon as a minimal amount of 2% SDS was added (50 μL), the peak representing the (6,5) chirality in the top phase suddenly decreased in intensity. Simultaneously, (7,5) SWCNTs became the majority type of SWCNTs in the top phase in the explored wavelength range. Noticeably, as the volume of SDS increased to 400 μL, the peak attributed to (6,5) SWCNTs (d = 0.757 nm) was further reduced and disappeared at higher concentrations, which led to the isolation of larger diameter species such as (7,5) SWCNTs (d = 0.829 nm) in this phase. Unfortunately, a further increase in the SDS amount led to the disappearance of phase separation in the sample due to excessive dilution of the system, which moved the operating point to the single-phase area. To overcome the dilution issue, we employed SDS stock solutions of higher concentrations (5%, 7%, and 10%) and evaluated the impact of these additions (Fig. 1b–d, respectively).
Comparison of the bottom phase spectra showed that the application of a higher amount of SDS substantially decreased the content of (7,5) SWCNTs (d = 0.829 nm) therein, as the peak centered at ca. 1020 nm was nearly eliminated. Simultaneously, higher concentrations of SDS enriched the bottom phase with (6,4) SWCNTs (d = 0.692 nm). While the overall shape of the spectra of the bottom phase showed only slight differences, and all fractions seemed rich in (6,5) SWCNTs (d = 0.757 nm), with an increase in the surfactant concentration, the content of small-diameter SWCNTs therein notably increased (Fig. S9, ESI†).
The top phase spectra revealed even more substantial changes at higher concentrations of SDS. While no significant differences were observed for 2% SDS addition (Fig. 1a), already 5% SDS (Fig. 1b) had a strong impact on the shape of the spectra. The stepwise extraction of SWCNTs began with large diameter SWCNTs. Initially, at low SDS volumes, (7,5) SWCNTs dominated the top phase. 5% SDS solution was particularly instructive as its addition highlighted how the major SWCNT species migrated to the top phase according to the diameter. That is (7,5), (8,3), and (6,5) SWCNTs emerged in the top phase in the given order. The changes were even more dramatic when 7% SDS was employed (Fig. 1c). With 50 μL of the modulator, the top phase contained (8,3) SWCNTs (d = 0.782 nm) as well as (6,4), (6,5), and (7,5) SWCNTs. As the concentration of the modulator increased, (6,5) SWCNTs dominated the top phase fractions because (6,5)-enriched CoMoCAT SWCNTs were the majority type of SWCNTs in the raw material. Finally, the effect of addition of 10% SDS (Fig. 1d) was similar to that at lower concentrations, but the observed changes were much more rapid. Importantly, addition of higher volumes of SDS solutions (beyond 300 μL) led to the homogenization of the phases. This issue limited our experimental analysis capacity, which hindered our ability to understand how the purification of SWCNTs was promoted by via SDS addition. Unfortunately, it was also impossible to separate pure (6,4) SWCNTs in the bottom phase as the ongoing transfer of (6,5) SWCNTs to the top phase was not completed before the system became monophasic. Nevertheless, it was concluded that SDS in the PL-35/DEX system drove the separation of SWCNTs by diameters.
Since the dispersion used in the above analysis ((6,5)-enriched CoMoCAT SWCNTs) consisted of only a subset of possible chiralities, tracking the movement of more SWCNTs types to verify the universal nature of these findings was not possible. Therefore, to gain a better understanding of SWCNT portioning by ATPE, similar experiments were performed on a sample containing unsorted HiPco SWCNT dispersion (Fig. S10, ESI†), which included broader diameter distributions.13 For analytical purposes, 2% SDS was selected in a similar range of SDS volumes (50–300 μL). As found with our previous results, the sample series with HiPco dispersion displayed analogous trends. The topmost spectra in Fig. S10 (ESI†) confirmed that (6,4) SWCNTs with the smallest diameter was the last SWCNT type to move towards the top phase with the increasing SDS concentration. Thus, the upwards movement of SWCNTs in the PL-35/DEX system followed the order of (7,5) > (8,3) > (6,5) > (6,4), indicating that SWCNTs of the largest diameter migrated to the top phase at first, subsequently followed by the smaller diameter ones.
Closer analysis of the obtained spectra revealed that (6,4) SWCNTs resided in the top phase at the smallest SDS concentration (indicated with an arrow in Fig. S10, ESI†). As the SDS concentration was increased, this SWCNT type became almost undetectable. (6,4) SWCNTs were identified in the PL-35/DEX system even before SDS addition (Fig. S5d, ESI†) due to the high PL-35 content and low SDS amount, promoting (6,4) SWCNT migration to the top phase. This oddity, which enabled us to postulate the mechanism of ATPE, will be further explored in Section 2.3.
The successful separation by the SDS surfactant inspired the investigation of the impact of surfactant structure modification on the operation of the new biphasic system. The experiment utilized SDBS, which had some similarities to SDS. Two factors differentiate SDBS from SDS, the end group (sulfonate vs. sulfate) and the presence of the benzene ring. The separation outcomes are shown in Fig. S11 (ESI†). SDBS stock solutions were prepared with the same weight percentage and added in similar step function ranges in order to obtain accurate comparison. Surprisingly, the PL-35/DEX system withstood much larger amounts of SDBS surfactant at a given concentration. As mentioned above, the biphasic system was disrupted beyond the addition of SDS 300–400 μL regardless of the concentration (2–10%) due to the impact of the surfactant at the binodal curve position and excessive dilution. However, for SDBS, both phases remained intact even with the addition of 900 μL at 2% and 7% stock solution concentrations. Hence, SDBS had a smaller impact on the position of the binodal curve than SDS. A wider operational window for this surfactant enabled for a more comprehensive study of SWCNT separation.
The SWCNT movement order remained the same as in the case of SDS, showing preferential migration in the order of (7,5) > (8,3) > (6,5) > (6,4) to the lower density Pluronic-rich phase. The observed trend may stem from the fact that SDS and SDBS were structurally and chemically similar. Fig. 1a and Fig. S11a (ESI†) further revealed that the minimum concentration of 2% of SDS or SDBS required to migrate the majority of (7,5) chirality to the top phase was comparable (100 μL vs. 50 μL). However, after the addition of 400 μL, SDS displayed mostly (7,5) chirality in the top phase, whereas for SDBS (8,3) and (6,5) chiralities were present in the top phase as well as (7,5). As expected, the application of 7% SDBS (Fig. S11b, ESI†) enhanced the discrepancies between the two surfactants. In the case of 50 μL SDS, the top phase was rich in (7,5) SWCNTs, whereas with the same amount of SDBS the top phase resembled the parent dispersion, i.e. (6,5) chirality was predominant. Hence, the application of SDBS promoted the migration of a greater amount of SWCNTs to the top phase. In contrast to SDS, SDBS partitioning power was much more significant. Consequently, the bottom phase resulting from 7% SDBS addition exhibited a high amount of (6,4) SWCNTs.
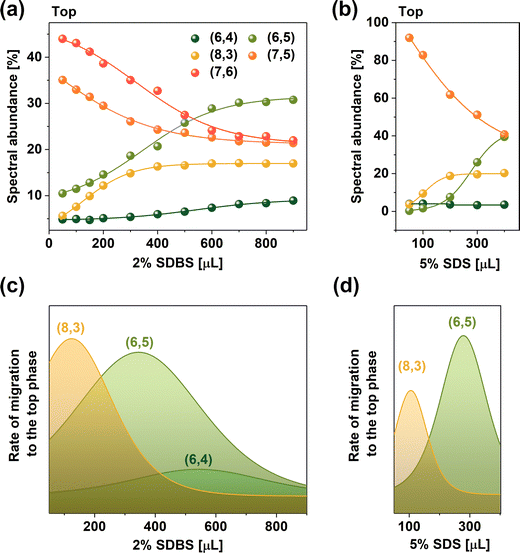
Fig. 2a quantifies the influence of the SDBS addition on the top phase composition as SWCNTs are dislocated from the bottom phase. For this analysis, deconvoluted data acquired across a wider wavelength range from 400 to 1250 nm was used (example given in Fig. S12 (ESI†) illustrates the process of peak deconvolution). The results showed that already at low SDBS volumes, the amount of large diameter SWCNTs, such as (7,6) (d = 0.895 nm) and (7,5) (d = 0.829 nm), in the top phase decreased considerably as the low diameter SWCNTs were shifted therein. Concomitantly, a gradual increase in the content of several smaller-diameter species was observed. The derivative of this curve presented in Fig. 2c highlights that larger SWCNTs of the (8,3) chirality first transitioned to the top phase, followed by (6,5) and (6,4) SWCNTs, confirming the diameter base differentiation mechanism postulated above.
The partitioning process facilitated by 2% SDBS was compared with the application of 5% SDS as the modulator (Fig. 2b and d). Regardless of the concentration difference, the trends in both cases were the same. Interestingly, the maximum rate for the SWCNT migration of (8,3) SWCNTs occurred at 120 μL of 2% SDBS and 105 μL of 5% SDS. Analogously, (6,5) SWCNT partitioning was most prominent at 345 μL of 2% SDBS and ca. 275 μL of 5% SDS. Based on the difference in the surfactant amount needed to facilitate the migration of specific SWCNTs from the bottom to the top phase, it was concluded that, on average, SDBS was ca. 2.5× stronger partitioning modulator than SDS. Moreover, some chirality dependence was observed as the discrepancy in the surfactant volume was higher for (6,5) SWCNTs than that for (8,3) SWCNTs.
2.2. Modeling of SWCNT–surfactant interactions
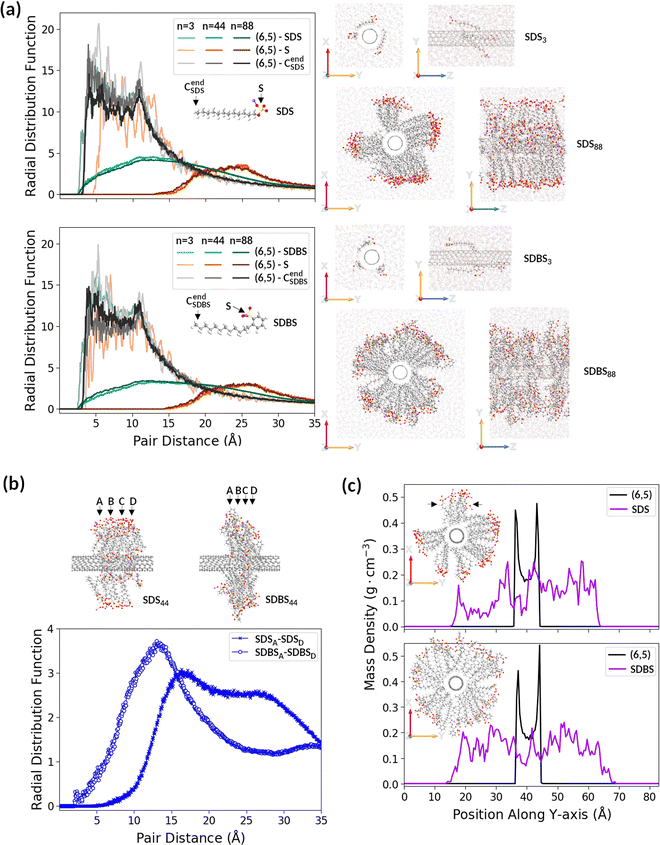
We investigated SDBS potency as a partitioning modulator compared to SDS. To the best of our knowledge, despite the widespread use of these surfactants, there is no detailed comparison in the literature showing how the SWCNT solubilization power of SDS and SDBS differs after addition at the same concentration onto SWCNTs. Therefore, in order to discover possible differences between these two surfactants, we carried out molecular dynamics (MD) and subsequent time-stamped force-bias Monte Carlo (MC) simulations on (6,5) SWCNT surrounded by SDS or SDBS molecules in water (Fig. 3 and Fig. S13, ESI†). Interactions between SWCNTs and both surfactants were examined at three different surfactant concentrations: 3, 44, and 88 molecules of SDS or SDBS per 1 unit of (6,5) SWCNT (364 C atoms, ca. 4 nm long) immersed in water. These concentrations corresponded to the SWCNT surface coverages of 0.3, 4.4, and 8.9 molecules per nm2.The calculation results presented in Fig. 3 show that the orientation of both surfactants toward SWCNTs strongly depended on concentration. When only a few surfactant molecules were present in the simulation box, they were preferably aligned with the nanotube (Fig. 3a, first and third rows on the right panel) rather than remain orientated perpendicular to the nanotube lateral surface, as initially placed. The radial distribution function (RDF) analysis indicated (Fig. 3a, left panel) that SDBS molecules lay flatter on the SWCNT surface than SDS molecules, and the SDBS sulfonate group was positioned closer to the lateral surface of SWCNT than the SDS sulfate group, which protrude toward the aqueous phase. The minimal distance between the SDBS's last carbon atom (CendSDBS) and nanotube carbon atoms (3.8 Å) was similar to the minimal distance between the SDBS sulfur atom and nanotube carbon atoms (3.9 Å), while the minimal distance between the SDS sulfur atom and nanotube carbon atoms (close to 5 Å) was larger than that between the SDS last carbon atom (CendSDBS) and nanotube carbon atoms (3.6 Å). The shorter distance between SWCNTs and SDBS molecules (compared to SDS) may result from π–π stacking of the benzene ring (present only in this surfactant) on the SWCNT surface.
At higher surfactant concentrations, SDS and SDBS molecules were orientated away from the SWCNT surface, creating hedgehog-like structures (Fig. 3a, second and fourth rows in the right panel). These structures were maintained even after prolongation of the simulation time (Fig. S14, ESI†). For systems containing 44 or 88 surfactant molecules, the first peaks of (6,5)-S RDFs (orange and brown lines) appeared between 15 and 20 Å, whereas those of (6,5)-Cend RDFs (dark grey and black lines) were still below 4 Å (Fig. 3a, left panel), indicating that the sulfonate and sulfate groups moved away from the nanotube with increasing concentrations of surfactants.
A closer inspection of systems containing 44 SDS and 44 SDBS revealed differences between their arrangement around SWCNT. SDBS molecules were arranged much closer together along the SWCNT symmetry axis (Z-axis) compared to SDS molecules. As shown in Fig. 3b, the minimal distance between the most distant SDBS layers along SWCNT was considerably smaller than in the case of SDS layers (cf. positions of the first peak of SDSA-SDSD RDF and SDBSA-SDBSD RDF), which demonstrated greater compact arrangement of SDBS molecules in Z-direction. SDBS molecules remained almost perpendicular to the SWCNT lateral surface, and SDS chains created acute angles with the SWCNT symmetry axis. However, SDBS molecules remained evenly distributed around the SWCNT cross-section (XY plane), whereas SDS molecules formed bundles. The mass density profile of SDS along Y-axis showed the asymmetric distribution of SDS molecules in contrast to the mass density profile of SDBS molecules along Y-axis (Fig. 3c, purple lines). Compared to the aggregation of SDBS molecules along Z-axis, the bundling of SDS molecules in the XY plane left smaller areas of the SWCNT surface available to surfactants (Fig. S15, ESI†).
Hence, it should be possible to obtain higher SDBS coverage of the SWCNT lateral surface than SDS. These findings were in agreement with the sorting results described above, which showed that SDBS had greater effectiveness as a SWCNT partitioning modulator. The calculations indicated that SDBS promoted the enhanced encapsulation of SWCNTs, so it could more easily cloak their hydrophobic nature, thereby promoting migration between the phases.
2.3. Insights into the separation mechanism
It is well-known that the ATPE system is formed because of differences between the densities of the phases. Thus, it is reasonable to assume that the density factor should play a role in separating SWCNTs using this method. Nair et al. demonstrated that the number of surfactant molecules adsorbed on the SWCNT affected the density of the surfactant–SWCNT complex. It was reported that the observed density change could be exploited for the differentiation of SWCNTs by ultracentrifugation.28 When an unsorted SWCNT mixture is combined with a particular surfactant, surfactant–SWCNT complexes have different buoyant densities depending on the chirality. This difference subsequently enables their partitioning using isopycnic centrifugation, wherein particles drift towards the regions of similar densities.
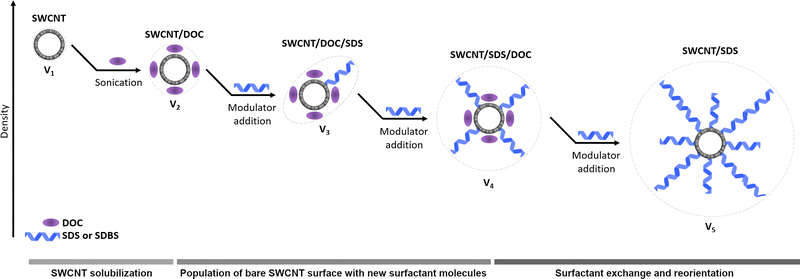
As the surfactant concentration in the ATPE system increased to promote partitioning, every type of SWCNT adsorbed the added SDS or SDBS molecules differently. Thus, the total coverage of SDS/SDBS around SWCNTs depended on the tube type. As the number of surfactant molecules adsorbed on each CNT changed with the increasing SDS/SDBS amount, the effective nanotube–surfactant complex density also varied, leading to an enhanced SWCNT movement between the phases. Minh D. Vo et al. described that large-diameter SWCNTs adsorb larger amounts of the SDS surfactant compared to small-diameter SWCNTs as they provided substantially more surface areas for surfactant coverage.29 In our case, the modeling revealed that the volume of the surfactant–SWCNT complex was amplified with the increasing surfactant concentration. Therefore, the overall density of these complexes decreased at high surfactant concentrations.30,31 According to our results, due to the top phase possessing lower density than the bottom phase, reduction of the surfactant–SWCNT complex's density occurred with the increased surfactant content which should favor the migration of SWCNTs to the top phase. Therefore, SDS and SDBS were preferentially adsorbed on larger diameter SWCNTs, resulting in their prioritized migration to the lower density PL-35-rich top phase, leaving small diameter tubes in the dextran-rich bottom phase. Further addition of the surfactant eventually covered the small diameter SWCNTs to a similar extent, thereby decreasing their density and shifting them to the top phase.
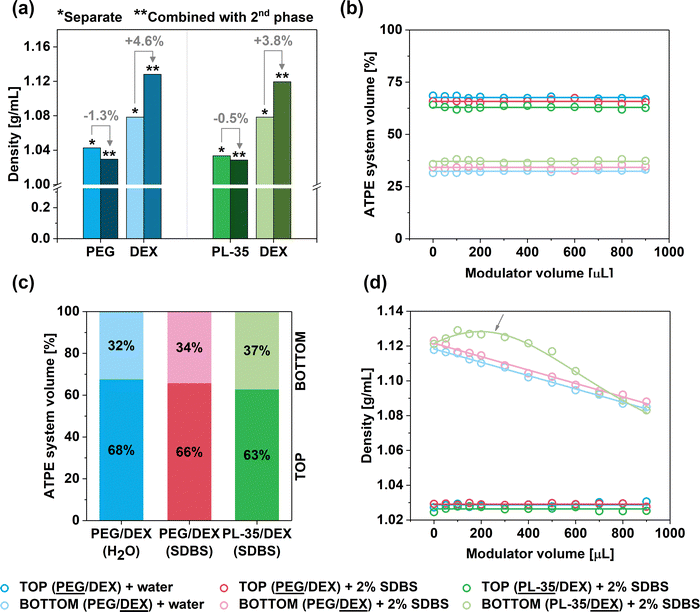
 ; Fig. 5b) was calculated as a function of the added volume of the surfactant.
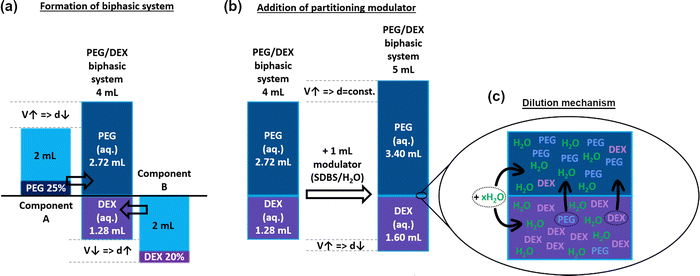
The volume of the top phase was roughly twice that of the bottom phase (ca. 68% vs. 32% for the PEG/DEX system, Fig. 5, 6a, Fig. S2); hence, our hypothesis was confirmed. Interestingly, the VT/VT+B ratio was changed slightly when the ATPE system was diluted with SDBS(aq.) or changed to PL-35/DEX (Fig. 5c). In such a case, the VT/VT+B ratio was decreased to 66% and 63%, respectively. This effect was explained due to the presence of surfactants and the selection of different top phase forming components affecting the shape of the binodal curve, so the volume ratio of the phases was modified.
Subsequently, an investigation was conducted to analyze the behaviors of the ATPE system upon the addition of water or aqueous solution of SDBS (2%). Firstly, it was observed that the values of VT/VT+B ratios appeared to remain independent of this factor (Fig. 5b). The ratios only slightly fluctuated, which was caused by experimental uncertainty, as the accurate determination of the volume values on this measurement scale is challenging. Thus, the addition of water or the surfactant solution proportionally increased the volume of both phases (Fig. 6b). However, this occurrence was significant in conjunction with the influence of the modulator towards the density of the phases (Fig. 5d). Although the density of the top phases (PEG and PL-35) remained constant during the addition of water or SDBS(aq.), a considerable reduction of the DEX bottom phase was observed. This phenomenon occurred regardless of differentiation modulator type employed. It was hypothesized that the addition of water (or water with surfactant) influenced the composition of both phases by causing redistribution of the solutes. The inclusion of partition modulators promoted a shift of DEX and PEG/PL-35 (the top-phase component was always present to a small extent in the bottom phase and vice versa) molecules to the top phase (Fig. 6c) to preserve their concentration after dilution. Thus, the biphasic system exhibited a dynamic equilibrium, which was affected by the water concentration. Consequently, the top phase acted like a buffer, which preserved its nature across the explored hydration range. However, it should not be ruled out that a decrease in density of the top phase did not occur to a small extent, but the effect was simply insignificant and could not be measured.
The influence of water concentration on the density of the biphasic system components revealed a unique behavior in the case of the PL-35/DEX separation medium. This is highlighted by the arrow in Fig. 5d. In this separation environment, the observed relationship was non-monotonic, and the density of the bottom phase initially increased after the addition of the modulator up to ca. 200 μL, and then decreased. We previously observed that (6,4) SWCNTs emerged in the top phase with low SDS/SDBS contents in the PL-35/DEX system (Fig. 1 and Fig. S10, S11a, ESI†), and then its absorption signature disappeared. Based on the report from Ghosh et al.,32 small-diameter SWCNTs, such as (6,4), dispersed with bile salt surfactants have the lowest density among the whole SWCNT population in the (6,5)-enriched CoMoCAT material (sorted by us in this study). Consequently, the initial increase in the density of the bottom phase may preferentially push these low-density (6,4) SWCNTs to the lower density top phase. However, a further increase in the modulator content decreased the density of the top phase, thereby enabling the emergence of other SWCNT types.
3. Conclusions
Herein, we investigated a novel Pluronic-based surfactant–polymer ATPE system for diameter-based sorting of SWCNTs. The absorption spectroscopy results showed that SDS and SDBS were effective partitioning modulators owing to their ability to promote the selective SWCNT migration from the bottom to the top phase. Moreover, the addition of such modulators at different concentrations revealed variations between the partitioning power of commonly employed SDS and SDBS. SDBS molecules were arranged on the SWCNT surface in a more coordinated manner compared to SDS, resulting in enhanced encapsulation. Consequently, SWCNT extraction with SDBS was possible at lower surfactant concentrations.Furthermore, based on the obtained results, we conducted a mechanistic study of SWCNT movement in biphasic systems. Firstly, SWCNT differentiation appeared to be driven by differences in density between complexes of surfactants and SWCNTs of varying diameters. As the surfactant concentration increased, the density of surfactant–SWCNT hybrids decreased, which shifted them to the lower-density top phase. Large-diameter SWCNTs accommodated the most surfactant molecules, so they were preferentially pushed to the top phase. Secondly, analysis of the density and relative volume of both phases as a function of partitioning modulator amount revealed striking differences between the nature of the top and bottom phases. It was found that the density of the top phase remained constant, whereas that of the bottom phase decreased substantially. These results strongly suggested that the addition of aqueous partitioning modulators allowed PL-35/PEG phases to exhibit concentration equilibrium as constantly accommodated solutes from the DEX phase, which was conversely diluted. The greater understanding of the ATPE framework obtained from our results may facilitate further development of various SWCNT sorting strategies, thereby increasing the technology readiness level of this material. Additionally, due to high utility of ATPE for the purification of various nanomaterials, the reported findings may also expedite their purification.
Conflicts of interest
The authors have no conflicts of interest to declare.Acknowledgements
The authors would like to thank the National Science Centre, Poland (under the OPUS program, Grant agreement UMO-2019/33/B/ST5/00631).References
- H. Kataura, Y. Kumazawa, Y. Maniwa, I. Umezu, S. Suzuki, Y. Ohtsuka and Y. Achiba, Synth. Met., 1999, 103, 2555–2558 CrossRef CAS.
- B. Kumanek and D. Janas, J. Mater. Sci., 2019, 54, 7397–7427 CrossRef CAS.
- F. Yang, M. Wang, D. Zhang, J. Yang, M. Zheng and Y. Li, Chem. Rev., 2020, 120, 2693–2758 CrossRef CAS PubMed.
- D. Janas, Mater. Chem. Front., 2018, 2, 36–63 RSC.
- J. Liu, C. Wang, X. Tu, B. Liu, L. Chen, M. Zheng and C. Zhou, Nat. Commun., 2012, 3, 1199 CrossRef.
- H. Gui, J. K. Streit, J. A. Fagan, A. R. Hight Walker, C. Zhou and M. Zheng, Nano Lett., 2015, 15, 1642–1646 CrossRef CAS PubMed.
- S. Kim and W.-J. Kim, Gels, 2022, 8, 76 CrossRef CAS PubMed.
- S. Cambré and W. Wenseleers, Angew. Chem., Int. Ed., 2011, 50, 2764–2768 CrossRef.
- P. He, B. Meany, C. Wang, Y. Piao, H. Kwon, S. Deng and Y. Wang, Electrophoresis, 2017, 38, 1669–1677 CrossRef CAS PubMed.
- J. Ouyang, J. Ding, J. Lefebvre, Z. Li, C. Guo, A. J. Kell and P. R. L. Malenfant, ACS Nano, 2018, 12, 1910–1919 CrossRef CAS.
- J. A. Fagan, Nanoscale Adv., 2019, 1, 3307–3324 RSC.
- H. Li, G. Gordeev, O. Garrity, N. A. Peyyety, P. B. Selvasundaram, S. Dehm, R. Krupke, S. Cambré, W. Wenseleers, S. Reich, M. Zheng, J. A. Fagan and B. S. Flavel, ACS Nano, 2020, 14, 948–963 CrossRef CAS PubMed.
- B. Podlesny, T. Shiraki and D. Janas, Sci. Rep., 2020, 10, 9250 CrossRef CAS PubMed.
- M. Avramenko, J. Defillet, M. Á. L. Carrillo, M. Martinati, W. Wenseleers and S. Cambré, Nanoscale, 2022, 14, 15484–15497 RSC.
- G. Ao, J. K. Streit, J. A. Fagan and M. Zheng, J. Am. Chem. Soc., 2016, 138, 16677–16685 CrossRef CAS PubMed.
- J. A. Fagan, C. Y. Khripin, C. A. Silvera Batista, J. R. Simpson, E. H. Hároz, A. R. Hight Walker and M. Zheng, Adv. Mater., 2014, 26, 2800–2804 CrossRef CAS PubMed.
- J. Defillet, M. Avramenko, M. Martinati, M. Á. López Carrillo, D. Van der Elst, W. Wenseleers and S. Cambré, Carbon, 2022, 195, 349–363 CrossRef CAS.
- M. Lyu, B. Meany, J. Yang, Y. Li and M. Zheng, J. Am. Chem. Soc., 2019, 141, 20177–20186 CrossRef PubMed.
- J. A. Fagan, E. H. Hároz, R. Ihly, H. Gui, J. L. Blackburn, J. R. Simpson, S. Lam, A. R. Hight Walker, S. K. Doorn and M. Zheng, ACS Nano, 2015, 9, 5377–5390 CrossRef CAS PubMed.
- B. Podlesny, B. Olszewska, Z. Yaari, P. V. Jena, G. Ghahramani, R. Feiner, D. A. Heller and D. Janas, Sci. Rep., 2021, 11, 10618 CrossRef CAS PubMed.
- C. Y. Khripin, J. A. Fagan and M. Zheng, J. Am. Chem. Soc., 2013, 135, 6822–6825 CrossRef CAS PubMed.
- N. K. Subbaiyan, A. N. G. Parra-Vasquez, S. Cambré, M. A. S. Cordoba, S. E. Yalcin, C. E. Hamilton, N. H. Mack, J. L. Blackburn, S. K. Doorn and J. G. Duque, Nano Res., 2015, 8, 1755–1769 CrossRef CAS.
- N. R. Arutyunyan, D. V. Baklashev and E. D. Obraztsova, Eur. Phys. J. B, 2010, 75, 163–166 CrossRef CAS.
- G. Ciofani, V. Raffa, V. Pensabene, A. Menciassi and P. Dario, Fullerenes, Nanotubes, Carbon Nanostruct., 2009, 17, 11–25 CrossRef CAS.
- H. Kato, A. Nakamura and M. Horie, RSC Adv., 2013, 4, 2129–2136 RSC.
- N. Yeredla, T. Kojima, Y. Yang, S. Takayama and M. Kanapathipillai, Sci. Rep., 2016, 6, 27736 CrossRef CAS.
- H. Tani, A. Matsuda, T. Kamidate and H. Watanabe, Anal. Sci., 1997, 13, 925–929 CrossRef CAS.
- N. Nair, W.-J. Kim, R. D. Braatz and M. S. Strano, Langmuir, 2008, 24, 1790–1795 CrossRef CAS PubMed.
- M. D. Vo and D. V. Papavassiliou, Molecules, 2016, 21, 500 CrossRef.
- J. G. Duque, C. G. Densmore and S. K. Doorn, J. Am. Chem. Soc., 2010, 132, 16165–16175 CrossRef CAS.
- M. Benrraou, B. L. Bales and R. Zana, J. Phys. Chem. B, 2003, 107, 13432–13440 CrossRef CAS.
- S. Ghosh, S. M. Bachilo and R. B. Weisman, Nat. Nanotechnol., 2010, 5, 443–450 CrossRef CAS PubMed.
Footnote |
| † Electronic supplementary information (ESI) available. See DOI: https://doi.org/10.1039/d3nh00023k |
| This journal is © The Royal Society of Chemistry 2023 |

