 Open Access Article
Identifying the presence of magnetite in an ensemble of iron-oxide nanoparticles: a comparative neutron diffraction study between bulk and nanoscale
D.
González-Alonso†
 *a,
J. I.
Espeso
a,
H.
Gavilán
b,
L. J.
Zeng
c,
M. T.
Fernández-Díaz
d,
G.
Subías
 e,
I.
de Pedro
a,
J. Rodríguez
Fernández
a,
P.
Bender‡
a,
L. Fernández
Barquín
a and
C.
Johansson
f
aDepartment CITIMAC, Faculty of Science, University of Cantabria, 39005, Santander, Spain. E-mail: galonsod@unican.es
bInstituto de Ciencia de Materiales de Madrid, ICMM/CSIC, 28049, Madrid, Spain
cDepartment of Physics, Chalmers University of Technology, 41296, Göteborg, Sweden
dInstitut Laue-Langevin, 38042, Grenoble, France
eInstituto de Ciencia de Materiales de Aragón, Departamento de Física de la Materia Condensada, CSIC-Universidad de Zaragoza, 50009, Zaragoza, Spain
fRISE Research Institutes of Sweden, 411 33, Göteborg, Sweden
First published on 1st April 2021
Abstract
Scientific interest in iron-oxides and in particular magnetite has been renewed due to the broad scope of their fascinating properties, which are finding applications in electronics and biomedicine. Specifically, iron oxide nanoparticles (IONPs) are gathering attraction in biomedicine. Their cores are usually constituted by a mixture of maghemite and magnetite phases. In view of this, to fine-tune the properties of an ensemble of IONPs towards their applications, it is essential to enhance mass fabrication processes towards the production of monodisperse IONPs with controlled size, shape, and stoichiometry. We exploit the vacancy sensitivity of the Verwey transition to detect the presence of magnetite. Here we provide direct evidence for the Verwey transition in an ensemble of IONPs through neutron diffraction. This transition is observed as a variation in the Fe magnetic moment at octahedral sites and, in turn, gives rise to a change of the net magnetic moment. Finally, we show this variation as the microscopic ingredient driving the characteristic kink that hallmarks the Verwey transition in thermal variation of magnetization.
Introduction
Magnetite is an ancient magnetic material that is nowadays intensively studied due to its widespread applications in different fields, such as in oxide electronics,1 biomedicine,2 solid-state energy conversion devices,3 non-volatile resistive switching,4 and gate voltage induced phase transition,5 among others. Moreover, recent biomedical applications involve the use of iron oxide nanoparticles (IONPs), mainly as contrast agents,6 in hyperthermia treatments,2,7 and as magnetic carriers.8 Precisely, magnetite is the desirable iron-oxide phase to form nanoparticle cores due to its high saturation magnetization values.2,9,10 At room temperature, magnetite (Fe3O4) crystallizes in an inverse-spinel cubic structure, i.e., AB2O4, with a space group Fd![[3 with combining macron]](https://www.rsc.org/images/entities/char_0033_0304.gif) m and a lattice parameter a ≈ 8.39 Å.11 This is formally written as Fe3+A[Fe2+Fe3+]BO4, with two types of Fe-atoms. A-sites are occupied by tetrahedrally coordinated Fe3+ cations, whereas B-sites are occupied by both Fe2+ and Fe3+ cations.
m and a lattice parameter a ≈ 8.39 Å.11 This is formally written as Fe3+A[Fe2+Fe3+]BO4, with two types of Fe-atoms. A-sites are occupied by tetrahedrally coordinated Fe3+ cations, whereas B-sites are occupied by both Fe2+ and Fe3+ cations.
Pioneering studies noticed the existence of a low-temperature transition in magnetite by means of specific heat,12 magnetization,13 and electrical resistivity14 measurements. It was only after the influential study conducted in 1939 by Verwey15 that the transition was interpreted in detail from the observation of two concurrent effects in a polycrystalline magnetite sample. Briefly, upon cooling, an abrupt decrease in DC-conductivity of 2 orders of magnitude at around TV ≈ 117 K (metal–insulator transition MIT) was found. This was accompanied by a crystallographic symmetry reduction from its high-temperature (cubic) phase. The advent of high-resolution X-ray synchrotron instrumentation has allowed establishing the structural origin of the Verwey transition.16–18 In addition, the anisotropy increases19 because of the gradual change in the magnetic easy-axis from the low-temperature monoclinic phase [001] to the cubic [111] one.20–22 In this sense, a recent study confirms magnetic order fluctuations as the underlying origin of the Verwey transition.23 In contrast to X-ray diffraction that provides atomic structure information (e.g., lattice parameters, crystal structure, and atomic species), neutron diffraction additionally provides information on the magnetic structure (e.g., atomic magnetic moment). Combining both atomic and magnetic structural information, neutron diffraction is crucial in the understanding of magnetic crystalline materials.
In this study, we present a detailed investigation focused on the thermal evolution of the magnetic moment in an ensemble of IONPs, using polycrystalline magnetite for comparison. It should be kept in mind that nominal samples of magnetite might be affected by a certain quantity of maghemite (γ-Fe2O3). In this sense, the evaluation of the coexistence of magnetite and maghemite phases has recently been tackled, and it was demonstrated that the magnetite powder sample under investigation here presents 98(1)% magnetite purity.24 Finally, we reveal the Verwey transition by means of a kink in the thermal variation of the magnetic moment at the octahedral FeB-sites obtained by neutron powder diffraction (NPD) analysis.
Experimental
The polycrystalline magnetite Fe3O4 powder sample was provided by the Department of Physics at the Technical University of Denmark. The ensemble of IONPs was produced by an oxidative precipitation method reported in ref. 25 and 26 and subsequently coated with dextran via a high-pressure homogenization procedure. Eventually, the IONPs were magnetically fractionated to reduce size inhomogeneities.26 Transmission electron microscopy (TEM) and high-resolution transmission electron microscopy (HRTEM) were carried out on an FEI Tecnai G2 T20 (equipped with an LaB6 electron gun) and an FEI Titan 80-300, respectively. For subsequent characterization of the IONP ensemble, droplets of water-dispersed IONPs were placed on a carbon-coated copper grid. AC-susceptibility was assessed by using a Quantum Design MPMS-system at a frequency of 0.5 Hz with a field amplitude of μ0Hac ≈ 0.3 mT. NPD experiments were carried out using a liquid helium cryostat on a high-flux two-axis diffractometer D1B at the Institute Laue–Langevin (Grenoble, France).27 The sample was loaded into a cylindrical vanadium container and data were collected at selected temperatures between 5 and 300 K. Each diffraction pattern was measured with an acquisition time of 0.5 hours within the 2θ range ∼15–128° in steps of Δ2θ = 0.1° and with a wavelength of λ ≅ 2.52 Å. The Rietveld refinement analysis of neutron diffraction data was performed using the FULLPROF software28 with a Thompson–Cox–Hastings pseudo-Voigt profile function to describe the shape of the diffraction peaks. This method allows a simultaneous evaluation of the crystalline and magnetic structure through the variation of fitting parameters such as the lattice parameter, the scale factor, and the value of the magnetic moment, among others. The quality of the fit could be evaluated via the Bragg (RBragg) and magnetic Bragg (Rmag) factors, which are the two more reliable agreement-factors to ascertain a Rietveld analysis. Values below 20% are acceptable, especially for an ensemble of nanoparticles. The temperature dependence of the DC-magnetization M(T) was recorded at several magnetic fields μ0H = 1, 3 and 5 T in the temperature range 5 ≤ T ≤ 300 K using a Quantum Design PPMS magnetometer.Results and discussion
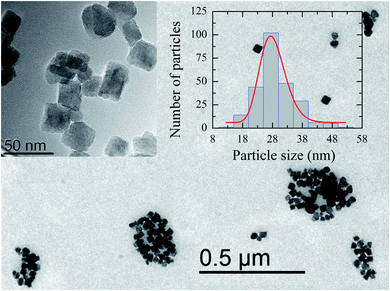
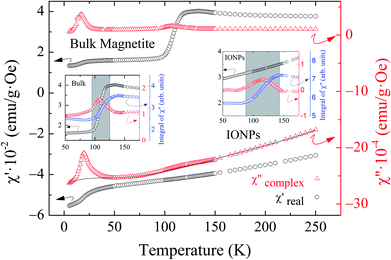
Fig. 1 shows a representative TEM image of the ensemble of IONPs in which nanoparticles are grouped, forming agglomerates of different sizes. The ensemble is constituted by nearly monodisperse single-cores of cuboid shape (see the upper left inset in Fig. 1). As observed in the log-normal size-distribution displayed in the upper right inset, the ensemble presents a number-weighted mean value of D = 28 nm and a standard deviation of 4 nm. TEM and XRD analyses of the cuboid-shaped IONPs agree in terms of the average particle size, as discussed elsewhere.29 According to Fock and Bogart et al.24 and with the aid of the room-temperature Mössbauer spectrum the amount of magnetite was estimated to be 28(10) wt.%, i.e., 72 wt.% of maghemite, which confirms the coexistence of magnetite and maghemite phases in the ensemble of IONPs.29Fig. 2 depicts the real χ′(T) and complex χ′′(T) contributions to the AC-susceptibility for bulk magnetite24 and the ensemble of IONPs. At low-temperatures (below 50 K), a kink in χ′(T) and a broad peak in χ′′(T) are observed for both samples. The origin of this low-temperature anomaly still remains unclear.30–32 It is worth noting that there is a clear jump in χ′(T) at around 120 K for bulk magnetite , whereas no sign of such magnetic behavior is observed for the IONPs.33 On the other hand, the χ′′(T) complex contribution to the AC-susceptibility (red empty triangles) reveals a clear peak for bulk magnetite, that is barely observed in the ensemble. To make this peak clearly visible, we have subtracted the black solid line appearing at the bottom of Fig. 2 (see the resulting peak in red in the right inset of Fig. 2). In the insets of Fig. 2, the integral of χ′′(T) has been represented by blue empty squares to highlight the magnetic correlations for both bulk magnetite and IONP samples. Furthermore, the Verwey transition is only characteristic of highly stoichiometric magnetite samples.34,35 In view of this, we take these broad peaks in both samples as an indicator of the magnetic correlations that are considered in the origin of the Verwey transition.23,33,36 Therefore, we can confirm that the cores of our ensemble of IONPs are constituted by a mixture of maghemite and magnetite phases.
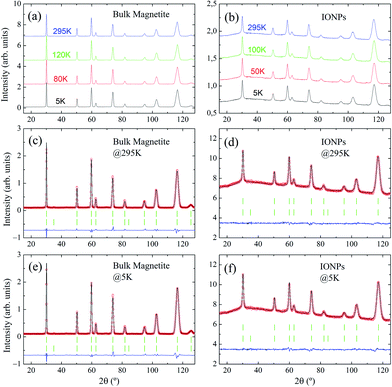
Representative NPD patterns collected at selected temperatures well below and above the expected Verwey transition temperature (TV ≈ 120 K33,34) are displayed in Fig. 3(a and b) for bulk magnetite and IONP samples, respectively. As expected, when we draw a comparison between NPD measurements of bulk magnetite and IONPs, a reduction in peak intensity is observed, together with peak broadening. This is a consequence of the nanoscale size of the IONP sample (ca. 28 nm). In addition, a small bump in the background of the IONP patterns in the 2θ-range 20° ≤ 2θ ≤ 110° is also evident. We surmise that this contribution to the background basically originates from the minor scattering of the coating.
Regarding the low-temperature Rietveld refinements displayed in Fig. 3(e and f), no evidence of satellite peaks stemming from the monoclinic C2/c space group was observed.17 Consequently, the resolution of the instrument D1B does not allow for the recognition of the monoclinic distortions through the Verwey transition. Therefore, to extract quantitative parameters, we are bound to propose a simplified approach in which the high-temperature cubic Fd![[3 with combining macron]](https://www.rsc.org/images/entities/char_0033_0304.gif) m will be maintained across the whole temperature range. Thus, in this approach the aim is to procure some parameters which may be connected to the Verwey transition and magnetite content. The cubic structure is valid for both maghemite and magnetite phases.37 Following this approach, every single peak of the set of NPD patterns taken at different temperatures is indexed (RB <4%) to the cubic Fd
m will be maintained across the whole temperature range. Thus, in this approach the aim is to procure some parameters which may be connected to the Verwey transition and magnetite content. The cubic structure is valid for both maghemite and magnetite phases.37 Following this approach, every single peak of the set of NPD patterns taken at different temperatures is indexed (RB <4%) to the cubic Fd![[3 with combining macron]](https://www.rsc.org/images/entities/char_0033_0304.gif) m space group (see Table 1 for crystallographic details). Moreover, an accurate match in the intensities of the peaks is obtained as exemplified by the small residual obtained in the Rietveld analysis (see Fig. 3(c–f)).
m space group (see Table 1 for crystallographic details). Moreover, an accurate match in the intensities of the peaks is obtained as exemplified by the small residual obtained in the Rietveld analysis (see Fig. 3(c–f)).
![[3 with combining macron]](https://www.rsc.org/images/entities/char_0033_0304.gif) m space group, together with a list of standard quality parameters, i.e., goodness of fit χ2 and agreement factors RP, RWP, RBragg, Rmag, obtained from the Rietveld analysis at selected temperatures and represented in Fig. 3. The oxygen coordinate parameter u is almost constant (ideally equal to 1/4 (ref. 11))
m space group, together with a list of standard quality parameters, i.e., goodness of fit χ2 and agreement factors RP, RWP, RBragg, Rmag, obtained from the Rietveld analysis at selected temperatures and represented in Fig. 3. The oxygen coordinate parameter u is almost constant (ideally equal to 1/4 (ref. 11))
| Atom | Wyckoff position | x | y | z |
|---|---|---|---|---|
| O | 32e | u | u | u |
| Fe oct | 16d | 1/2 | 1/2 | 1/2 |
| Fe tet | 8a | 1/8 | 1/8 | 1/8 |
| Parameters | Bulk magnetite | IONPs | ||
|---|---|---|---|---|
| 5 K | 295 K | 5 K | 295 K | |
| R p (%) | 3.74 | 3.39 | 14.6 | 13.4 |
| R wp (%) | 5.06 | 4.77 | 8.48 | 7.77 |
| R Bragg (%) | 2.29 | 2.63 | 2.52 | 3.23 |
| R mag (%) | 4.56 | 4.33 | 10.0 | 5.26 |
| χ 2 | 55.6 | 45.1 | 3.55 | 2.89 |
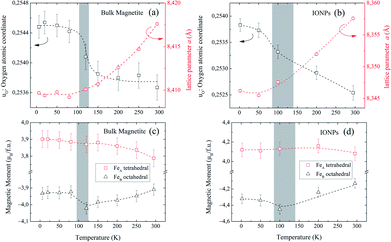
Fig. 4(a and b) show the relevant structural changes that occur during the Verwey transition (shaded region), which were obtained in the refinement of bulk magnetite and IONP samples, respectively. For both samples (see Fig. 4(a and b)), the lattice parameters and consequently the volume of the unit cell experience a monotonous increase as the temperature rises above the transition. In contrast, they remain roughly constant below the Verwey transition temperature. The variation in the temperature evolution of the a lattice parameter is accompanied by the change in the oxygen coordinate u (see Fig. 4(a and b)). This shrinkage of u across the transition relates to the structural change. Precisely, this marks a first-order phase transition from the low-temperature phase to the high-temperature cubic phase in magnetite38,39 (see Fig. 4). The refined values of u agree with those reported in the literature,40,41 despite being slightly larger than those in the case of cubic closest-packing, u = 0.25.41 In fact, the oxygen-coordinate u is closely related to the Fei-O bond-lengths as shown in the following expressions:42
| dFeB–O = a(1/2 − u) | (1) |
 | (2) |
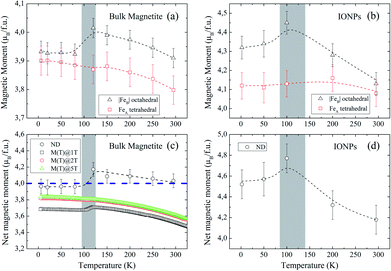
Magnetic Rietveld refinements were performed using a ferrimagnetic structure for all temperatures (see Fig. 3(c–f) and the agreement factors compiled in Table 1). The thermal evolution of the magnetic moments obtained from neutron diffraction is depicted in Fig. 4(c and d). Interestingly, a small kink at the octahedral sites for both samples is observed in the vicinity of the Verwey transition. We surmise that this feature is related to the kink depicted by bulk magnetite in the real contribution to the AC-susceptibility but does not appear for IONPs (see Fig. 2). In addition, it is reasonable to expect that the trivalent Fe (A- and B-) sites are mutually compensated, which in turn suggests that FeB2+ cations at octahedral-sites are the ones contributing to the net magnetization value, therefore, corroborating the ferrimagnetic coupling between A and B sublattices, while Fe-sites of the same sublattice (A or B) are ferromagnetically coupled. It is worth reminding here that tetrahedral moments halve the multiplicity of B-sites (see Table 1). Such ferrimagnetic behavior is depicted in more detail in Fig. 5(a and b) through the inspection of the thermal evolution of the Fe magnetic moments. A general trend of the values for both A- and B-sites to decrease with increasing temperature towards TC (TC ≈ 850 K for bulk magnetite24) is noticed. Although the magnitudes of the Fe moments are rather similar for both sites, Fig. 5(a and b), they reveal a clear change at the octahedral sites for both samples. Thus, our Rietveld refinements provide clear evidence for the change in magnetic moments exhibited at the octahedral sites in our samples across the Verwey transition. Specifically, this positive variation in the octahedral moment of 0.09(5) μB/f.u. appearing in the bulk magnetite sample agrees well with that reported by magnetic circular dichroism studies of Fe2+ thin films.43,44 Furthermore, though no trace of the Verwey transition is ascertained through χ′(T) or M(T) for the IONP sample, neutron diffraction reveals the local magnetic order at the Fe octahedral sites. We suggest that this masked Verwey transition is due to the texture effects of the IONPs.
According to Hund's rules, magnetite has a spin moment per formula unit (f.u.) of 4.0 μB, where the ground state of Fe3+ cations (3d5, 6S5/2) corresponds to μFe3+ = μBgSS = 5 μB (with gS = 2 and S = 5/2), and for Fe2+ (3d6, 5D4), it is μFe2+ = μBgSS = 4 μB (gS = 2 and S = 2). To complete our analysis, we performed a quantitative reconstruction of the net magnetic moment (per f.u.) by using the refined magnetic moments as described in the following formula:
| μnet = 2μFeBOccFeB−μFeAOccFeA | (3) |
Conclusions
In this work, we have demonstrated that the cores of our ensemble of IONPs comprise maghemite and magnetite phases. TEM measurements show that the IONPs are ca. 28 nm in average particle size. A detailed investigation has been performed to trace the masked Verwey transition in the IONP sample, using a bulk magnetite sample for comparison. No indication of the Verwey transition was observed in the real contribution to the AC-susceptibility for the IONP sample, whereas a small broad peak is perceived as an indicator of the transition at ca. 120 K in the complex contribution. Neutron diffraction experiments show structural and magnetic changes across the transition. Specifically, the variation of the magnetic moment at the Fe octahedral sites hallmarks the Verwey transition. This microscopic feature matches the kink in both macroscopic χ′(T) and reconstructed net M(T) for bulk magnetite. Though the local magnetic order is revealed by neutron diffraction, we suggest that the lack of any magnetic trace in χ′(T) and M(T) is due to texture effects in the IONP sample. We can conclude that our approach has identified key crystallographic parameters to monitor the Verwey transition (e.g., oxygen coordinate parameter u and magnetic moment FeB) that can be used as order parameters to trace the transition. The procedure put forward here may open new routes to fine-tune their applications by enhancing the stoichiometry of the ensemble of IONPs.Author contributions
Conceptualization, D. G.-A.; methodology, L. F. B. and D. G.-A.; formal analysis, J. I. E. and D. G.-A.; investigation, H. G., L. Z., M. T. F. D., I. d. P., J. R. F., P. B. and D. G.-A.; resources, L. F. B. and C. J.; writing–original draft preparation, D. G.-A.; writing–review and editing, J. I. E., G. S., I. d. P., J. R. F., P. B., L. F. B. and D. G.-A. All the authors have read and agreed to the published version of the manuscript.Conflicts of interest
There are no conflicts to declare.Acknowledgements
This work has received funding from EU FP7 604448 (NanoMag) and MAT2017-83631-C3-R. The Institute Laue-Langevin is acknowledged for provision of beamtime on the D1B instrument. We thank Dr Oscar Fabelo for his initial guidance in the Rietveld analysis. Dr Lorena González-Legarreta is acknowledged for her critical review and support during the preparation of this manuscript.References
- S. de Jong, R. Kukreja, C. Trabant, N. Pontius, C. F. Chang, T. Kachel, M. Beye, F. Sorgenfrei, C. H. Back, B. Bräuer, W. F. Schlotter, J. J. Turner, O. Krupin, M. Doehler, D. Zhu, M. A. Hossain, A. O. Scherz, D. Fausti, F. Novelli, M. Esposito, W. S. Lee, Y. D. Chuang, D. H. Lu, R. G. Moore, M. Yi, M. Trigo, P. Kirchmann, L. Pathey, M. S. Golden, M. Buchholz, P. Metcalf, F. Parmigiani, W. Wurth, A. Föhlisch, C. Schüßler-Langeheine and H. A. Dürr, Nat. Mater., 2013, 12, 882 CrossRef CAS PubMed.
- B. Pelaz, C. Alexiou, R. A. Alvarez-Puebla, F. Alves, A. M. Andrews, S. Ashraf, L. P. Balogh, L. Ballerini, A. Bestetti, C. Brendel, S. Bosi, M. Carril, W. C. W. Chan, C. Chen, X. Chen, X. Chen, Z. Cheng, D. Cui, J. Du, C. Dullin, A. Escudero, N. Feliu, M. Gao, M. George, Y. Gogotsi, A. Grünweller, Z. Gu, N. J. Halas, N. Hampp, R. K. Hartmann, M. C. Hersam, P. Hunziker, J. Jian, X. Jiang, P. Jungebluth, P. Kadhiresan, K. Kataoka, A. Khademhosseini, J. Kopeček, N. A. Kotov, H. F. Krug, D. S. Lee, C.-M. Lehr, K. W. Leong, X.-J. Liang, M. L. Lim, L. M. Liz-Marzán, X. Ma, P. Macchiarini, H. Meng, H. Möhwald, P. Mulvaney, A. E. Nel, S. Nie, P. Nordlander, T. Okano, J. Oliveira, T. H. Park, R. M. Penner, M. Prato, V. Puntes, V. M. Rotello, A. Samarakoon, R. E. Schaak, Y. Shen, S. Sjöqvist, A. G. Skirtach, M. G. Soliman, M. M. Stevens, H.-W. Sung, B. Z. Tang, R. Tietze, B. N. Udugama, J. S. VanEpps, T. Weil, P. S. Weiss, I. Willner, Y. Wu, L. Yang, Z. Yue, Q. Zhang, Q. Zhang, X.-E. Zhang, Y. Zhao, X. Zhou and W. J. Parak, ACS Nano, 2017, 11, 2313 CrossRef CAS PubMed.
- R. Ramos, T. Kikkawa, K. Uchida, H. Adachi, I. Lucas, M. H. Aguirre, P. Algarabel, L. Morellón, S. Maekawa, E. Saitoh and M. R. Ibarra, Appl. Phys. Lett., 2013, 102, 072413 CrossRef.
- M. Liu, J. Hoffman, J. Wang, J. Zhang, B. Nelson-Cheeseman and A. Bhattacharya, Sci. Rep., 2013, 3, 1876 CrossRef PubMed.
- J. Gooth, R. Zierold, J. G. Gluschke, T. Boehnert, S. Edinger, S. Barth and K. Nielsch, Appl. Phys. Lett., 2013, 102, 073112 CrossRef.
- J. Pellico, J. Ruiz-Cabello, I. Fernandez-Barahona, L. Gutierrez, A. V. Lechuga-Vieco, J. A. Enríquez, M. Puerto Morales and F. Herranz, Langmuir, 2017, 33, 10239 CrossRef CAS PubMed.
- W. Wu, Z. Wu, T. Yu, C. Jiang and W.-S. Kim, Sci. Technol. Adv. Mater., 2015, 16, 023501 CrossRef PubMed.
- S. Carregal-Romero, P. Guardia, X. Yu, R. Hartmann, T. Pellegrino and W. J. Parak, Nanoscale, 2015, 7, 570 RSC.
- Q. A. Pankhurst, J. Connolly, S. K. Jones and J. Dobson, J. Phys. D: Appl. Phys., 2003, 36, R167 CrossRef CAS.
- F. Ludwig, O. Kazakova, L. Fernández Barquín, A. Fornara, L. Trahms, U. Steinhoff, P. Svedlindh, E. Wetterskog, Q. A. Pankhurst, P. Southern, M. Puerto Morales, M. F. Hansen, C. Frandsen, E. Olsson, S. Gustafsson, N. Gehrke, K. Lüdtke-Buzug, C. Grüttner, C. Jonasson and C. Johansson, IEEE Trans. Magn., 2014, 50, 5300204 Search PubMed.
- M. Iizumi, T. F. Koetzle, G. Shirane, S. Chikazumi, M. Matsui and S. Todo, Acta Crystallogr., Sect. B: Struct. Crystallogr. Cryst. Chem., 1982, 38, 2121 CrossRef.
- R. W. Millar, J. Am. Chem. Soc., 1929, 51, 215 CrossRef CAS.
- P. Weiss and R. Forrer, Ann. Phys., 1929, 12, 279 CAS.
- T. Okamura, Sci. Rep. Tohoku Imp. Univ., 1932, 21, 231 CAS.
- E. J. Verwey, Nature, 1939, 144, 327 CrossRef CAS.
- J. P. Wright, J. P. Attflied and P. G. Radaelli, Phys. Rev. Lett., 2001, 87, 266401 CrossRef CAS PubMed.
- J. Blasco, J. García and G. Subías, Phys. Rev. B, 2011, 83, 104105 CrossRef.
- M. S. Senn, J. P. Wright and J. P. Attfield, Nature, 2012, 481, 173 CrossRef CAS PubMed.
- R. Reznicek, V. Chlan, H. Stepankova, P. Novak and M. Marysko, J. Phys.: Condens. Matter, 2012, 24, 055501 CrossRef CAS PubMed.
- J. García, G. Subías, J. Herrero-Martín, J. Blasco, V. Cuartero, M. Concepción Sánchez, C. Mazzoli and F. Yakhou, Phys. Rev. Lett., 2009, 102, 176405 CrossRef PubMed.
- E. Lima Jr, A. L. Brandl, A. D. Arelaro and G. F. Goya, J. Appl. Phys., 2006, 99, 083908 CrossRef.
- R. Aragón, Phys. Rev. B, 1992, 46, 5334 CrossRef PubMed.
- G. Perversi, E. Pachoud, J. Cumby, J. M. Hudspeth, J. P. Wright, S. A. J. Kimber and J. P. Attfield, Nat. Commun., 2019, 10, 2857 CrossRef PubMed.
- J. Fock, L. K. Bogart, D. González-Alonso, J. I. Espeso, M. F. Hansen, M. Varón, C. Frandsen and Q. A. Pankhurst, J. Phys. D: Appl. Phys., 2017, 50, 265005 CrossRef.
- M. Andrés Vergés, R. Costo, A. G. Roca, J. F. Marco, G. F. Goya, C. J. Serna and M. P. Morales, J. Phys. D: Appl. Phys., 2008, 41, 134003 CrossRef.
- C. Grüttner, K. Müller, J. Teller, F. Westphal, A. Foreman and R. Ivkov, J. Magn. Magn. Mater., 2007, 311, 181 CrossRef.
- D. Alba Venero, P. Bender, J. I. Espeso, L. Fernández Barquín, M. T. Fernández Díaz, D. González-Alonso and Q. A. Pankhurst, Defining key structural and magnetic parameters for standardising magnetic Fe-oxide nanoparticles for biomedical applications, Institut Laue-Langevin (ILL), Grenoble, France, 2015 Search PubMed.
- J. Rodríguez-Carvajal, Newsletter in Commission on Powder Diffraction (IUCr), 2001, 26, 12 Search PubMed.
- D. González-Alonso, J. González, H. Gavilán, J. Fock, L. Zeng, K. Witte, P. Bender, L. Fernández Barquín and C. Johansson, RSC Adv., 2021, 11, 390 RSC.
- Z. Svindrych, Z. Janu, A. Kozlowski and J. M. Honig, Phys. Rev. B, 2012, 86, 214406 CrossRef.
- M. Alexe, M. Ziese, D. Hesse, P. Esquinazi, K. Yamauchi, T. Fukushima, S. Picozzi and U. Gösele, Adv. Mater., 2009, 21, 4452 CrossRef CAS.
- S. F. Alvarado, W. Eib, F. Meier, D. T. Pierce, K. Sattler, H. C. Siegmann and J. P. Remeika, Phys. Rev. Lett., 1975, 34, 319 CrossRef CAS.
- F. J. Walz, J. Phys.: Condens. Matter, 2002, 14, R285 CrossRef CAS.
- J. M. Honig, J. Alloys Compd., 1995, 229, 24 CrossRef CAS.
- J. B. Yang, X. D. Zhou, W. Yelon, W. J. James, Q. Cai, K. Gopalakrishnan, S. K. Malik, X. C. Sun and D. E. Nikles, J. Appl. Phys., 2004, 95, 7540 CrossRef CAS.
- L. V. Gasparov, A. Rush, G. Güntherodt and H. Berger, Phys. Rev. B, 2009, 79, 144303 CrossRef.
- C. Pecharromán, T. González-Carreño and J. E. Iglesias, Phys. Chem. Miner., 1995, 22, 21 CrossRef.
- G. K. Rozenberg, M. P. Pasternak, W. M. Xu, Y. Amiel, M. Hanfland, M. Amboage, R. D. Taylor and R. Jeanloz, Phys. Rev. Lett., 2006, 96, 045705 CrossRef PubMed.
- M. E. Fleet, Acta Crystallogr., Sect. B: Struct. Crystallogr. Cryst. Chem., 1981, 37, 917 CrossRef.
- W. C. Hamilton, Phys. Rev., 1958, 110, 1050 CrossRef CAS.
- H. Okudera, K. Kihara and T. Matsumoto, Acta Crystallogr., Sect. B: Struct. Sci., 1996, 52, 450 CrossRef.
- S. Klotz, G. Steinle-Neumann, T. Strässle, J. Philippe, T. Hansen and M. J. Wenzel, Phys. Rev. B, 2008, 77, 012411 CrossRef.
- D. J. Huang, C. F. Chang, H.-T. Jeng, G. Y. Guo, H.-J. Lin, W. B. Wu, H. C. Ku, A. Fujimori, Y. Takahashi and C. T. Chen, Phys. Rev. Lett., 2004, 93, 077204 CrossRef CAS PubMed.
- C. T. Chen, Y. U. Idzerda, H.-J. Lin, N. V. Smith, G. Meigs, E. Chaban, G. H. Ho, E. Pellegrin and F. Sette, Phys. Rev. Lett., 1995, 75, 152 CrossRef CAS PubMed.
- J. H. van Vleck, The Theory of Electric and Magnetic Susceptibilities. London, Oxford University Press, 1966 Search PubMed.
Footnotes |
| † Present address: Department of Physics, Campus de Viesques, University of Oviedo, 33203, Gijón, Spain. |
| ‡ Present address: Heinz Maier-Leibnitz Zentrum (MLZ), Technische Universität München, D-85748, Garching, Germany. |
| This journal is © The Royal Society of Chemistry 2021 |

