 Open Access Article
Size controlled green synthesis of gold nanoparticles using Coffea arabica seed extract and their catalytic performance in 4-nitrophenol reduction†
N. K. R. Bogireddya,
U. Pal b,
L. Martinez Gomezc and
V. Agarwal
 *a
*a
aCentro de Investigacion en Ingenieria y Ciencias Aplicadas, UAEM, Av. Univ. 1001, Col. Chamilpa, Cuernavaca, Morelos 62209, México. E-mail: vagarwal@uaem.mx
bInstituto de Física, Benemérita Universidad Autónoma de Puebla, Apdo. Postal J-48, Puebla Pue, 72570, Mexico
cUniversidad Nacional Autonoma de Mexico, Instituto de Ciencias Fisicas, Avenida Universidad s/n, Cuernavaca, MOR, 62210 Mexico
First published on 11th July 2018
Abstract
Well crystalline gold nanoparticles (AuNPs) of different sizes were fabricated using sundried Coffea arabica seed (CAS) extract at room temperature by controlling the pH of the green extract. The size, shape and crystallinity of the nanoparticles have been studied using electron microscopy and X-ray diffraction. The presence of phenolic groups (revealed through FT-IR studies) from the CAS extract are responsible both for the reduction of Au ions and stabilization of the formed AuNPs. The efficiency of the CAS extract mediated green synthesis technique for the production of AuNPs has been compared to the conventional chemical Turkevich technique, which not only uses a toxic reductant such as NaBH4, but also operates around the boiling point of water. It has been observed that the CAS extract mediated synthesis process produces relatively bigger AuNPs at similar pH values of the reaction mixture in comparison to the AuNPs produced in the Turkevich process. Although the AuNPs synthesized using CAS extract are relatively larger and polydisperse in nature, their catalytic efficiencies for the degradation of an aromatic nitro compound (4-nitrophenol) are found to be comparable to the chemically fabricated AuNPs. Probable mechanisms associated with the formation of AuNPs and their size control in the CAS extract mediated green synthesis process have been discussed.
1. Introduction
With the advancement of nanotechnology, noble metal nanostructures have received great attention in recent times due to their promising contribution in the fields of plasmonics, catalysis, photocatalysis and renewable energy.1–5 Consequently, the technology or methods of their fabrication have been refined to produce shape, size and geometry-controlled nanostructures to accommodate different applications. While the application of noble metal nanostructures in plasmonic devices has been well established, the performance of noble metals supported over semiconductors and dielectric matrices has been exploited successfully in catalytic and photocatalytic reactions,3,6,7 alongside other optoelectronic applications.8 However, the use of bare noble metal nanostructures in catalysis or photocatalysis has been limited.9,10 While the most promising utilizations of bare noble metal nanostructures have been the bio-sensing based on surface enhanced Raman scattering (SERS) or electrochemical response11,12 and bioremediation,13 they have also been utilized, although not so frequent, for catalytic degradation/reduction of organic pollutants.14,15 Utilization of noble metal nanoparticles (NPs) in optical sensing devices, and often in photocatalytic reactions is based on their typical plasmonic characteristics which is defined by the nature (position) and strength (intensity) of localized surface plasmon resonances (SPRs). On the other hand, utilization of noble metal NPs in catalysis (chemical and electrochemical) is based on the electronic charge distribution at their surfaces. In fact, both the above-mentioned characteristics of noble metal NPs depend on their size, shape and composition. Therefore, fabricating size, shape and composition controlled noble metal NPs is of great technological interest.Several physical and chemical methods have been developed, and some of them have been refined recently for the controlled fabrication of noble metal nanostructures.16 However, most of the chemical methods use expensive or toxic reagents and solvent,17–19 apart from the use of organic polymer surfactants. In chemical synthesis processes, almost all the synthesis parameters affect the shape and size of metal NPs. While some of them have been correlated with reasonable certainty, the exact mechanisms involved in the size tunability of noble metal NPs are still uncertain.20 Utilizing the seeded growth approach, Murphy group21 prepared monodispersed gold nanoparticles (AuNPs) in the 5–40 nm size range. Fabrication of monodispersed quasi-spherical AuNPs of different sizes up to ∼200 nm diameter has been demonstrated by Bastús et al.22 through citrate-reduction technique following a kinetically controlled seeded growth strategy. The typical synthesis process involves the preparation of small Au clusters or seeds and their successive growth in different reaction conditions, which depends on the nature of the solvent containing Au salt, nature of the reductor and the stabilizing agent. Among the conventional methods utilized for the synthesis of AuNPs, Turkevich method,23 a chemical method which uses sodium borohydride (NaBH4) both as reducing and stabilizing agent and water as solvent, is the most popular. On the other hand, noble metal NPs have also been synthesized using biological extracts.24–26 While most of the biosynthesis techniques are lagging behind the popular chemical reduction techniques on controlling size and size dispersion of metal NPs, they are ambientally benign, cost effective, and scalable.
Apart from size, shape and size dispersion, another factor which defines the utility of noble metal NPs is their surface characteristics. In fact, the metal NPs fabricated by different synthetic techniques bear different surface characteristics, which also define their application potentials, particularly in room temperature catalytic processes.
In this report we present the fabrication of size tuned gold NPs through the reduction of gold precursor by CAS (Coffea arabica seed) extract by controlling the pH of the reaction mixture. Fabricated NPs were characterized by UV-vis absorption spectroscopy, scanning electron microscopy and transmission electron microscopy. The catalytic activity of the fabricated Au NPs for the reduction/degradation of 4-nitrophenol (4-NP), a toxic by-product of synthetic dyes, herbicides and pesticides27 to 4-aminophenol (4-AP) has been studied. The catalytic activity of these bio-synthesized gold NPs has been compared with the catalytic activity of gold NPs of similar dimensions fabricated by Turkevich method. A probable mechanism of 4-NP reduction by the fabricated gold NPs is provided.
2. Materials and methods
2.1 Materials
Chloroauric acid (HAuCl4·3H2O, Sigma Aldrich, 99.9%), sodium citrate (Na3C6H5O7, Sigma Aldrich, 99.0%), 4-nitrophenol (4-NP, Sigma Aldrich, 99.5%), sodium borohydride (NaBH4, Sigma Aldrich, 98%), and buffer solutions (Sigma Aldrich) utilized in this work were of analytical grade. Dried Coffea arabica seeds (CAS) were collected from the local market of Cuernavaca city, Morelos state, Mexico. Double distilled water was utilized throughout the synthesis process.2.2 Preparation of extract
CA seeds, collected from the local market, grinded to fine powder, and stored in ambient conditions. For the preparation of CAS extract, 100 mg of its finely grinded powder was taken in a beaker containing 200 mL of distilled water and kept in temperature-controlled heating mantle at 85 °C for 25 min. Then the extract was filtered using a 0.22 μm cellulose nitrate filter paper. The natural pH of the obtained CAS extract was measured to be ∼6.3.2.3 Preparation of green AuNPs at different pH (GAuNPs)
A certain volume of gold ion solution (HAuCl4·3H2O; 10 mM) was added to freshly prepared and pH-maintained CAS extract in 1![[thin space (1/6-em)]](https://www.rsc.org/images/entities/char_2009.gif) :
:![[thin space (1/6-em)]](https://www.rsc.org/images/entities/char_2009.gif) 5 volumetric ratio and kept under magnetic agitation for about 60 min. Gradual reduction of Au ions and the formation of AuNPs could be perceived visually though gradual color change of the reaction mixture, which turned from light yellow to deep violet. Formation of AuNPs was further confirmed by UV-vis spectrophotometry. For the fabrication of Au nanoparticles of different sizes, the same procedure was repeated, only by varying the pH of the CAS extract by adding buffer solutions of different pH values.
5 volumetric ratio and kept under magnetic agitation for about 60 min. Gradual reduction of Au ions and the formation of AuNPs could be perceived visually though gradual color change of the reaction mixture, which turned from light yellow to deep violet. Formation of AuNPs was further confirmed by UV-vis spectrophotometry. For the fabrication of Au nanoparticles of different sizes, the same procedure was repeated, only by varying the pH of the CAS extract by adding buffer solutions of different pH values.
2.4 Preparation of chemical AuNPs (CAuNPs) at different pH
Sodium citrate reduction technique proposed by Turkevich23 was utilized to fabricate Au nanoparticles chemically. In brief, an aqueous gold ion solution was prepared by dissolving 19.725 mg of HAuCl4·3H2O in 50 mL double distilled water. The solution was heated up to its boiling temperature (around 97 °C) in a round bottom flask. Once the solution starts boiling, the container was taken out of the heating mantle and a sodium citrate solution (57.0 mg dispersed into 5.0 mL of water) was rapidly added to it under magnetic agitation. Within about 15 min, the color of the solution changed from light yellow to violet, revealing the formation of gold nanoparticles. The effect of pH on the size of CAuNPs was studied by adjusting the pH of the reaction mixture (pH 5, 7, 9 and 11) by buffer solutions.2.5 Characterization
UV-vis optical absorption spectra of the colloidal Au nanoparticles were recorded in a dual beam Perkin-Elmer Lambda 950 spectrophotometer. The XRD analysis of the samples was carried out in a Bruker D8 Advance eco diffractometer using its CuKα (λ = 1.5406 Å) radiation. The XRD spectra were recorded in the 2θ range 10–900, with a scanning rate of 40 min−1 and step size of 0.020. The morphology, size, and microstructure of the fabricated Au nanoparticles were inspected in a Hitachi SU5000 Schottky field emission scanning electron microscope (FESEM), and a JEOL JEM 2100 transmission electron microscope (TEM) operating at 200 kV accelerating voltage. Dynamic light scattering (Malvern zetasizer, Model nano ZS) technique was used to determine the size distribution of the nanoparticles. To investigate the surface characteristics of the fabricated nanoparticles, their room temperature Fourier transform infrared (FT-IR) spectra were recorded in a Varian 660-IR FT-IR spectrophotometer.2.6 Catalytic tests
To study the catalytic activity of the Au nanoparticles fabricated through biosynthesis and chemical reduction, they were tested for the reduction of 4-nitrophenol (4-NP), a common industrial water pollutant dye, in presence of sodium borohydride (NaBH4). For the tests, first an aqueous solution of 4-NP of 0.1 M concentration was prepared, and the intensity of the principal absorption band of 4-NP appeared around 317 nm was monitored in its optical absorption spectrum. The kinetics of reduction of 4-NP by the added NaBH4 both in presence and in absence of biosynthesized and chemically synthesized AuNPs were studied by monitoring the temporal evolution of the intensity of characteristic absorption bands of 4-NP (around 317 nm) and 4-nitrophenolate ions (around 400 nm) in the reaction mixture, along with a visual color change during the reactions. It was noticed that under the used experimental conditions, a complete reduction of 4-NP solely by NaBH4 or Au nanoparticles is not possible.3. Results and discussion
We used CAS extract (Fig. SI1†) as a green reducing-cum-capping agent to synthesize gold nanoparticles (GAuNPs) of different sizes by controlling its pH. While the aqueous CAS extract is seen to be an effective reducing and capping agent for the growth of GAuNPs, the pH of the CAS extract is seen to play an important role to control the morphology and final size of the GAuNPs. Fig. 1 presents the absorption spectra of the colloidal AuNPs fabricated at different pH values of the reaction mixtures both by CAS extract reduction (Fig. 1A) and chemical reduction (Fig. 1B) processes. Formation of nanometric Au particles in both the processes is very clear from the appearance of characteristic localized surface plasmon resonance (LSPR) bands in respective absorption spectra. While the position of the LSPR band in the samples fabricated using chemical Turkevich process varied in nonlinear manner with the increase of reaction pH, it varied rather systematically for the CAS extract mediated green synthesis process. In general, the LSPR band blue shifts with the increase of reaction pH, indicating a probable size reduction of the formed NPs at higher pH values.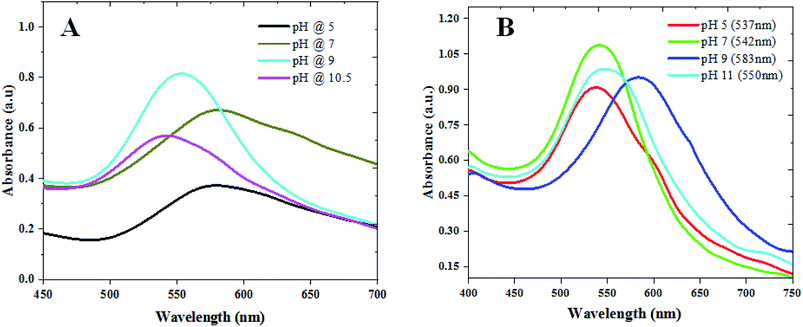 | ||
| Fig. 1 Absorbance spectra of the colloidal (A) GAuNPs and (B) CAuNPs synthesized at different pH values of the reaction mixtures. | ||
While a change in reaction medium pH from acidic to basic was found to decrease the reaction time, an increase in the width of the LSPR band for very high pH values (>10) of the CAS extract indicates the formation of agglomerated particles. In contrast to the broad band at pH 7 (Fig. 1A), the LSPR band of the gold NPs fabricated at pH 9 is the sharpest and of highest intensity, indicating a decrease in polydispersity of the formed NPs. The DLS estimated size distributions of the nanoparticles presented in Fig. S2 & S3 (ESI†) indicate similar trends of size and size distribution. However, on average, the AuNPs formed in CAS extract reduction process are substantially larger than their Turkevich counterparts.
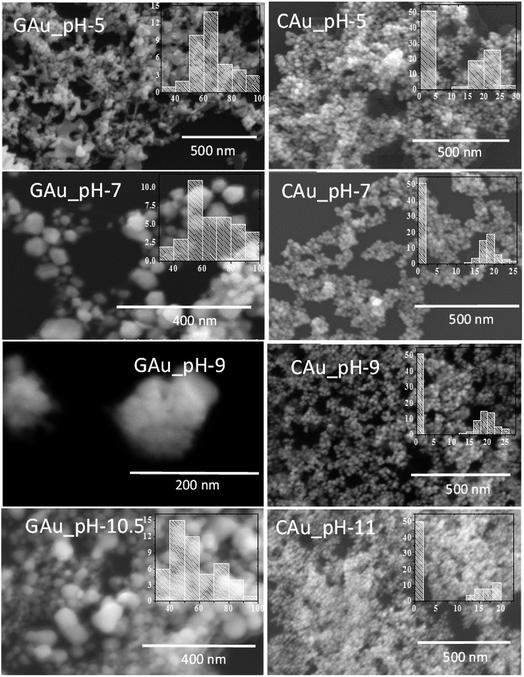
Fig. 2 presents typical SEM images of the AuNPs fabricated by the two methods at different pH values of the reaction mixture. Formation of NPs in the samples is very clear from the micrographs. While the formation of well-dispersed small AuNPs in Turkevich process is very clear from the SEM images (right column); apart from pH 5, all the samples prepared by CAS reduction process revealed agglomerated particles. In fact, from their SEM images, it is hard to follow the size and size distribution behaviours of the NPs noticed in their optical absorption spectra (Fig. 1A). While the formation of relatively bigger NPs in these green synthesized samples can be associated to the presence of biomass as the samples were not cleaned before their analysis, the DLS analysis of the samples (Fig. S2†) indicates a clear homogeneous size distribution for all the samples in contrary to their SEM images. Therefore, these samples were analysed further in transmission electron microscope.
As can be noticed from the TEM images presented in Fig. 3, all the biosynthesized samples contain well-dispersed AuNPs of average sizes very close to the values estimated from their DLS study. While the AuNPs formed in CAS extract mediated synthesis are of non-spherical shape, containing multiple facets, HRTEM images (presented as insets) revealed their highly crystalline nature, with occasional presence of twin-boundaries. It must be noted that while in the citrate reduction process (Turkevich method) the Au NPs were prepared near the boiling temperature (97 °C) of water, the NPs produced through CAS mediated process were grown at room temperature (23 °C).
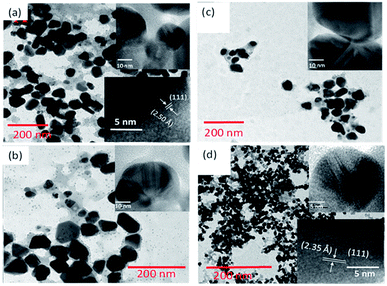 | ||
| Fig. 3 Typical TEM images of GAuNPs synthesized at (a) pH 5, (b) pH 7, (c) pH 9, and (d) pH 10.5. Insets show typical HRTEM images of AuNPs of the respective samples. | ||
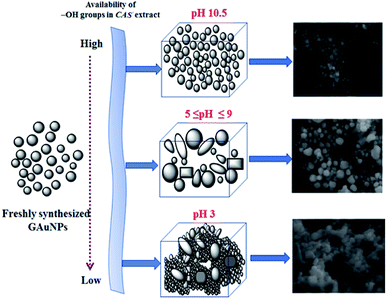
As we can see, the morphology and shape of the NPs grown in CAS extract mediated process depend strongly on the pH of the reaction mixture. The biosynthesis process produced (Fig. 3) abundant anisotropic AuNPs of irregular shapes, along with some spherical particles. While a lower pH value of the reaction mixture produces bigger NPs probably due to the limited availability of capping agent (OH– functional groups; discussed in the latter part of the manuscript), a higher pH value of the reaction mixture (e.g. pH > 10) produces quasi-spherical Au nanoparticles of smaller sizes (Fig. 3d). The results indicate that it is quite possible to control the shape anisotropy and size of Au NPs in CAS extract mediated green synthesis process by controlling the pH of the reaction mixture. The effect of reaction mixture pH on the shape and size control of the AuNPs fabricated through CAS extract mediated green synthesis process has been depicted schematically in Fig. 4.
To compare the crystallinity of the Au nanoparticles fabricated by the two distinct processes, their XRD patterns were recorded. For XRD analysis, the samples were prepared by drop-casting the colloids over glass substrates and drying in ambient conditions. As can be noticed in Fig. S4,† the diffraction patterns of the CAuNPs revealed sharp and well-defined peaks around 38.2, 44.8, 64.8, 78.1 and 82.0°, which correspond to the (111), (200), (220), (311), and (222) lattice planes of metallic gold in fcc phase (JCPDS # 04-0783). Similarly, the XRD patterns of the GAuNPs (Fig. S3B†) revealed diffraction peaks at around 38.5, 44.6, 65.0, 77.9 and 82.2°, which correspond to the same lattice planes of fcc gold. The observed small variations (higher angle shift of the (111), (220), and (222), and lower angle shift of the (200), and (311) diffraction peaks) of the peak positions indicate a small shrinkage or expansion of interplanar spacing along the different faceted planes of GAuNPs. In fact, the change in interplanar spacing noticed in the XRD patterns of the GAuNPs has also been observed in the HRTEM images of the NPs (Fig. 3). To compare the extent of crystallinity of the Au NPs fabricated by two processes, average grain sizes of the NPs were estimated using Debye–Scherer's relationship D = 0.9λ/β![[thin space (1/6-em)]](https://www.rsc.org/images/entities/char_2009.gif) cos
cos![[thin space (1/6-em)]](https://www.rsc.org/images/entities/char_2009.gif) θ (where D is the average grain size, θ is the diffraction angle, and β is the full width at half maximum in radian) on the most intense (111) reflection of the samples (Table 1).
θ (where D is the average grain size, θ is the diffraction angle, and β is the full width at half maximum in radian) on the most intense (111) reflection of the samples (Table 1).
| Catalyst | Avg. particle size of AuNPs (nm) | Time of reduction (min) | R2 (correlation coefficient) | Rate constant k (min−1) | Extent of reduction (%) | ||||
|---|---|---|---|---|---|---|---|---|---|
| DLS | TEM | SEM | XRD | ||||||
| a Amount of 4-NP (10–2 M: 13.9 mg), NaBH4 (10–1 M: 378 mg) and catalyst 2.76 mg per 100 mL. | |||||||||
| GAuNPs | pH 5 | ∼69 | 64 ± 32 | 66 ± 31 | — | 53 | 0.9632 | 0.0387 | 100 |
| pH 7 | ∼67 | 61 ± 29 | 64 ± 30 | ∼62 | 53 | 0.9340 | 0.0663 | 100 | |
| pH 9 | ∼59 | 54 ± 25 | 56 ± 26 | — | 45 | 0.9355 | 0.0538 | 100 | |
| pH 10.5 | ∼28 | 22 ± 16 | 25 ± 18 | — | 38 | 0.9601 | 0.0522 | 100 | |
| CAuNPs | pH 5 | ∼20 | — | 13 ± 11 | — | 28 | 0.9830 | 0.1009 | 100 |
| pH 7 | ∼21 | — | 11 ± 9 | ∼19 | 30 | 0.9462 | 0.0826 | 100 | |
| pH 9 | ∼22 | — | 11 ± 8 | — | 32 | 0.9822 | 0.0882 | 100 | |
| pH 11 | ∼13 | — | 8 ± 9 | — | 22 | 0.9844 | 0.1401 | 100 | |
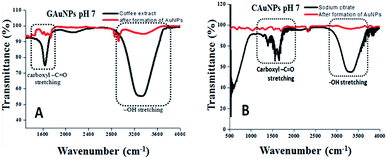
Fourier transform infrared (FT-IR) analysis of the reaction mixtures used for the synthesis of AuNPs in two techniques was carried out before and after the reduction of Au ions (i.e. formation of AuNPs) (Fig. 5) to identify the functional groups responsible for reduction and stabilization of the formed NPs. The most intense FT-IR bands revealed for both the CAS extract and sodium citrate solution are found to be located around 1625 cm−1 and 3064–3420 cm−1, which correspond to the –C![[double bond, length as m-dash]](https://www.rsc.org/images/entities/char_e001.gif) O stretching and –OH stretching band, correspond to the phenolic compounds.28 As can be observed, after the termination of reactions, the intensity of both the IR bands decrease significantly, indicating their active participation in the reduction of gold ions and stabilization of the formed gold NPs. It seems the phenolic groups of CAS extract, responsible for the anti-oxidating property of coffee beans, are responsible both for the reduction of Au ions and the stabilization of the formed AuNPs as in the case of chemical citrate reduction process.29 A drastic intensity reduction of the broad (3064–3420 cm−1) absorption band associated to –OH stretching after the formation of AuNPs confirms that the band correspond to the phenolic groups, not associated to the –OH stretching of water, which was present in both the reaction mixtures.
O stretching and –OH stretching band, correspond to the phenolic compounds.28 As can be observed, after the termination of reactions, the intensity of both the IR bands decrease significantly, indicating their active participation in the reduction of gold ions and stabilization of the formed gold NPs. It seems the phenolic groups of CAS extract, responsible for the anti-oxidating property of coffee beans, are responsible both for the reduction of Au ions and the stabilization of the formed AuNPs as in the case of chemical citrate reduction process.29 A drastic intensity reduction of the broad (3064–3420 cm−1) absorption band associated to –OH stretching after the formation of AuNPs confirms that the band correspond to the phenolic groups, not associated to the –OH stretching of water, which was present in both the reaction mixtures.
The catalytic performances of AuNPs fabricated at different pH values of the reaction mixtures were explored in the reduction (decolorization) of 4-NP by NaBH4 as a strong reducing agent. An aqueous 4-NP (pale yellow) solution shows absorbance maximum (λmax) at 317 nm. Addition of NaBH4 to the 4-NP solution resulted a visual color change (from pale yellow to intense yellow) due to the formation of 4-nitrophenolate ion, shifting the absorption maximum from 317 to 400 nm (Fig. 6 and 7). After the addition of catalyst (AuNPs), the intensity of the absorption band at 400 nm decreases gradually. Meanwhile, a new absorption band appears around ∼298 nm, whose intensity increases with time. The appearance of this new absorption band indicates the formation of 4-aminophenol due to the reduction of 4-NP.30 Finally, the reaction stops with a visual color change from dark yellow to color less. A similar reaction kinetics was observed for the AuNPs fabricated both CAS extract reduction and citrate reduction techniques, although the 4-NP reduction seems to be a bit faster for the NPs fabricated by citrate reduction process.
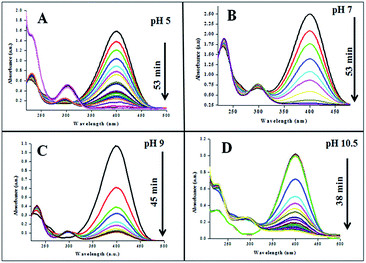 | ||
| Fig. 6 Time dependent 4-NP absorption spectra for the GAuNPs fabricated at different pH values of the reaction by the mixture. | ||
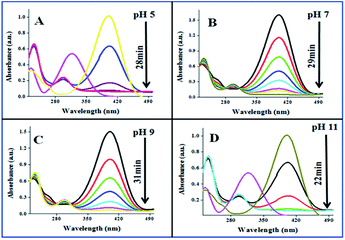 | ||
| Fig. 7 Time dependent 4-NP absorption spectra for the CAuNPs fabricated at different pH values of the reaction by the mixture. | ||
As can be observed from the 4-NP degradation kinetics of the fabricated AuNPs presented in Fig. 8, 4-NP degradation rates of CAuNPs are a bit faster (Table 1) in comparison with the degradation rates of GAuNPs prepared at similar pH values. One of the factors contributing to faster kinetics could be relatively smaller sizes of CAuNPs. Additionally, slower kinetics of GAuNPs than the corresponding chemical counterparts can also be attributed to the adsorption of oxidized phenolic groups at the surface of green AuNPs, lowering the adsorption of the nitroaromatic substrate.
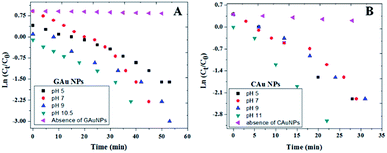 | ||
| Fig. 8 Kinetics of 4-NP degradation by (A) GAuNPs, and (B) and CAuNPs fabricated at different pH values of reaction mixtures. | ||
Best degradation performances of the GAuNPs fabricated at pH 10.5 and CAuNPs fabricated at pH 11 (Fig. 8) might be due to their smaller sizes, in comparison to the AuNPs formed at other pH values.
Since the amount of NaBH4 in the catalytic solutions was in large excess, the reduction of 4-NP takes place at the surface of AuNPs following the reaction scheme:
| X + Y ⇔ XY → Z, |
| r = ln(Ct/C0) = −kt, |
As can be noticed from Fig. 9 and Table 1, the 4-NP reduction rates of the GAuNPs are a bit slower in comparison to the reduction rates of CAuNPs, due to their bigger sizes. However, the catalytic 4-NP reduction rate of the GAuNPs (of 28 nm average size) fabricated at pH 10.5 is close to the 4-NP reduction rate of CAuNPs fabricated at pH 7.0 and pH 9.0. Moreover, the time of total 4-NP reduction of these AuNPs are very similar, indicating the 4-NP degradation capability of AuNPs fabricated by CAS extract mediated green synthesis is very similar to the AuNPs fabricated by chemical Turkevich process. Additionally, small sized GAuNPs were also tested and compared with CAuNPs for the degradation of Methylene Blue (MB) (Ref to Fig. S5†).
The general catalytic mechanism for the reduction of 4-NP using NaBH4 and AuNPs as catalysts is shown in Fig. 9. Following the already published work by A. Corma et al.31 and K. Layek et al.,32 the specific details of the mechanism can be understood in the following steps:
Step 1: Ionization of NaBH4 in the aqueous medium results in the generation of borohydride ions followed by their adsorption onto the surface of AuNPs. Borohydride ions react to form gold hydride complex. Simultaneously 4-NP adsorbs onto the surface of AuNPs. As both the processes are reversible, adsorption is accompanied by desorption process.
Step 2: Adsorption equilibrium on the surface of the catalyst results in the hydrogen transfer from the hydride complex to 4-NP followed by the formation of 4-nitrophenolate ion.33 Although the definite mechanism is still open to discussion, following the published theories,31,32 two possible routes can be proposed for the reduction of the formed 4-NP to 4-AP: direct and condensation route. In the direct route, two consecutive fast reactions result in the reduction of nitro group to nitroso followed by the formation of HO–Ar–NHOH (hydroxylamine; Ar: aromatic ring). Finally, in a relatively slow reaction, HO–Ar–NHOH is reduced to HO–Ar–NH2. The condensation route generally involves the condensation of hydroxylamine with the nitroso compound resulting in the generation of azoxy compounds. This is followed by its reduction in three stages, azoxy to hydrazo and then to 4-AP.
4. Conclusions
In summary, we demonstrate the use of natural Coffea arabica seed extract for the fabrication of size tunable crystalline gold nanoparticles at room temperature. The size of the Au nanoparticles could be controlled by pH adjustment of CAS extract in the similar way as the chemical Turkevich process, which occurs near the boiling point of water on the utilization of added reductor NaBH4. Particle size dependent catalytic activity of the gold nanoparticles fabricated by CAS mediated green synthesis process for the degradation of 4-NP is seen to be comparable to the gold nanoparticles fabricated by Turkevich process. The results presented in the present study clearly demonstrate the feasibility of CAS-mediated green synthesis process as a good alternative of conventional chemical reduction processes for the production of noble metal nanoparticles on large scale for their utilization in environmental remediation.Conflicts of interest
There are no conflicts to declare.References
- T. Chen, M. Pourmand, A. Feizpour, B. Cushman and B. M. Reinhard, J. Phys. Chem. Lett., 2013, 4(13), 2147–2152 CrossRef PubMed.
- L. Montaño-Priede, O. Peña-Rodríguez, A. Rivera, A. Guerrero-Martínez and U. Pal, Nanoscale, 2016, 8(31), 14836–14845 RSC.
- G. Corro, S. Cebada, U. Pal and J.-L. Garcia Fierro, J. Catal., 2017, 347, 148–156 CrossRef.
- S. Mondal, M. E. De Anda Reyes and U. Pal, RSC Adv., 2017, 7(14), 8633–8645 RSC.
- J. Villanueva-Cab, J. L. Montaño-Priede and U. Pal, J. Phys. Chem. C, 2016, 120(19), 10129–10136 CrossRef.
- S. Mondal, M. E. De Anda Reyes and U. Pal, RSC Adv., 2017, 7(14), 8633–8645 RSC.
- M. De Lourdes Ruiz Peralta, U. Pal and R. Sánchez Zeferino, ACS Appl. Mater. Interfaces, 2012, 4(9), 4807–4816 CrossRef PubMed.
- R. A. Ismail, N. J. Almashhadani and R. H. Sadik, Appl. Nanosci., 2017, 7(3–4), 109–116 CrossRef.
- G. V. Hartland, Chem. Rev., 2011, 111(6), 3858–3887 CrossRef PubMed.
- K. Sharma, G. Singh, M. Kumar and V. Bhalla, RSC Adv., 2015, 5, 25781–25788 RSC.
- J. L. Montaño-Priede, O. Peña Rodríguez and U. Pal, J. Phys. Chem. C, 2017, 121(41), 23062–23071 CrossRef.
- S. Kumar-Krishnan, A. Hernandez-Rangel, U. Pal, O. Ceballos-Sánchez, F. J. Flores-Ruiz, E. Prokhorov, O. A. de Fuentes, R. Esparza and M. Meyyappan, J. Mater. Chem. B, 2016, 4, 2553–2560 RSC.
- Y. H. Kim, D. K. Lee, H. G. Cha, C. W. Kim and Y. S. Kang, J. Phys. Chem. C, 2017, 111(9), 3629–3635 CrossRef.
- N. K. R. Bogireddy, K. K. H. Anand and B. K. Mandal, J. Mol. Liq., 2015, 211, 868–875 CrossRef.
- N. K. R. Bogireddy, K. K. H. Anand and B. K. Mandal, J. Environ. Chem. Eng., 2016, 4(1), 56–64 CrossRef.
- S. Wunder, F. Polzer, Y. Lu, Y. Mei and M. Ballauff, J. Phys. Chem. C, 2010, 114, 8814–8820 CrossRef.
- S. H. Lim, E. Y. Ahn and Y. Park, Nanoscale Res. Lett., 2016, 11, 474 CrossRef PubMed.
- I. Siavash, K. Hassan, V. M. Seyed and Z. Behzad, Res. Pharm. Sci., 2012, 9, 385–406 Search PubMed.
- N. M. Nadagoudaa and S. R. Varma, Green Chem., 2008, 8, 859–862 RSC.
- S. Zhang, W. Wu, X. Xiao, J. Zhou, J. Xu, F. Ren and C. Jiang, Asian J. Chem., 2000, 7, 1781–1788 CrossRef PubMed.
- N. R. Jana, L. Gearheart and C. J. Murphy, Langmuir, 2001, 17(22), 6782–6786 CrossRef.
- N. G. Bastús, J. Comenge and V. Puntes, Langmuir, 2011, 27(17), 11098–11105 CrossRef PubMed.
- J. Kimling, M. Maier, B. Okenve, V. Kotaidis, H. Ballot and A. Plech, J. Phys. Chem. B, 2006, 110, 15700–15707 CrossRef PubMed.
- R. Deshpande, R. Bhat, S. Ganachari, M. D. Bedre, H. Vasanth, M. S. Yalagatti, M. Bhagawanraju and A. Venkatarama, Cancer Nanotechnol., 2011, 2, 57–65 CrossRef PubMed.
- Z. Molnár, V. Bódai and G. Szakacs, et al., Sci. Rep., 2018, 8, 3943 CrossRef PubMed.
- P. Dauthal and M. Mukhopadhyay, Ind. Eng. Chem. Res., 2016, 55(36), 9557–9577 CrossRef.
- T. Vincent and E. Guibal, Langmuir, 2003, 19, 8475–8483 CrossRef.
- T. Maruyama, Y. Fujimoto and T. Maekawa, J. Colloid Interface Sci., 2015, 447, 254–257 CrossRef PubMed.
- B. Rodrígez-Gonzalez, P. Mulvaney and L. M. Z. Liz-Marzán, Z. Phys. Chem., 2007, 221, 415 CrossRef.
- Y. Choi, M. J. Choi, S. H. Cha, Y. S. Kim, S. Cho and Y. Park, Nanoscale Res. Lett., 2014, 9, 103 CrossRef PubMed.
- A. Corma, P. Concepción and P. Serna, Angew. Chem., 2007, 119, 7404–7407 CrossRef.
- K. Layek, M. Lakshmi Kantam, M. Shirai, D. Nishio-Hamane, T. Sasakid and H. Maheswarana, Green Chem., 2012, 14, 3164–3174 RSC.
- A. K. Abay, X. Chen and D. Kuo, New J. Chem., 2017, 41, 5628 RSC.
Footnote |
| † Electronic supplementary information (ESI) available. See DOI: 10.1039/c8ra04332a |
| This journal is © The Royal Society of Chemistry 2018 |

