DOI:
10.1039/C8RA03961E
(Paper)
RSC Adv., 2018,
8, 24827-24835
Enhanced photocatalytic and antibacterial activity of plasma-reduced silver nanoparticles†
Received
9th May 2018
, Accepted 23rd June 2018
First published on 10th July 2018
Abstract
A non-thermal atmospheric pressure plasma jet has been used for the green synthesis of highly dispersed colloidal silver nanoparticles. The reducing species such as hydrogen radicals and hydrated electrons are identified, and the change in the solution pH is studied during AgNP formation. The structural properties and size of the plasma-reduced silver nanoparticles are characterized via X-ray diffraction, ultraviolet-visible spectroscopy, fluorescence spectroscopy and transmission electron microscopy. The size of the colloidal AgNPs is tuned by adjusting the initial concentration of AgNO3. The effect of terephthalic acid, a hydroxyl radical scavenger, on the reduction of Ag+ ion is studied. The typical catalytic activity data indicate the better performance of the plasma-reduced colloidal Ag nanoparticles than that obtained from the chemical reduction method. The antibacterial activity of the plasma-reduced Ag nanoparticles also shows a better performance than that of the chemically reduced AgNPs, highlighting the potential of the plasma reduction approach for the synthesis of metal nanoparticles, which are stable even after 30 days without a stabilizing agent. Additionally, the effects of hydroxyl scavengers (isopropyl alcohol) and Fenton's reagent (Fe2+ salt) on CV degradation are studied.
1. Introduction
The application of metal nanoparticles in various fields of science and technology is continuously increasing due to their unique electronic and optical properties.1 Especially, silver nanoparticles are widely used in biological and catalytic applications due to their non-hazardous nature.2–4 Silver in the form of nitrate is generally used to induce antimicrobial activity; however, in the case of silver nanoparticles (AgNPs), there is a huge increase in the surface area exposed to microorganisms. AgNPs are successfully used in food storage, wound healing, electrical appliances, medicine and personal care products.5–8 Unlike, their “macro” counterparts, nanoparticles have unique and effective physico-chemical properties, which make them suitable towards antimicrobial applications.9,10 It has been observed that reducing the size of AgNPs enhances their stability and biocompatibility.11 A large variety of metal oxides, including TiO2 and ZnO, have been studied for the mitigation of toxic organic pollutants. TiO2 is one of the widely studied photocatalysts due to its large band gap of 3.2 eV; however, the scope of its application is limited due to the requirement of UV light. Thus, attempts have been made to shift its absorption edge into the visible region by incorporating metal nanoparticles (Ag/Au/Mn/Cr) into the TiO2 matrix or Au/Ag NPs supported on TiO2, which can improve its visible light response.12–14 A large number of preparation methods have been reported for the synthesis of noble nanoparticles such as laser ablation, electrochemical synthesis, microwave irradiation, radiolysis, solvothermal synthesis, chemical reduction methods and glow discharge plasma.15–19 Among these methods, the chemical reduction route is simple and less time consuming. In the chemical reduction process, reducing agents such as hydrazine hydrate (N2H4) and sodium borohydride (NaBH4) are used to reduce the metal precursors, and the resulting nanoparticles are stabilized with sodium dodecyl sulfate (SDS) and N-vinylpyrrolidone.18,20 Picosecond laser ablation and ultrasonic irradiation have been tested for the synthesis of AgNPs;15,21 however, these methods have specific limitations due to the need for highly sophisticated instruments, and their reducing agents are harmful to the environment. Accordingly, the synthesis of stable silver nanoparticles without the use of capping agents is highly desirable.
Non-thermal plasma reduction is a green, fast, economic and facile synthesis method for colloidal AgNPs in the absence of stabilizers at ambient conditions.22 Electrical discharge in water may alter physical and chemical properties and may create a reactive environment such as shock waves, high electric fields, UV radiation and in particular chemically reactive species such as hydroxyl radicals (˙OH), hydrogen radicals (˙H) and hydrated electrons (eaq−).23 In this scenario, ˙H and eaq− act as reducing agents, which can reduce Ag+ to Ag. Furthermore, the highly energetic electrons play a vital role in protecting the formed colloidal AgNPs from aggregation. Hydrogen (H2) plasmas have been used successfully to reduce metal ions due to the production of strong reducing species such as ˙H.24,25 However, an atmospheric pressure plasma jet (APPJ) operating under argon atmosphere is the most efficient and economical process.
Herein, the synthesis of AgNPs has been carried out with an atmospheric pressure plasma jet under ambient conditions; AgNPs are synthesized without the use of either a reducing agent or a stabilizer. The size of AgNPs in the colloidal solution is tuned by changing the reaction conditions. The formation of AgNPs is confirmed by various techniques such as structural (XRD and TEM) and optical (UV-Vis and fluorescence) spectroscopies. Additionally, the photocatalytic activity and antibacterial activity of the plasma-reduced AgNPs (Ag-P) are tested, and the results are compared with those of chemically reduced AgNPs (Ag-C).
2. Experimental
2.1 Experimental setup
A schematic of the experimental setup and details are given elsewhere.26 Briefly, plasma was created by applying high voltage between a stainless steel inner electrode (high voltage electrode) and stainless steel mesh outer electrode (ground electrode). A high voltage probe was connected to the inner electrode to measure the applied voltage (16 kV), and the voltage (V)–charge (Q) waveforms were recorded using an oscilloscope (Tektronix TDS 2014B). The applied voltage (V) was plotted against the charge (Q) to obtain a Lissajous figure, and its area was multiplied by the frequency to give the power dissipated in the discharge.23,27 The power dissipated in the discharge was around 0.9 W at an applied voltage of 16 kV.
2.2 Reagents and methods
Silver nitrate (AgNO3), sodium borohydride (NaBH4), monochloroacetic acid (ClCH2COOH), titanium dioxide (TiO2), crystal violet, terephthalic acid (TA), 2-hydroxy terephthalic acid (HTA), hydrogen peroxide (H2O2), sulfuric acid (H2SO4), potassium nitrate (KNO3), sodium hydroxide (NaOH), isopropyl alcohol, and ferrous chloride (FeCl2) were purchased from Merck. An Aalborg mass flow controller (MFC) was used to adjust the gas flow rate at 300 sccm. The hydrated electrons (eaq−) formed during the discharge process were identified using Goodman's method.23 For this, 1 mM of monochloroacetic acid was used as the eaq− scavenger, where Cl˙ reacts with eaq− to give Cl− ions. The chloride ions formed during the discharge process were analyzed by ion chromatography (IC) on a DIONEX ICS-2100 using 24 mA current, eluent (25 mM of KOH) flow rate of 0.38 mL min−1 and 10 μL of sample, and the column temperature was maintained at 30 °C during the analysis. An emission spectrometer (Princeton Instrument Action SpectraPro® SP-2300) was used to identify the active species formed at the gas–liquid interface. For this, an optical fiber probe was positioned close to the flask to obtain the emission spectrum of the discharge species. A grating with a resolution of 500 nm at 600 g mm−1 was used, and the diameters of the optical sensor and optical fiber were 11 mm and 3.36 mm, respectively. Plasma discharge was carried out under an argon atmosphere at a constant flow rate of 300 sccm.
Twenty mL of AgNO3 solution (1–3 mM) was placed in a beaker, and the plasma jet was placed approximately 3 mm above from the sample surface. The plasma reduction time was varied in between 5 and 15 min. The AgNO3 solutions with different concentrations (1–3 mM) were labeled as S1, S2 and S3, respectively. Metal-impregnated TiO2 nanocomposites (Ag–TiO2) were synthesized via the wet impregnation method. TiO2 (∼250 mg) was mixed with 25 mL of deionized water (DI) by adding an appropriate amount (0.5–2 wt%) of AgNPs, and the resulting solution was stirred overnight, washed repeatedly with DI water, and then dried at 100 °C.13 In the chemical method, AgNPs were prepared using NaBH4, as previously reported.28 Solutions of 2.38 × 10⁻³ M NaBH4 and 1.32 × 10⁻³ M AgNO3 were prepared separately. To 40 mL of the NaBH4 solution, 2, 4, 6 and 8 mL of the AgNO3 solutions were added under stirring to give a yellow colored solution. The first two solutions (1.20 × 10⁻⁴ M) were stable, whereas with the further addition of AgNO3, the solutions became unstable; after 1 h, the solutions started to become turbid and grey.
For photocatalytic degradation, crystal violet (CV) was used as a model dye, and the photocatalytic experiments were performed under sunlight. To achieve adsorption–desorption equilibrium, the dye-containing solution along with the catalyst was placed in the dark for 30 min before exposure to the sunlight. The concentration after equilibrium was considered as the initial concentration (20 mg L−1). The average temperature during the experiment was found to be around 30 °C (Hyderabad: 17°38′N, 78°48′E; date: 5th January 2018). A small amount of aliquot was collected every 20 min and centrifuged at 5000 rpm for 5 min to obtain uncontaminated supernatant. An ultraviolet-visible (UV-Vis) spectrophotometer was used to measure the concentration of dye present in the supernatant at different time intervals. The antibacterial and photocatalytic activities of three different AgNPs (S1, S2 and S3) were tested, and the results were compared with those of chemically reduced AgNPs. The plasma-reduced AgNPs and chemically reduced AgNPs are labeled as Ag-P and Ag-C, respectively.
For bacterial inactivation studies, a standard wild-type commercially available Escherichia coli DH5alpha strain was used, and similar results were found with E. coli BL21 and E. coli K-12. A loop full of bacterial cells was inoculated into 100 mL of freshly prepared nutrient broth and then incubated to the exponential phase for 16 h at 37 °C with a constant stirring rate of 200 rpm. The bacterial cells were grown to ∼3.0 OD at 600 nm, harvested by centrifugation (6000 rpm) for 5 min and then suspended in sterilized deionized water (DI). The bacterial (E. coli) concentration was monitored using optical density (OD) at 600 nm at regular time intervals. To maintain the bacterial concentration relatively constant from one experiment to another, the bacterial suspension was maintained at a constant OD600 value of 0.1.
The long-lived H2O2 species formed during photocatalysis were identified using titanium sulfate, which formed the yellow colored pertitanic acid and showed a maximum absorbance at 420 nm (T90+ UV-Vis spectrometer, PG 94 Instruments Ltd., India). Anhydrous titanium dioxide (0.5 g) was added to 50 mL of sulfuric acid, and this solution was heated to 150 °C in a sand bath for 15 h to obtain the titanium sulfate reagent; the solution was diluted and filtered through 0.45 μm filter paper. The short-lived ˙OH species were quantified by the chemical dosimetry method, where terephthalic acid (TA) reacts with ˙OH to form 2-hydroxy terephthalic acid (HTA), which is a fluorescent compound. A solution containing 2 mM of TA, 5 mM of NaOH, and 50 mg of 1 wt% Ag(P)–TiO2 catalyst (50 mL) was irradiated with sunlight up to 120 min. During fluorescence spectroscopy, TA and HTA molecules in the solution were irradiated by UV light with an excitation wavelength of 310 nm, and only HTA showed an emission at 425 nm. The extent of mineralization was confirmed using a TOC-VCPH (Shimadzu, Japan) analyzer.
2.3 Characterization techniques
Various types of analytical tools were used to characterize the plasma-reduced AgNPs. A T90+ UV-Vis spectrometer (PG Instruments Ltd., India) was used to study the surface plasmon resonance (SPR) of AgNPs and to determine the concentration of CV present in the solution. A Horiba fluoromax-4 fluorescence spectrometer was used to study the fluorescence emission spectra of AgNPs. X-ray diffraction (XRD) was used to study the crystallinity of the Ag nanoparticles. Diffraction patterns were recorded using Cu Kα radiation (1.5418 Å) with an Ni filter in the 2θ range of 5–50°. XRD patterns were obtained with a step size of 0.0167° and a scan rate of 0.0301° s−1 on a PANalytical X'pert PRO powder X-ray diffractometer. The morphology of products was analyzed via transmission electron microscopy (TEM-TECNAI-G2 EDS model).
3. Results and discussion
3.1 Identification of reducing species
Fig. 1a presents the emission spectrum of the gas–liquid interface, which confirmed that the formed reducing species ˙H showed a characteristic emission at 658.8 nm. The discharge gas Ar produces long-lived metastable Ar (3p) species, which transfer the energy to water molecules, leading to the formation of ˙H and ˙OH.29,30 Goodman's method was used to identify the hydrated electrons (eaq−) during plasma discharge. As presented in eqn (4), the hydrated electrons react with ˙Cl to form Cl−, which was further confirmed by IC (Fig. 1b).| | |
H2O+ + nH2O → H3O+ + n˙OH + (n − 1)˙H
| (1) |
| | |
H2O + *e− → ˙H + ˙OH + e−
| (2) |
| | |
eaq− + ClCH2COOH → Cl− + ˙CH2COOH
| (4) |
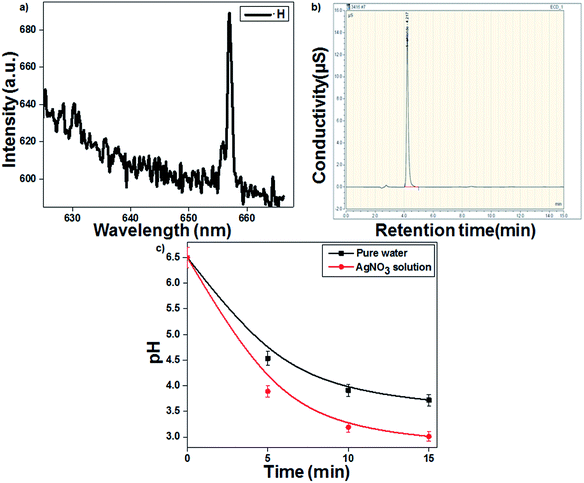 |
| | Fig. 1 (a) Optical emission spectrum of the hydrogen radical (˙H). (b) Chromatogram of chloride ions. (c) Change in solution pH as a function of treatment time (16 kV voltage and 300 sccm Ar gas flow). | |
The highly energetic electrons can induce the dissociation of water molecules to ˙OH and ˙H in an aqueous solution (eqn (1)–(3)). Additionally, the strong reducing species eaq− and ˙H from the plasma discharge can easily reduce Ag+ metal ions into Ag colloidal solution (eqn (5) and (6)).31 The highly energetic electrons play a prominent role in protecting the plasma-reduced colloidal Ag nanoparticles from aggregation.22 The particles retain their electric charge and repel each other, resulting in the formation of stable and uniform colloidal AgNPs. The time required for Ag+ ion reduction decreased to 10 min in the presence of the ˙OH scavenger TA, which prevented the recombination of ˙H and ˙OH. The pH of the AgNO3 solution decreased more than that of the blank (pure water). As presented in eqn (6), the reduction of Ag+ by plasma was accompanied with the release of a proton. Therefore, the AgNO3-containing solution became more acidic (3.01) than the blank solution (3.72) (Fig. 1c).
| |
Ag+ + eaq− → Ag![[thin space (1/6-em)]](https://www.rsc.org/images/entities/char_2009.gif) k = 3.3 × 10¹⁰ k = 3.3 × 10¹⁰
| (5) |
| |
Ag+ + ˙H → Ag + H+![[thin space (1/6-em)]](https://www.rsc.org/images/entities/char_2009.gif) k = 2.2 × 10¹⁰ k = 2.2 × 10¹⁰
| (6) |
3.2 Ultraviolet-visible and fluorescence spectroscopy
UV-Vis spectroscopy is a preliminary characterization technique, and the formation of AgNPs was confirmed by specific surface plasmon resonance (SPR) bands.32,33 The particle size, concentration and shape of the nanoparticles are the most important factors that cause changes in the SPR bands. The effect of the initial concentration of AgNO3 samples was studied by recording their UV-Vis spectrum every 5 min. As seen from Fig. 2a, the synthesis of AgNPs using 1 mM of AgNO3 solution resulted in an SPR peak at 412 nm, which shifted to 421 nm and 423 nm with an increase in the AgNO3 concentration from 2 to 3 mM, respectively. A red shift and broadening of the SPR peaks were observed with the increase in concentration, which suggested an increase in particle size. The plasma treatment time enhanced the rate of Ag+ reduction, and the intensity and sharpness of the SPR peaks increased due to the formation of more AgNPs (Fig. 2b). The UV-Vis spectra of pure TiO2 and 1 wt% Ag-loaded TiO2 are presented in Fig. S1 in the ESI.† The cut-off wavelength of pure TiO2 was observed at 382 nm (3.24 eV), which shifted to 425 (2.91 eV) nm for the 1 wt% Ag-loaded TiO2.
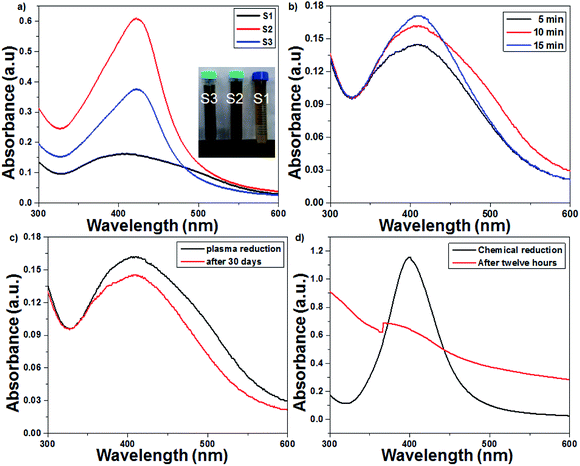 |
| | Fig. 2 UV-Vis spectra of the plasma-reduced AgNPs. (a) Effect of the initial concentration (1–3 mM) of AgNO3 solution on the SPR pattern. (b) Effect of the plasma treatment time on the SPR pattern (at 16 kV voltage and 300 sccm Ar gas flow). (c) Plasma-reduced AgNPs immediately and 30 days after their preparation. (d) Chemically reduced AgNPs immediately and 12 h after their preparation. | |
The plasma treatment time and the initial concentration of AgNO3 play prominent roles in the synthesis of colloidal AgNPs. In this context, the optimized conditions required to obtain small-sized colloidal AgNPs are 1 mM AgNO3 solution and 15 min of plasma treatment. The AgNPs prepared with 1 mM AgNO3 via the chemical route with the NaBH4 reducing agent were unstable; after 12 h, a turbid solution was obtained due to the agglomeration of silver nanoparticles. Interestingly, the AgNPs prepared from the plasma approach were stable even after 30 days. As seen from Fig. 2c and d, the absorption spectrum of the chemically reduced AgNPs shifted irregularly, whereas in the spectrum of the plasma-treated AgNPs, this shift was not observed.
3.3 XRD
The X-ray diffraction patterns of the plasma-reduced silver nanoparticles are shown in Fig. 3. The strong Bragg reflections at the 2θ values of 38.26° (2.35), 44.21° (2.05), 64.52° (1.44), 77.55° (1.23) and 81.68° (1.18) corresponded to the (111), (200) (220) (311) and (222) planes, which confirmed the formation of Ag nanoparticles (JCPDS file no. 04-0783).34 As seen from the above-mentioned patterns, the most significant peak was positioned at a d-spacing of 2.35 A°, which corresponded to the (111) plane. In addition, the crystal sizes of these AgNPs were calculated using the Debye–Scherrer formula, as given in eqn (7), and they were found to be 11, 14 and 16 nm. The XRD results confirmed that the resultant silver particles were crystalized in an FCC arrangement. The XRD pattern of TiO2 and Ag-loaded TiO2 is given in Fig. S2 in ESI.† It was noted that no Ag phase was identified by XRD analysis since the content of Ag loaded on the TiO2 surface was very low.| |
d = Kλ/β![[thin space (1/6-em)]](https://www.rsc.org/images/entities/char_2009.gif) cos cos![[thin space (1/6-em)]](https://www.rsc.org/images/entities/char_2009.gif) θ θ
| (7) |
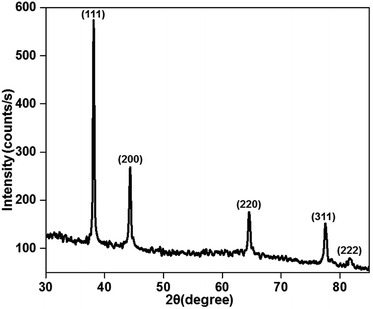 |
| | Fig. 3 X-ray diffraction pattern of the plasma-reduced silver nanoparticles (at 16 kV voltage and 300 sccm Ar gas flow). | |
3.4 TEM
The TEM images of AgNPs are presented in Fig. 4a–c, which show highly dispersed and spherical colloidal nanoparticles. The average particle sizes of AgNPs are around 11, 14 and 16 nm for 1 mM, 2 mM and 3 mM samples, respectively. The selected area electron diffraction (inset of Fig. 4) confirms the interlayer spacing of 0.236 nm, which is the characteristic d-spacing for the (111) plane of Ag, and this result is consistent with the observation made from the XRD data. The particle size increases with an increase in the initial concentration, as shown in Fig. 4d–f.
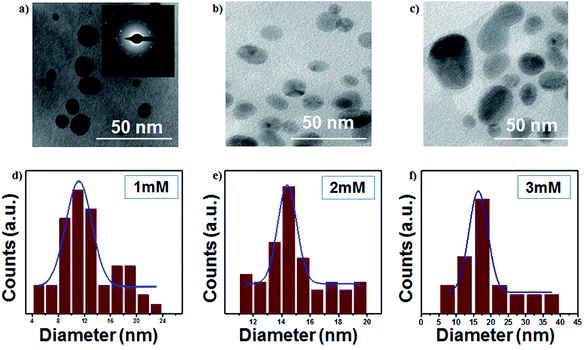 |
| | Fig. 4 (a–c) TEM images of the colloidal Ag nanoparticles (scale bar: 50 nm) and (d–f) size distributions of colloidal Ag nanoparticles (at 16 kV voltage and 300 sccm Ar gas flow). | |
3.5 Antibacterial activity of plasma- and chemically reduced AgNPs
The plasma-reduced AgNPs (S1, S2 and S3) were tested for their antibacterial activities on E. coli. In this study, E. coli with a CFU concentration of 107 per mL was used to study the antibacterial activity of AgNPs (inset of Fig. 5). The bacterial (E. coli) growth curves decreased with a decrease in the particle size and accordingly, S1 showed the highest antibacterial activity due to their smallest particle size (Fig. 5a). The antibacterial activity of AgNPs was collectively due to the ROS formation as well as Ag+ ions. S1 showed the highest amount of ROS (˙OH) than S3, which indicated that AgNPs having small particle size showed the highest amount of ROS formation (Fig. S3 in ESI†). Additionally, the effect of Ag+ ions was also studied. An equivalent amount of Ag salt was added to the bacterial solution, and only 64% bacterial inactivation was observed; this indicated that for bacterial inactivation, both AgNPs and Ag+ ions play important roles (Fig. S4 in ESI†).
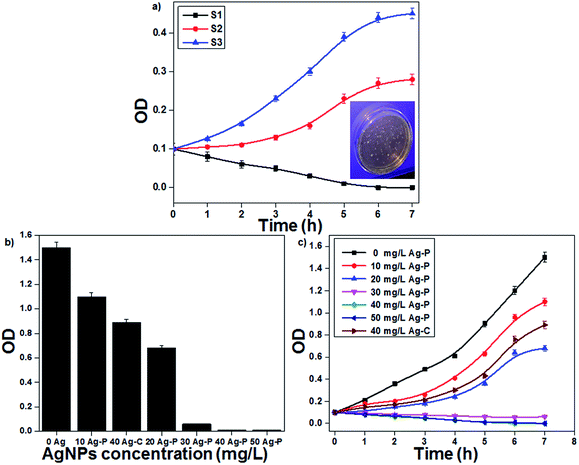 |
| | Fig. 5 (a) Growth curves of E. coli with AgNPs having different particle sizes. (b) MIC assay of the plasma-reduced AgNPs. (c) The effect of the concentration of AgNPs on E. coli growth curves (initial OD at 0.1). | |
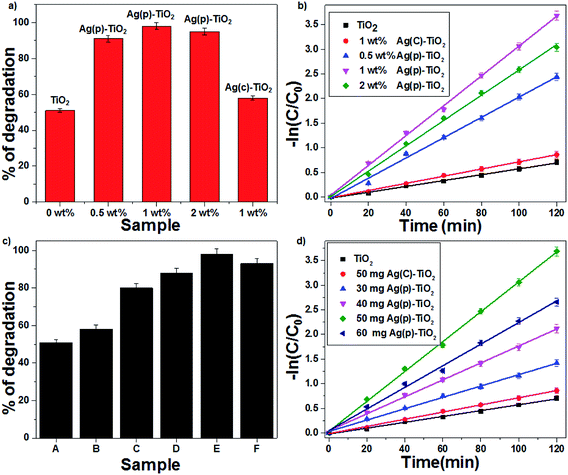 |
| | Fig. 6 The effect of the Ag-supported TiO2 catalyst on CV degradation: (a) % of degradation and (b) first-order kinetic plots. The effect of the amount of 1 wt% Ag–TiO2 catalyst on CV degradation: (c) % degradation (d) first order kinetic plots ((A) TiO2, (B) 50 mg Ag(C)–TiO2, (C) 30 mg Ag(P)–TiO2, (D) 40 mg Ag(P)–TiO2, (E) 50 mg Ag(P)–TiO2, and (F) 60 mg Ag(P)–TiO2). | |
Since the above-mentioned studies confirmed that sample S1 showed the best antibacterial activity, further experiments were continued with the same sample. The minimum inhibitory concentration (MIC) method was used to study the antibacterial effectiveness with different AgNP concentrations. AgNPs with concentrations ranging from 10 to 50 mg L−1 were added to the bacterial culture and then incubated for 12 h at 37 °C with a constant stirring rate of 200 rpm. The final bacterial concentration decreased with an increase in the AgNP concentration; when the concentration reached 40 mg L−1, E. coli growth was completely inhibited. In the present study, MIC of AgNPs to E. coli was 40 mg L−1 (Fig. 5b). To study the bacterial growth curve, the bacterial (E. coli) concentration was monitored every 1 h by optical density (OD) at 600 nm (Fig. 5c). It was found that the bacterial growth decreased continuously with an increase in the AgNP concentration. At a low concentration of AgNPs, bacterial growth was delayed; however, at a higher concentration, bacterial growth was completely inhibited. When the activity of plasma-reduced AgNPs was compared with that of the chemically reduced AgNPs, it was confirmed that the activity of Ag-P was better than that of Ag-C. The antimicrobial activity of AgNPs was investigated by many scientists against a broad range of microbes including bacteria, viruses and fungi. Nowadays, AgNPs are a well-established alternative to antibiotic therapy because of their significant potential for solving the problems associated with the development of multidrug resistance in microorganisms and hence, they are known as next-generation antibiotics.35,36
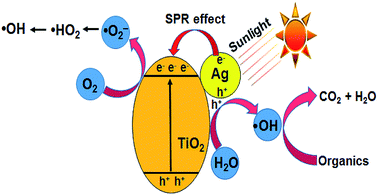 |
| | Fig. 7 Schematic diagram of the photocatalytic mechanism of the Ag–TiO2 catalyst. | |
3.6 Photocatalytic activity of plasma- and chemically reduced AgNPs
The photocatalytic degradation of CV was studied with TiO2 and Ag-supported TiO2 catalysts (0.5 wt% Ag(P)–TiO2, 1 wt% Ag(P)–TiO2, 2 wt% Ag(P)–TiO2 and 1 wt% Ag(C)–TiO2) with the optimum concentration of 1 g L−1; 1 wt% Ag(P)–TiO2 showed the best conversion (98%) (Fig. 6a). In the case of 2 wt% Ag–TiO2, an excess amount of Ag occupied more TiO2 surface and lowered the possibility of contact with O2,14 which may inhibit the electron transfer from TiO2 to O2 molecules, resulting in the decrease in catalytic activity. The degradation of organic dye followed first-order kinetics, and the rate constants (eqn (8)) were found to be 0.03, 0.025, 0.02, 0.007 and 0.005 min−1 for 1 wt% Ag(P)–TiO2, 2 wt% Ag(P)–TiO2, 0.5 wt% Ag(P)–TiO2, 1 wt% Ag(C)–TiO2 and pure TiO2 (Fig. 6b), respectively.
Since the results confirmed that 1 wt% Ag(P)–TiO2 catalyst showed the best photocatalytic activity, it was used for further experiments. A set of experiments were carried out by varying the catalyst (1 wt% Ag–TiO2) amount in the range of 30–60 mg; the activity data indicated that an increase in conversion was achieved with an increase in the catalyst concentration up to 1g L−1 and after that, the efficiency decreased (Fig. 6c). This can be explained in terms of active sites present on the catalyst surface for the photocatalytic reactions. A high amount of catalyst in solution increases the turbidity, which may decrease the interaction of light with the active sites present on the catalyst surface. The maximum degradation of CV was observed with 1 wt% Ag(P)–TiO2 at 1 g L−1 within 120 min under sunlight. As seen from Fig. 6d, the degradation of CV followed first-order kinetics, and the rate constants were found to be 0.005, 0.007, 0.0116, 0.017, 0.022 and 0.03 min−1 for pure TiO2, 50 mg Ag(C)–TiO2, 30 mg Ag(P)–TiO2, 40 mg Ag(P)–TiO2, 60 mg Ag(P)–TiO2, and 50 mg Ag(P)–TiO2, respectively. The effect of 1 wt% Ag(P)–TiO2 catalyst loading on the degradation of CV highlighted the better performance of the plasma-reduced Ag-P catalyst than that of chemically reduced Ag-C with the same amount of the catalyst. A plausible mechanism for the degradation of CV is shown in Fig. S5 in the ESI.† The degradation of CV dye may occur through the attack of ˙OH on the central carbon of CV via the conjugated structure of aminotriphenylmethane to produce intermediates, which are further oxidized to CO2 and H2O (mineralization products).37 The extent of mineralization was achieved up to 56% with the highly active 1 wt% Ag(P)–TiO2 catalyst, and it also showed the best conversion (98%), which decreased to 61% in the presence of isopropyl alcohol (hydroxyl scavenger). The complete degradation of CV was achieved within 70 min in the presence of FeCl2, which may be due to the formation of ˙OH via Fenton reactions, which readily oxidizes CV (eqn (9))
| | |
Fe2+ + H2O2 → ˙OH + OH− + Fe3+
| (9) |
TiO2 is a proven photocatalyst, which has a wide band gap of 3.2 eV. Accordingly, the modification of TiO2 with noble metal nanoparticles such as Ag or Au shifts its absorption edge to the visible region (<3.2 eV). Since the experiments are conducted with commercial TiO2 under open sunlight, the observed activity is explained based on the combined effect of TiO2 and AgNPs impregnated on TiO2. During the photo-excitation of AgNPs under sunlight, the electrons below the Fermi level (Ef) of AgNPs are excited to the surface plasmon states, leaving positive charges (h+) below Ef.38–40 The interaction of holes with water molecules leads to the formation of ˙OH (eqn (10) and (11)). The electrons are transferred to the conduction band of TiO2, which minimizes electron–hole recombination (eqn (12)) and provides more electrons for the reduction of molecular oxygen to superoxide anion radicals (˙O2−), the protonation of which gives ˙HO2 radicals (eqn (13) and (14)). The reduction of ˙HO2 yields H2O2 species, which undergo decomposition to form ˙OH radicals (eqn (15) and (16)) (Fig. 7).41 The ˙OH radical has an oxidation potential of 2.8 V, which is sufficient to oxidize a wide range of organic compounds including CV (eqn (17)). The photocatalytic activity of pure Ag(P) or Ag(C) is negligible due to rapid electron–hole recombination.
| | |
e− + TiO2 → TiO2(e−)
| (12) |
| | |
TiO2(e−) + O2 → TiO2 + ˙O2−
| (13) |
| | |
˙HO2 + ˙HO2 → H2O2 + O2
| (15) |
| | |
˙OH + CV → degraded products
| (17) |
3.7 Identification of reactive oxygen species
The ROS such as H2O2 and ˙OH formed during photocatalysis were identified using the titanium sulfate and chemical dosimetry method. The reactive oxygen species were identified in a solution containing 50 mg of catalyst (1 wt% Ag(P)–TiO2) and in the absence of CV dye. H2O2 reacted with titanium sulfate to give yellow-colored pertitanic acid, which showed a maximum absorbance at 420 nm, as shown in Fig. 8a. The ˙OH radicals formed during photocatalysis may react with TA to form HTA, which showed an emission at 425 nm (Fig. 8b).23 The formation of active species was also compared with that of the chemically reduced catalyst 1 wt% Ag(C)–TiO2, and the plasma-reduced catalyst 1 wt% Ag(P)–TiO2 showed the highest active species formation.
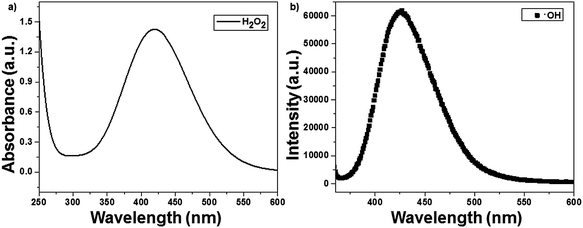 |
| | Fig. 8 Identification of reactive oxygen species with 1 wt% Ag(P)–TiO2 catalyst: (a) H2O2 and (b) ˙OH. | |
4. Conclusions
Highly dispersed colloidal silver nanoparticles (AgNPs) were synthesized using an atmospheric pressure plasma jet under ambient conditions. Reducing species such as ˙H and eaq− were identified via optical emission spectroscopy (OES) and Goodman's method. It was observed that the pH of the AgNO3-containing solution decreased during the plasma treatment, which indicated the reduction of Ag+ ions. The formation of colloidal AgNPs was confirmed by surface plasmon resonance (SPR) bands using ultraviolet-visible and fluorescence spectroscopies, and TEM images confirmed the spherical morphology of the plasma-reduced Ag nanoparticles. The size of the colloidal AgNPs was tuned by adjusting the AgNO3 initial concentration. The addition of ˙OH scavenger TA to the solution decreased the treatment time for Ag+ reduction. The typical activity tests confirmed that the plasma-reduced AgNPs (Ag-P) showed superior antibacterial and photocatalytic activities than the chemically reduced AgNPs (Ag-C). Interestingly the plasma-reduced AgNPs were stable even after 30 days, whereas the chemically reduced AgNPs agglomerated within 12 h. The extent of mineralization achieved was up to 56% with the highly active 1 wt% Ag(P)–TiO2 catalyst. The hydroxyl scavenger isopropyl alcohol showed a negative effect on CV degradation, whereas Fe2+ salts played a positive role in CV degradation.
Conflicts of interest
There are no conflicts to declare.
Acknowledgements
Authors would like to thank MHRD, India for the financial assistance.
References
- K. M. A. El-Nour, A. A. Eftaiha, A. Al-Warthan and R. A. Ammar, Arabian J. Chem., 2010, 3, 135–140 CrossRef.
- H. Gu, P. L. Ho, E. Tong, L. Wang and B. Xu, Nano Lett., 2003, 3, 1261–1263 CrossRef.
- J. M. Köhler, L. Abahmane, J. Wagner, J. Albert and G. Mayer, Chem. Eng. Sci., 2008, 63, 5048–5055 CrossRef.
- M. De, P. S. Ghosh and V. M. Rotello, Adv. Mater., 2008, 20, 4225–4241 CrossRef.
- A. A. Kajani, A. K. Bordbar, S. H. Z. Esfahani, A. R. Khosropour and A. Razmjou, RSC Adv., 2014, 4, 61394–61403 RSC.
- Q. H. Tran and A. T. Le, Adv. Nat. Sci.: Nanosci. Nanotechnol., 2013, 4, 033001 Search PubMed.
- T. V. Duncan, J. Colloid Interface Sci., 2011, 363, 1–24 CrossRef PubMed.
- Y. Cai, X. Piao, W. Gao, Z. Zhang, E. Nie and Z. Sun, RSC Adv., 2017, 7, 34041–34048 RSC.
- A. Panáček, M. Kolář, R. Večeřová, R. Prucek, J. Soukupová, V. Kryštof and L. Kvítek, Biomaterials, 2009, 30, 6333–6340 CrossRef PubMed.
- S. Chernousova and M. Epple, Angew. Chem., Int. Ed., 2013, 52, 1636–1653 CrossRef PubMed.
- J. Y. Kim, S. E. Kim, J. E. Kim, J. C. Lee and J. Y. Yoon, J. Korean Soc. Environ. Eng., 2005, 27, 771–776 Search PubMed.
- F. Gao, Y. Yang and T. Wang, Chem. Eng. J., 2015, 270, 418–427 CrossRef.
- R. Kaur and B. Pal, New J. Chem., 2015, 39, 5966–5976 RSC.
- Z. Zheng, B. Huang, X. Qin, X. Zhang, Y. Dai and M. H. Whangbo, J. Mater. Chem., 2011, 21, 9079–9087 RSC.
- P. Korshed, L. Li, Z. Liu and T. Wang, PLoS One, 2016, 11, e0160078 CrossRef PubMed.
- Z. Tang, S. Liu, S. Dong and E. Wang, J. Electroanal. Chem., 2001, 502, 146–151 CrossRef.
- B. Soroushian, I. Lampre, J. Belloni and M. Mostafavi, Radiat. Phys. Chem., 2005, 72, 111–118 CrossRef.
- M. G. Guzmán, J. Dille and S. Godet, Int. J. Chem. Biol. Eng., 2009, 2, 104–111 Search PubMed.
- T. A. Kareem and A. A. Kaliani, Ionics, 2012, 18, 315–327 CrossRef.
- N. A. Samoilova, I. V. Blagodatskikh, E. A. Kurskaya, M. A. Krayukhina, O. V. Vyshivannaya, S. S. Abramchuk and I. A. Yamskov, Colloid J., 2013, 75, 409–420 CrossRef.
- V. G. Pol, H. Grisaru and A. Gedanken, Langmuir, 2005, 21, 3635–3640 CrossRef PubMed.
- X. Liang, Z. J. Wang and C. J. Liu, Nanoscale Res. Lett., 2009, 5, 124 CrossRef PubMed.
- L. Chandana and C. Subrahmanyam, Chem. Eng. J., 2017, 329, 211–219 CrossRef.
- J. He, I. Ichinose, T. Kunitake and A. Nakao, Langmuir, 2002, 18, 10005–10010 CrossRef.
- S. S. Kim, H. Lee, B. K. Na and H. K. Song, Catal. Today, 2004, 89, 193–200 CrossRef.
- L. Chandana, P. M. K. Reddy and C. Subrahmanyam, Chem. Eng. J., 2015, 282, 116–122 CrossRef.
- D. Ray and C. Subrahmanyam, RSC Adv., 2016, 6, 39492–39499 RSC.
- L. Mulfinger, S. D. Solomon, M. Bahadory, A. V. Jeyarajasingam, S. A. Rutkowsky and C. Boritz, J. Chem. Educ., 2007, 84, 322 CrossRef.
- L. Chandana and C. Subrahmanyam, J. Environ. Chem. Eng., 2016, 6, 3780–3786 CrossRef.
- H. O. L. Li, J. Kang, K. Urashima and N. Saito, J. Inst. Electrostat. Jpn, 2013, 37, 22–27 Search PubMed.
- N. Shirai, S. Uchida and F. Tochikubo, Jpn. J. Appl. Phys., 2014, 53, 046202 CrossRef.
- F. U. Khan, Y. Chen, N. U. Khan, Z. U. H. Khan, A. U. Khan, A. Ahmad and P. Wan, J. Photochem. Photobiol., B, 2016, 164, 344–351 CrossRef PubMed.
- R. Desai, V. Mankad, S. K. Gupta and P. K. Jha, Nanosci. Nanotechnol. Lett., 2012, 4, 30–34 CrossRef.
- Y. Sun and Y. Xia, Science, 2002, 298, 2176–2179 CrossRef PubMed.
- M. K. Rai, S. D. Deshmukh, A. P. Ingle and A. K. Gaade, J. Appl. Microbiol., 2012, 112, 841–852 CrossRef PubMed.
- C. Malarkodi, S. Rajeshkumar, K. Paulkumar, G. Gnanajobitha, M. Vanaja and G. Annadurai, Advances in Nano Research, 2013, 1, 83–91 CrossRef.
- Y. H. B. Liao, J. X. Wang, J. S. Lin, W. H. Chung, W. Y. Lin and C. C. Chen, Catal. Today, 2011, 174, 148–159 CrossRef.
- K. H. Leong, B. L. Gan, S. Ibrahim and P. Saravanan, Appl. Surf. Sci., 2014, 319, 128–135 CrossRef.
- M. Z. Ge, C. Y. Cao, S. H. Li, Y. X. Tang, L. N. Wang, N. Qi and Y. K. Lai, Nanoscale, 2016, 8, 5226–5234 RSC.
- H. Wang, X. Yang, J. Zi, M. Zhou, Z. Ye, J. Li and Y. Yan, J. Ind. Eng. Chem., 2016, 35, 83–92 CrossRef.
- M. Pelaez, N. T. Nolan, S. C. Pillai, M. K. Seery, P. Falaras, A. G. Kontos and M. H. Entezari, Appl. Catal., B, 2012, 125, 331–349 CrossRef.
Footnote |
| † Electronic supplementary information (ESI) available. See DOI: 10.1039/c8ra03961e |
|
| This journal is © The Royal Society of Chemistry 2018 |
Click here to see how this site uses Cookies. View our privacy policy here.  Open Access Article
 *a
*a
![[thin space (1/6-em)]](https://www.rsc.org/images/entities/char_2009.gif) k = 3.3 × 10¹⁰
k = 3.3 × 10¹⁰
![[thin space (1/6-em)]](https://www.rsc.org/images/entities/char_2009.gif) k = 2.2 × 10¹⁰
k = 2.2 × 10¹⁰
![[thin space (1/6-em)]](https://www.rsc.org/images/entities/char_2009.gif) cos
cos![[thin space (1/6-em)]](https://www.rsc.org/images/entities/char_2009.gif) θ
θ


