DOI:
10.1039/D2SU00104G
(Paper)
RSC Sustain., 2023,
1, 523-534
Co3O4 quantum dot decorated polypyrrole nanocomposites as a flexible, conducting, anticorrosive and antibacterial agent: sustainable experimental and theoretical approach†
Received
18th November 2022
, Accepted 26th February 2023
First published on 28th February 2023
Abstract
Self-assembled cobalt oxide quantum dots (QDs) were prepared by the inverse micelle technique. Polypyrrole (PPy) was synthesized by the chemical-oxidative method. Co3O4 QD-based PPy nanocomposites (NCs) were prepared by an in situ method. The Co3O4 QDs, PPy, and Co3O4@PPy NCs were characterized by TEM, FTIR, X-ray diffraction, and UV-visible techniques. The size of Co3O4 QDs, PPy, and Co3O4@PPy NCs was obtained by powder XRD and TEM methods. Computational (DFT) and adsorption (Langmuir and Henry) studies were carried out to support experimental data. Co3O4@PPy NCs show a maximum of 81.58% protection to mild steel in an acidic medium. The antibacterial activity of Co3O4@PPy NCs was comparable to that of Hexa disk (standard antibiotics). The Co3O4@PPy NCs were proven to be flexible, conducting, corrosion inhibiting, and possess antibacterial properties. The NCs find applications in soft electronics, the pharmaceutical industry, corrosion inhibitors for metals and their alloys, and flexible (moldable) display devices for sustainable developments.
Sustainability spotlight
This manuscript entitled “Co3O4 quantum dots decorated polypyrrole nanocomposites as a flexible, conducting, anticorrosive and antibacterial agent: sustainable experimental and theoretical approach” describes a study pertaining to different approaches toward greener synthesis, and novel application of conducting polymer-based nanocomposites towards conducting, protective, antibacterial, and energy efficient nanomaterials for the sustainable development of the society. It will prove beneficial for the researchers working in the fields of quantum dot decorated conducting polymers, nanocomposites, computational chemistry, protecting the surface of metals and their alloys from corrosion, and antibacterial activity. This paper provides scientific advancements made in the field of conducting polymer-based nanocomposites and will prove highly beneficial in designing new nanomaterials with a wide range of applications such as protecting the surface of metals from corrosion, highly conducting energy efficient devices and a healthy life. Emphasis has been given to understanding the nature and mechanism of action of nanocomposites in preventing corrosion of metals and their alloys both by theoretical and experimental techniques. This study provides new insights into the discovery of new nanomaterials as acid corrosion inhibitors for protecting the surface of metals (protecting our environment, minimizing losses due to corrosion), conducting flexible nanomaterials (energy efficient nanomaterials), and antibacterial agents (healthy disease-free life). We believe that our finding advances the understanding of the synthesis, designing, characterization, and application study of conducting polymer-based nanocomposites both by experimental and theoretical techniques at room temperature.
|
1. Introduction
Self-assembled quantum dots (QDs), conducting polymers (CPs) such as polypyrrole (PPy), and their nanocomposites (NCs) can change the world due to their unique properties like flexibility, conductivity, mechanical strength, porous nature, etc.1–3 QDs find applications in different fields, that is, sensing (chemical, biological, piezoelectric, and optical sensors), energy harvesting devices (super and hybrid capacitors, rechargeable batteries), phosphor nanomaterials, semiconducting devices, MEMs (micro-electronic mechanical devices), transistors, diodes, photo-anodes, etc.4–9 The optical, electrical, mechanical, and chemical properties of QDs depend largely on the particle size, nature of the transition metal (1st, 2nd, and 3rd-row transition series), and synthetic conditions such as heating temperature, nucleation and seedling time, etc.8–10 CPs such as PPy have emerged as important nanomaterials over the last few decades owing to their unmatched properties such as good conductivity, high surface area to volume ratio, high environmental stability, flexibility, and fibrous (thread-like) structure. QDs when combined with CPs may result in synergistic effects in their properties. QDs@PPy NCs may find applications in different fields such as energy harvesting devices, hybrid and super-capacitors, sensors, purification (due to its porous and fibrous nature), and adsorption science.10–12 Au nanoparticle-based PANI NCs were investigated as photocatalysts for the degradation of organic dyes.1 CP-based NCs were tested as anode electrodes in amperometric sensors.2 Fe2O3-based PANI NCs were found to have magnetic properties with high magnetic moments.3 Another research group has reported the photocatalytic activity of zinc oxide copolymer-based NCs.4 Wang et al. have investigated ZnO/WO4 NCs as a photocatalytic material,5 Jiang et al. have investigated ZnO/WO4 NCs as a photocatalytic and photo-luminescent material,6 Yosefi and Haghighi have reported p-NiO/p-BiO NCs as a photocatalytic material under visible light,7 Anitha et al. have reported the NiO/CdO composite as an antibacterial and photo-conducting material,8 Kumar et al. have studied CuO/ZnO/NiO@rGO NCs as an optoelectronic and corrosion retarding nanomaterial,9 Kumar et al. have reported CuO/NiO/ZnO@PANI NCs as a fire retarding and anticorrosive nanomaterial,10 Zhang et al. have investigated CoO/Co3O4 NC array sheets for hybrid super-capacitors for ultra-high performance,11 Ren et al. have reported Co@PANI NCs as a hierarchical nanocage structure for use in super-capacitors,12 and Ma et al. have investigated CoO@PPy nanorod arrays for tailorable super-capacitors.13 Monfarad and Jamshidi have investigated TiO2/PANI NCs as a photocatalyst used in paints for the elimination of benzene in visible light.14 Zhang et al. reported the photocatalytic properties of TiO2@ PANI NCs for the degradation of organic dyes after 60 h of ultraviolet irradiation,15 and Sarmath and Kumar investigated the photocatalytic application of TiO2/PANI NCs for Malachite Green (MG) dye in UV light.16 Nerkar et al. studied ZnO/PANI NCs for the purification of impure water by the degradation of MO dye from untreated water.17
In connection with earlier work,9,10,18–21 here we focus on the synthesis, and novel applications of Co3O4 QDs, PPy CPs, and Co3O4@PPy NCs. Experimental, computational (DFT), and adsorption (Langmuir and Henry) techniques were used to support our results. First time we are reporting Co3O4@PPy NCs as flexible, conducting, antibacterial, and anticorrosive material. Dilute HCl is used in different industrial applications such as acidification of oils, acid cleaning, acid pickling, processing of minerals and ores, the metallurgical process of CaCl2, food processing, etc. Thats why we selected HCl acid as corroding medium. Mild steel is widely used in industry for making bodies of water tanks, grain tanks, trunks, railway compartments, bodies of ships, engine parts, etc. The mechanism of corrosion inhibition against mild steel and antibacterial activity was investigated in detail. This paper will open new dimensions in the field of QDs and PPy-based nanocomposites for multifunctional applications and sustainable developments.
2. Materials and methods
CuCl2·6H2O (98%) was obtained from Sigma-Aldrich. Hydrochloric acid (37%) was obtained from Merck Sci. Ltd. NH2NH2·H2O (98%) was procured from Sigma Aldrich. Hexa G-plus 6 disk (HX022-1PK) was procured from Hi-Media Ltd. The six standard antibiotics present in Hexa disk were: TE-25 (Tetracycline 25 mcg), C-25 (Chloramphenicol 25 mcg), P-1 (Penicillin-G), AMP-10 (Ampicillin 10 mcg), S-10 (Streptomycin 10 mcg) and S3-300 (Sulphatrid 300 mcg). The mild steel (IS-2062-Fe-350 grade) was obtained from the steel market of Sirsa (Haryana). The composition of MS used in corrosion experiments is: C = 0.19; Si = 0.35; P = 0.2; Ni = 0.01; S = 0.05; Mn = 0.42; Cu = 0.01; Cr = 0.01% and Fe = rest. Double distilled water (conductivity, K = 1.01 μS m−1) was used for making solutions and washing purposes.
2.1 Synthesis of Co3O4 QDs
The inverse micelle method was used for the synthesis of Co3O4 QDs. 100 ml solution of 0.5 M CoCl2·6H2O was prepared in acidified water (0.1 M HCl). A 100 ml binary mixture of cyclohexane and water was prepared in a ratio of 1![[thin space (1/6-em)]](https://www.rsc.org/images/entities/char_2009.gif) :9. 1% PVP and Triton-X-100 surfactant were added to this binary mixture to homogenize it. This binary mixture containing PVP and Triton-X-100 was slowly added to CoCl2 solution with continuous stirring. NH2NH2·H2O was slowly added to this reaction mixture followed by tetrahydrofuran (THF) to completely break down the inverse micelle. The resulting precipitate was repeatedly washed with water and acetone and then dried for 12 h in an electric oven maintained at 100 °C.
:9. 1% PVP and Triton-X-100 surfactant were added to this binary mixture to homogenize it. This binary mixture containing PVP and Triton-X-100 was slowly added to CoCl2 solution with continuous stirring. NH2NH2·H2O was slowly added to this reaction mixture followed by tetrahydrofuran (THF) to completely break down the inverse micelle. The resulting precipitate was repeatedly washed with water and acetone and then dried for 12 h in an electric oven maintained at 100 °C.
2.2 Synthesis of CPs, PPy
50 ml of aniline monomer was used as a precursor for initiating polymerization in the presence of sodium-lauryl-sulfate (SLS) and acidified iron chloride (an oxidant) with continuous stirring at 600 rpm. In 50 ml aniline, 1.0 M solution of SLS and FeCl3 was added dropwise with continuous stirring at 600 rpm. The reaction temperature was kept at 4 °C by keeping the reaction mixture on a crushed ice bath. The gel formed was monitored for 6 h. Double distilled water, 1.0 M HCl and C2H5OH solvent were used successively for washing the products. The product obtained was dried in a vacuum oven maintained at a constant temperature of 70 °C for 12 h. The product was stored in a desiccator supported over silica gel.
2.3
In situ synthesis of Co3O4@PPy NCs
Co3O4 metal QDs synthesized by the inverse micelle technique were added in a 1:2 molar ratio in the pyrrole monomer solution. Chemical oxidative polymerization of PPy CPs was carried out in the presence of Co3O4 QDs. The temperature of the reaction mixture was set at 4 °C. The surfactant SLS and oxidant AlCl3 were added to initiate the polymerization process. The products obtained were washed and dried in a vacuum oven.
The gravimetric experiments for the corrosion study were performed in 0.1 M hydrochloric acid in the presence of 100 to 1000 ppm concentrations of Co3O4@PPy NCs. MS sheets were polished mechanically using sandpaper (150 to 800 grade).22,23 The American standard test method (ASTM-D-2688) was adopted to estimate the corrosion rate (CR).24 The MS specimens after mechanical polishing were exposed to 0.1 M HCl solution for 24 h. After 24 h, the MS specimens were washed initially with tap water, dried, and then wiped with acetone. Easily removable corrosion products were removed with a rubber cork. The difference in the initial and final weights of the MS before and after exposure to the corroding solution was accurately weighed. The inhibition efficiency (IE) to prevent corrosion was found using CR(blank) and CR(inhibitor).25,26 The electrochemical polarization experiments were carried out using a PGSTAT 128N Autolab Potentiostat/Galvanostat. The Nova 1.2 software was used to run the electrochemical polarization experiments in anodic and cathodic directions. The open circuit potential (OCP) was measured before initiating the polarization experiments. The coating thickness and pore length were measured using Meta Plus software provided with a Getner, Japan metallurgical microscope.
The optical band gap (direct and indirect) was obtained from Tauc plots (Fig. S2, ESI†). The absorbance of QDs, PPy, and NCs was obtained from a Shimadzu UV-2600 spectrophotometer, Japan. The QDs, PPy and NCs were dispersed in ethanol for 30 min with the help of an ultrasonic bath before measuring the absorbance in the UV-visible spectrophotometer.
The direct and indirect bandgaps of Co3O4 QDs, PPy and Co3O4@PPy NCs (Fig. S2, ESI†) were obtained from Tauc plots, eqn (1).
The absorption coefficient (α) was obtained from the Lambert–Beer law. The value of n is ½ for the indirect band gap and 2 for the direct band gap. A linear relationship between (αhν)1/2 and hν (indirect band gap) and (αhν)2 and hν (direct band gap) was observed for Co3O4 QDs, PPy and Co3O4@PPy NCs.
FTIR spectra were obtained using the Bruker alpha model, Germany.
An antibacterial study of Co3O4@PPy NCs was carried out against Escherichia coli (Gram-negative) and Staphylococcus epidermidis (Gram-positive) using the Agar-Well-Assay technique.27–29 The bacterial cultures of E. coli and S. epidermidis microorganisms were grown in a Petri dish kept in a laminar flow chamber. A metal steel borer was used for creating well in the culture for the addition of different concentrations of NCs. The Zone of Inhibition (ZoI) was observed for both Gram +ve and −ve bacteria. Hexa disc (standard antibiotics) was selected as a reference for Co3O4@PPy NCs.
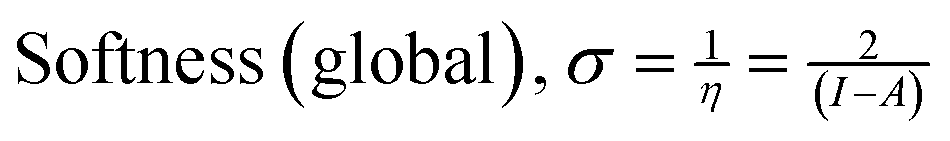
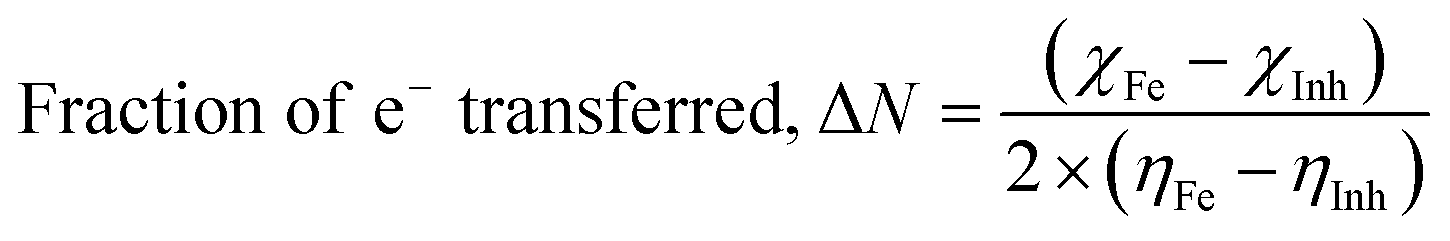
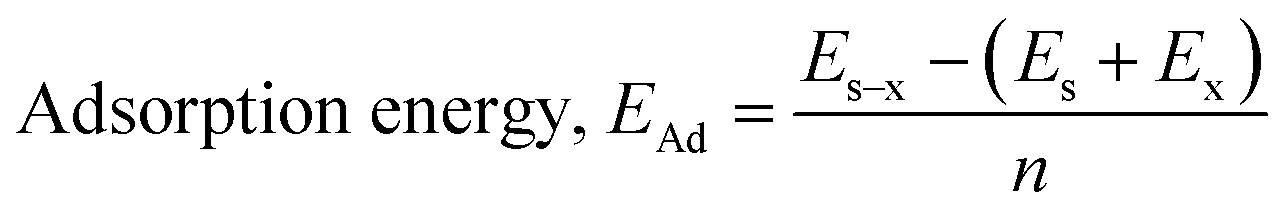
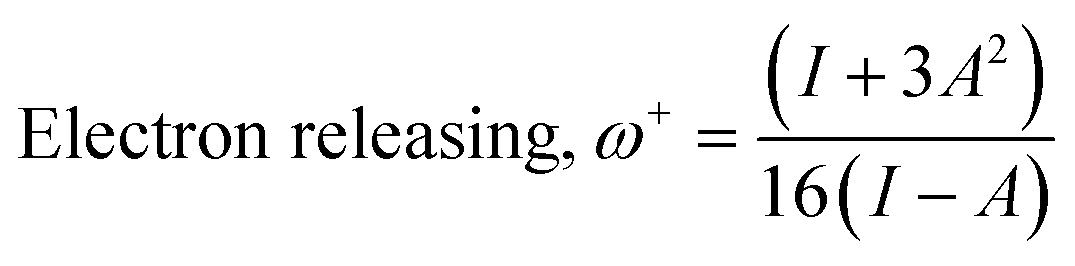
The theoretical (DFT) technique was used on Co3O4@PPy NCs with Gauss View 5.0 and Gaussian-09W.30–32Table 1 depicts Mulliken atomic charges of Co3O4@PPy NCs. Table 2 depicts α occupied and α unoccupied MO coefficients of Co3O4@PPy NCs. Table 3 depicts computational parameters for Co3O4@PPy NCs observed from Gaussian 09W. The basis set selected was B3LYP and the functional was 6-311G(+)(d,p). The structure of Co3O4@PPy NCs was drawn with the help of Gauss view 5.0 software. The minimum energy, optimization and frequency study was carried out for Co3O4@PPy NCs by Gaussian-09W. Table 4 depicts DFT data for Co3O4@PPy NCs. Fig. 1 displays the structure of PPy, EDD of PPy, and van der Waals surface of PPy. Fig. 2 displays the structure of PPy, and LUMO, and HOMO of PPy. The spectral, structural, interaction, chemical, and thermodynamic parameters were obtained using eqn (2)–(13).33–37
| |  | (2) |
| |  | (3) |
| |  | (4) |
| |  | (5) |
| |  | (6) |
| |  | (7) |
| |  | (8) |
| |  | (9) |
| |  | (10) |
| |  | (11) |
| |  | (12) |
| | | Proton affinity, PA = Epro − (Enon pro + EH+) | (13) |
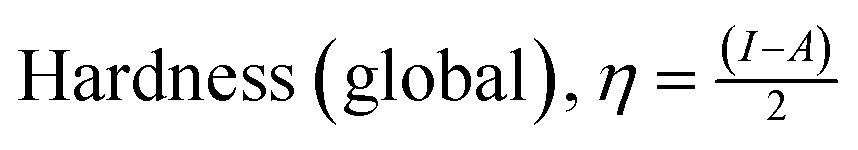
Table 1 DFT parameters for Co3O4@PPy NCs at STP. Basis set: B3LYP, functional: 6-311G(+)(d,p)a
|
E
HUMO (−eV) |
E
LUMO (−eV) |
ΔE (eV) |
I (eV) |
A (eV) |
χ (eV) |
η (eV) |
σ (eV−1) |
ΔN (eV) |
E
Ad (kJ mol−1) |
ω (au) |
ω
+ (au) |
ω
− (au) |
ΔΨ (−eV) |
PA (eV) |
|
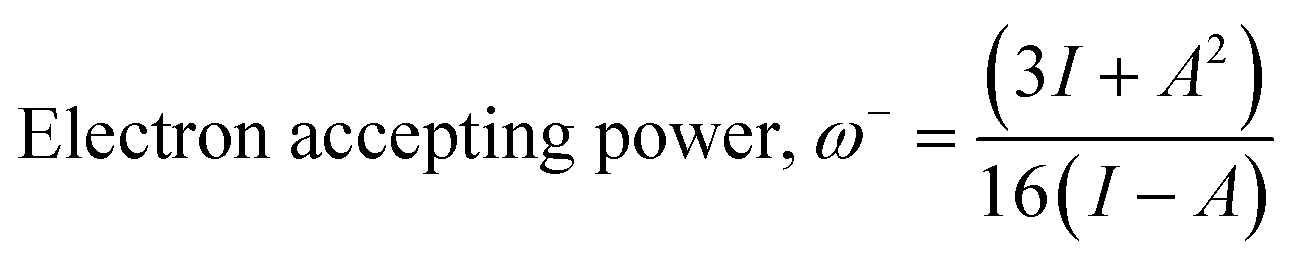
Abbreviations; ΔE: energy difference, I: ionization energy, A: electron affinity, χ: electrochemical potential, η: global hardness, ΔN: max. charge transfer, EAd: adsorption energy, ω: electrophilicity, ω+ and ω−: electron accepting and donating power, ΔΨ: metal NC interaction energy, PA: proton affinity.
|
| 5.453 |
3.023 |
2.43 |
5.453 |
3.023 |
4.238 |
1.215 |
0.823 |
1.744 |
6.72 |
4.12 × 10⁻⁵ |
0.845 |
0.656 |
0.512 |
−0.211 |
Table 2 Thermochemical parameters for Co3O4@PPy NCs at STP obtained from the Gaussian frequency study. Basis set: B3LYP, functional: 6-311G(+), polarizability and diffusion (d,p)
| Nuclear repulsive energy (Hartree) |
Rotational constants (GHz) |
Dipole moment (D) |
Quadrupole moment (xy axis) |
KE of symmetry A′ |
KE of symmetry A′′ |
Molecular mass (amu) |
Internal energy, E (thermal, kcal mol−1) |
Heat capacity, CV (cal mol−1 K−1) |
Entropy, S (cal mol−1 K−1) |
Zero-point vibrational energy (kcal mol−1) |
Thermal correction to E (Hartree per particle) |
Thermal correction to enthalpy, H (Hartree per particle) |
Thermal correction to G (Hartree per particle) |
| 356.47 |
4.7485 |
0.0013 |
−31.64 |
1.012 × 10³ |
4.112 × 101 |
108.07 |
83.35 |
24.857 |
73.83 |
137.27 |
0.2612 |
0.2216 |
0.1673 |
Table 3 Weight loss, CR, and IE (%) of Co3O4@PPy NCs at different concentrations by the gravimetric method at 25 °C in 0.1 M HCl
| Concentration (ppm) |
Average weight loss (mg) |
Standard deviation (σd) |
Precision in weight measurement |
Corrosion rate (mpy) |
IE (%) |
θ
|
| Blank |
55.4 |
0.1 |
55.4 ± 0.1 |
1105.51 |
— |
— |
| 100 |
35.3 |
0.2 |
35.3 ± 0.2 |
704.41 |
36.28 |
0.36 |
| 200 |
22.7 |
0.1 |
22.7 ± 0.1 |
452.98 |
59.02 |
0.59 |
| 400 |
17.1 |
0.2 |
17.1 ± 0.2 |
341.23 |
69.13 |
0.69 |
| 600 |
13.6 |
0.1 |
13.6 ± 0.2 |
271.39 |
75.45 |
0.75 |
| 800 |
11.4 |
0.1 |
11.4 ± 0.1 |
227.48 |
79.42 |
0.79 |
| 1000 |
10.2 |
0.1 |
10.2 ± 0.1 |
203.54 |
81.58 |
0.81 |
Table 4 Coating thickness, percentage porosity, and pore length (PL) of blank and Co3O4@PPy NC treated MS coupons
| Concentration (ppm) |
Coating thickness (μm) |
Percentage porosity |
Pore length (μm) |
| Blank |
43.6 |
92.54 |
191.6 |
| 100 |
51.3 |
71.5 |
164.5 |
| 200 |
78.4 |
57.6 |
137.4 |
| 400 |
85.7 |
41.4 |
92.8 |
| 600 |
115.5 |
34.7 |
73.6 |
| 800 |
143.6 |
28.6 |
53.5 |
| 1000 |
161.2 |
14.9 |
11.7 |
 |
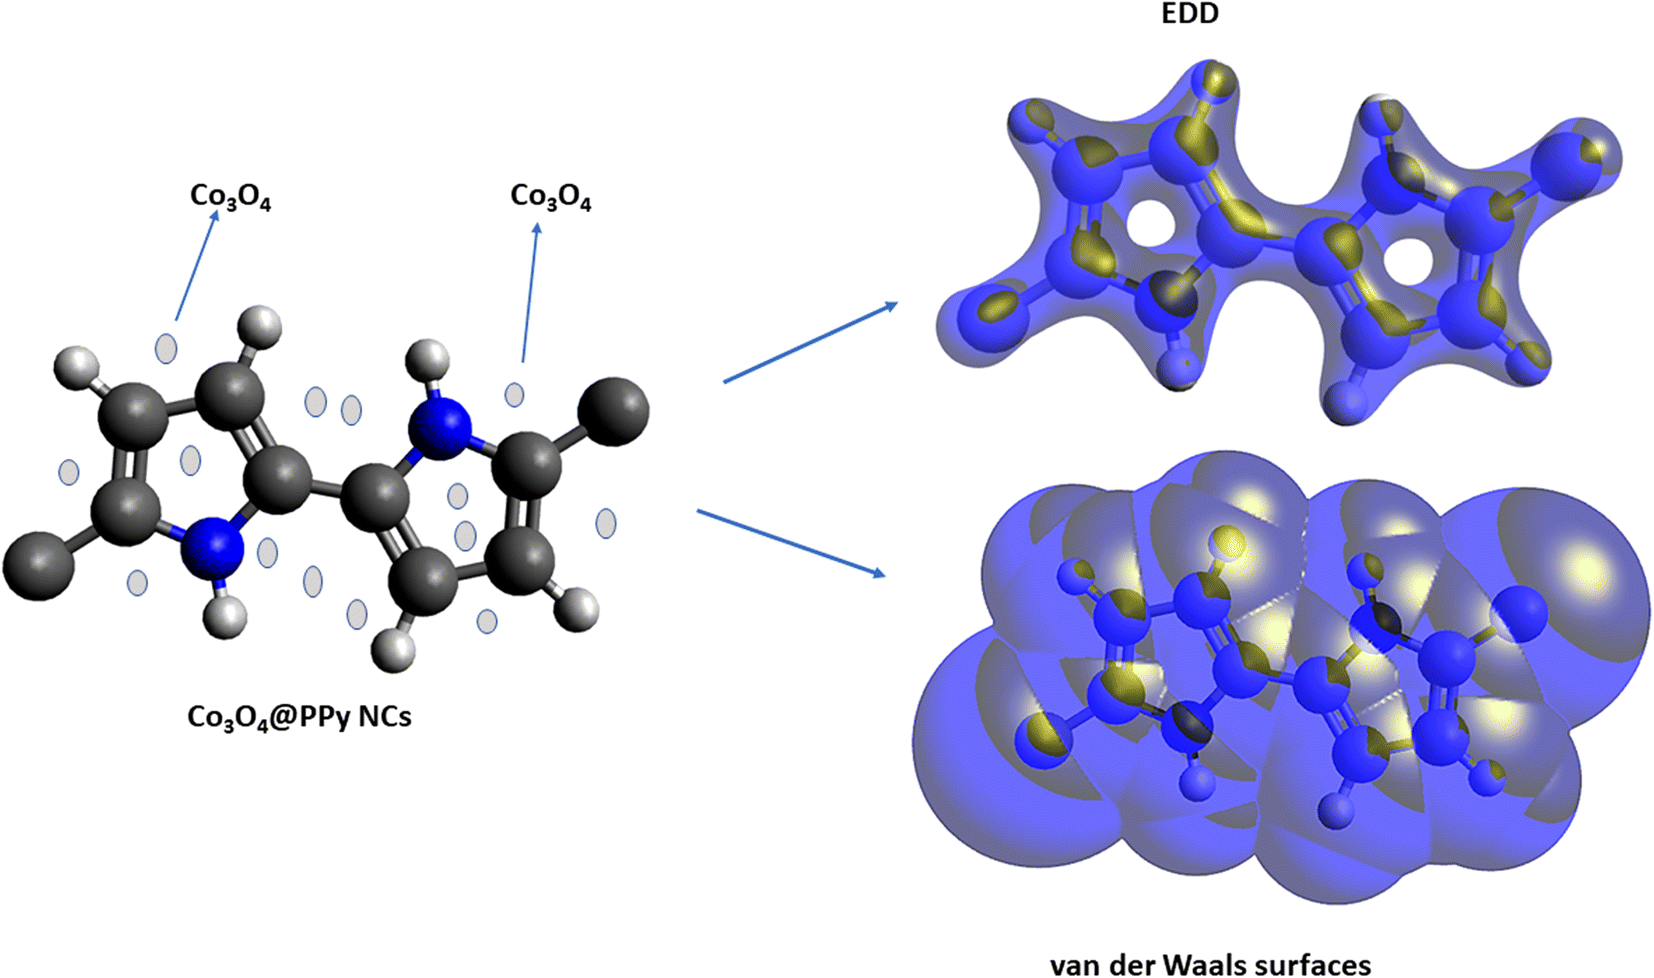
| | Fig. 1 PPy NCs, electron density distribution (EDD), and van der Waals surfaces of Co3O4@PPy NCs. | |
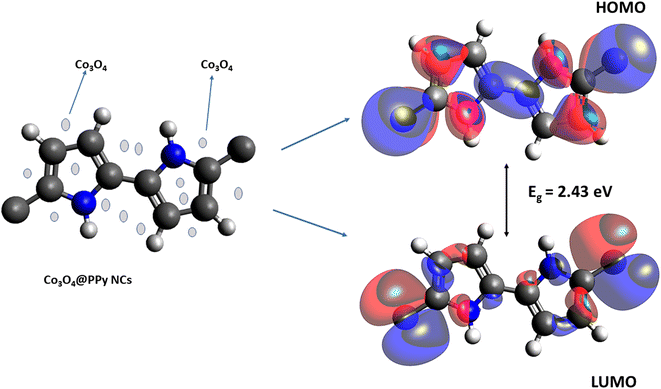 |
| | Fig. 2 PPy NCs, LUMO, and HOMO of Co3O4@PPy NCs. | |
3. Results and discussion
The optical study of QDs, PPy, and Co3O4@PPy NCs helps in evaluating the band gap, Eg (direct and indirect). p-XRD, TEM, FT-IR, and metallurgical microscopy give information about nanomaterials such as their size, shape, structure, surface defects, functional group, donor and acceptor sites, etc. This information helps in the understanding and identification of new corrosion inhibitors for metals and their alloys. Surface studies like TEM and metallurgical microscopy help in understanding the nature of corrosion.
Fig. S1 (ESI†) displays UV-visible absorption spectra of Co3O4 QDs, PPy, and Co3O4@PPy NCs. Fig. S2 (ESI†) depicts the Tauc plots (indirect and direct) for Co3O4@PPy NCs. The Tauc plots were used to calculate the indirect and direct band gap (Eg). The Tauc relationship is given in eqn (1).
The absorption was observed at 339.6 nm in Co3O4 QDs (Fig. S1†). The direct and indirect band gaps (Eg) of Co3O4 QDs obtained from the Tauc plot were 2.3 and 2.7 eV, respectively (Fig. S2†). PPy shows absorption peak at 329.4 nm. The direct and indirect band gaps of PPy were 3.07 and 3.1 eV, respectively (Fig. S2†). The maximum absorption for Co3O4@PPy NCs (Fig. S1(C)†) was seen at 327.1 nm. The corresponding direct and indirect band gaps of Co3O4@PPy NCs were 2.6 and 2.55 eV, respectively. Hence, a slight decrease in both direct and indirect band gaps was observed as we moved from PPy to Co3O4@PPy NCs. It will result in an increase in the electrical conductivity of Co3O4@PPy NCs by the inclusion of Co3O4 QDs.
Fig. S3(A)† shows the FT-IR spectra of Co3O4 QDs. The absorption peaks observed in the fingerprint region at 561.4 cm−1 were due to Co–O stretching vibrations. The peak observed at 660 cm−1 represents tetrahedral coordinated cobalt ions.38 Fig. S3(B)† shows the FT-IR spectra of PPy. The peak at 2980.1 cm−1 was due to –C–H stretching. The peaks at 1580 cm−1 and 1500 cm−1 are due to the aromatic ring of PPy. The characteristic PPy N—Q—N peak was observed at 1130 cm−1.39,40 Fig. S3(C)† depicts FT-IR spectra of Co3O4@PPy NCs. The C–N stretching vibration shows the presence of the 2° aromatic amine (NH) at 1344.2 cm−1. The presence of bands at 1433.90 and 1617.86 cm−1 confirms the presence of an alternate conducting and non-conducting phase of PPy. The peak at 3373.14 cm−1 is due to N–H stretching.41
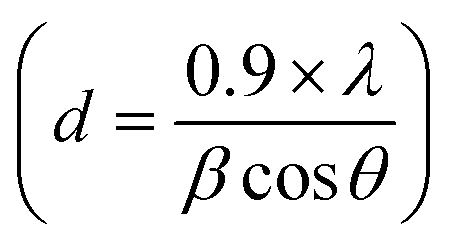
Fig. S4(A)† depicts the powder XRD of the Co3O4 QDs. The p-XRD shows peaks at 2θ of 18.7 (111), 31.21 (220), 35.87 (311), 43.23 (400), 59.41 (511), and 63.23 (440).42–44 The indexing pattern proves the simple cubic structure of Co3O4 QDs with unit cell dimensions A = B = C = 7.24 Å and corresponding space group Fd3m (JCPDS 76-1802, 073-1701). p-XRD shows characteristic peaks of the Co3O4 cubic spinel structure.45 The size of Co3O4 QDs recorded from the Scherer equation  was 21 nm.46
Three decades ago, CPs were considered to be amorphous. It is only after the discovery of p-XRD that CPs were considered to be semi-crystalline in nature.47,48 In the last decade, the crystalline form of PPy was synthesized.49–51
Fig. S4(B) and (C)† show the p-XRD of PPy, and Co3O4@PPy NCs. PPy depicts peaks at 2θ of 18.4° (111) and 24.3° (210). A very small shift in 2θ was seen due to scattering from PPy to vacant sites (voids). Fig. S4(C)† shows the p-XRD of in situ polymerization of Co3O4@PPy NCs, which results in interfacial interactions of PPy with Co3O4 and hence deformation in the shape of Co3O4 QDs.52 The size observed from p-XRD (Scherer relationship) was 32.5 nm.
Fig. S5(A)† depicts the TEM image of Co3O4 QDs. The Co3O4 QDs were seen to be agglomerated together because of the very small size of the inverse micelle. The particle size seen from the TEM was in close agreement with the size observed from p-XRD which is 25 nm. Fig. S5(B)† shows the sheet-like structure of PPy. It was observed that the oxalic acid (organic precursor) changed into electronically conductive C during pyrolysis.53 The TEM depicts an average particle size of 30.2 nm of PPy. A flexible sheet-like semi-amorphous structure of PPy CPs was visible in the TEM image. Hence, these PPy-based NCs can be used in softer electronic devices like display panels in mobile phones and laptop screens.
Fig. S5(C) and (D)† show the sheet-like structure of Co3O4@PPy NCs. The NCs show molecular aggregates of QDs completely entrapped in the polymer matrix of PPy. The vacant sites present in the porous structure of PPy enable the entrapment of Co3O4 QDs in the NCs.54–56 The globular shaped Co3O4 QDs were completely entrapped in the NCs. The TEM image reveals the average size of NCs to be 30–40 nm. A close agreement in average particle size was observed between p-XRD and TEM techniques.
3.1 Theoretical study
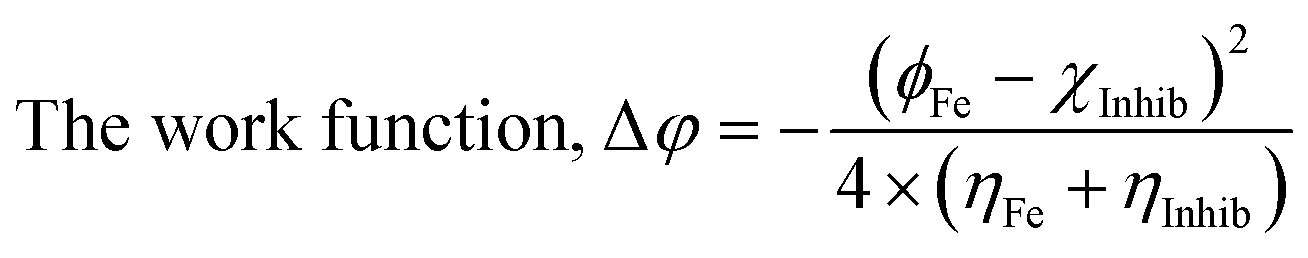
The density functional theory (DFT) provides information on the possible interaction between the PPy NCs and metal surface, interfacial arrangement at NCs/MS, surface information of PPy@Co3O4 NCs, and structural arrangement of molecules. The information obtained from DFT includes PPy NCs and MS interaction, physical, chemical, and physicochemical parameters, electrochemical affinity, HOMO and LUMO energy gap, adsorption locator energy, softness and hardness, Fukai function, etc. Tables S1 and S2,†Tables 1 and 2, Fig. 1 and 2 depict data obtained from a theoretical study. Table S1† depicts Mulliken charges per atom of Co3O4@PPy NCs. Mulliken charge was more on 5th and 11th N atoms that is, 0.6451 which indicates that N atoms act as adsorption sites of Co3O4@PPy NCs for adsorption on the top layer of Fe atoms of MS. Table S2† depicts α occupied and virtual eigenvalues MO coefficients of Co3O4@PPy NCs. The energy values of Co3O4@PPy NCs give the energy gap (Eg) between LUMO and HOMO31–33 (Fig. 2). The energy of the HOMO of Co3O4@PPy NCs was greater than that of the LUMO and therefore more suitable for physical adsorption on MS. Tables 3 and 4 depict results of the theoretical (DFT) study. The significant chemical potential (4.238 eV), global hardness (1.215 eV), and adsorption energy (6.72 kJ mol−1) show the high ability of adsorption of PPy NCs on the MS. The significant nucleophilic character (electron donation power) suggests the excellent ligand character of PPy NCs. The appreciable E, S, and CV indicate that the PPy NCs are thermodynamically unstable and hence chemically very reactive and possess high ability for interacting with the metal substrate (Table 4). Fig. 1 depicts the van der Waals surface and EDD of Co3O4@PPy NCs. The appreciable electron density contour on the 5th and 11th N atoms and large van der Waals surfaces at C atoms of the aromatic ring make these NCs fit for adsorption.36Fig. 2 depicts the HOMO and LUMO of Co3O4@PPy NCs. The energy gap (Eg) between the LUMO and HOMO was 2.43 eV which is comparable to the band gap obtained from Tauc plots of UV-visible spectroscopy (Fig. S2†). Hence, theoretical and experimental studies complement each other.
3.2 Anticorrosive properties of Co3O4@PPy NCs
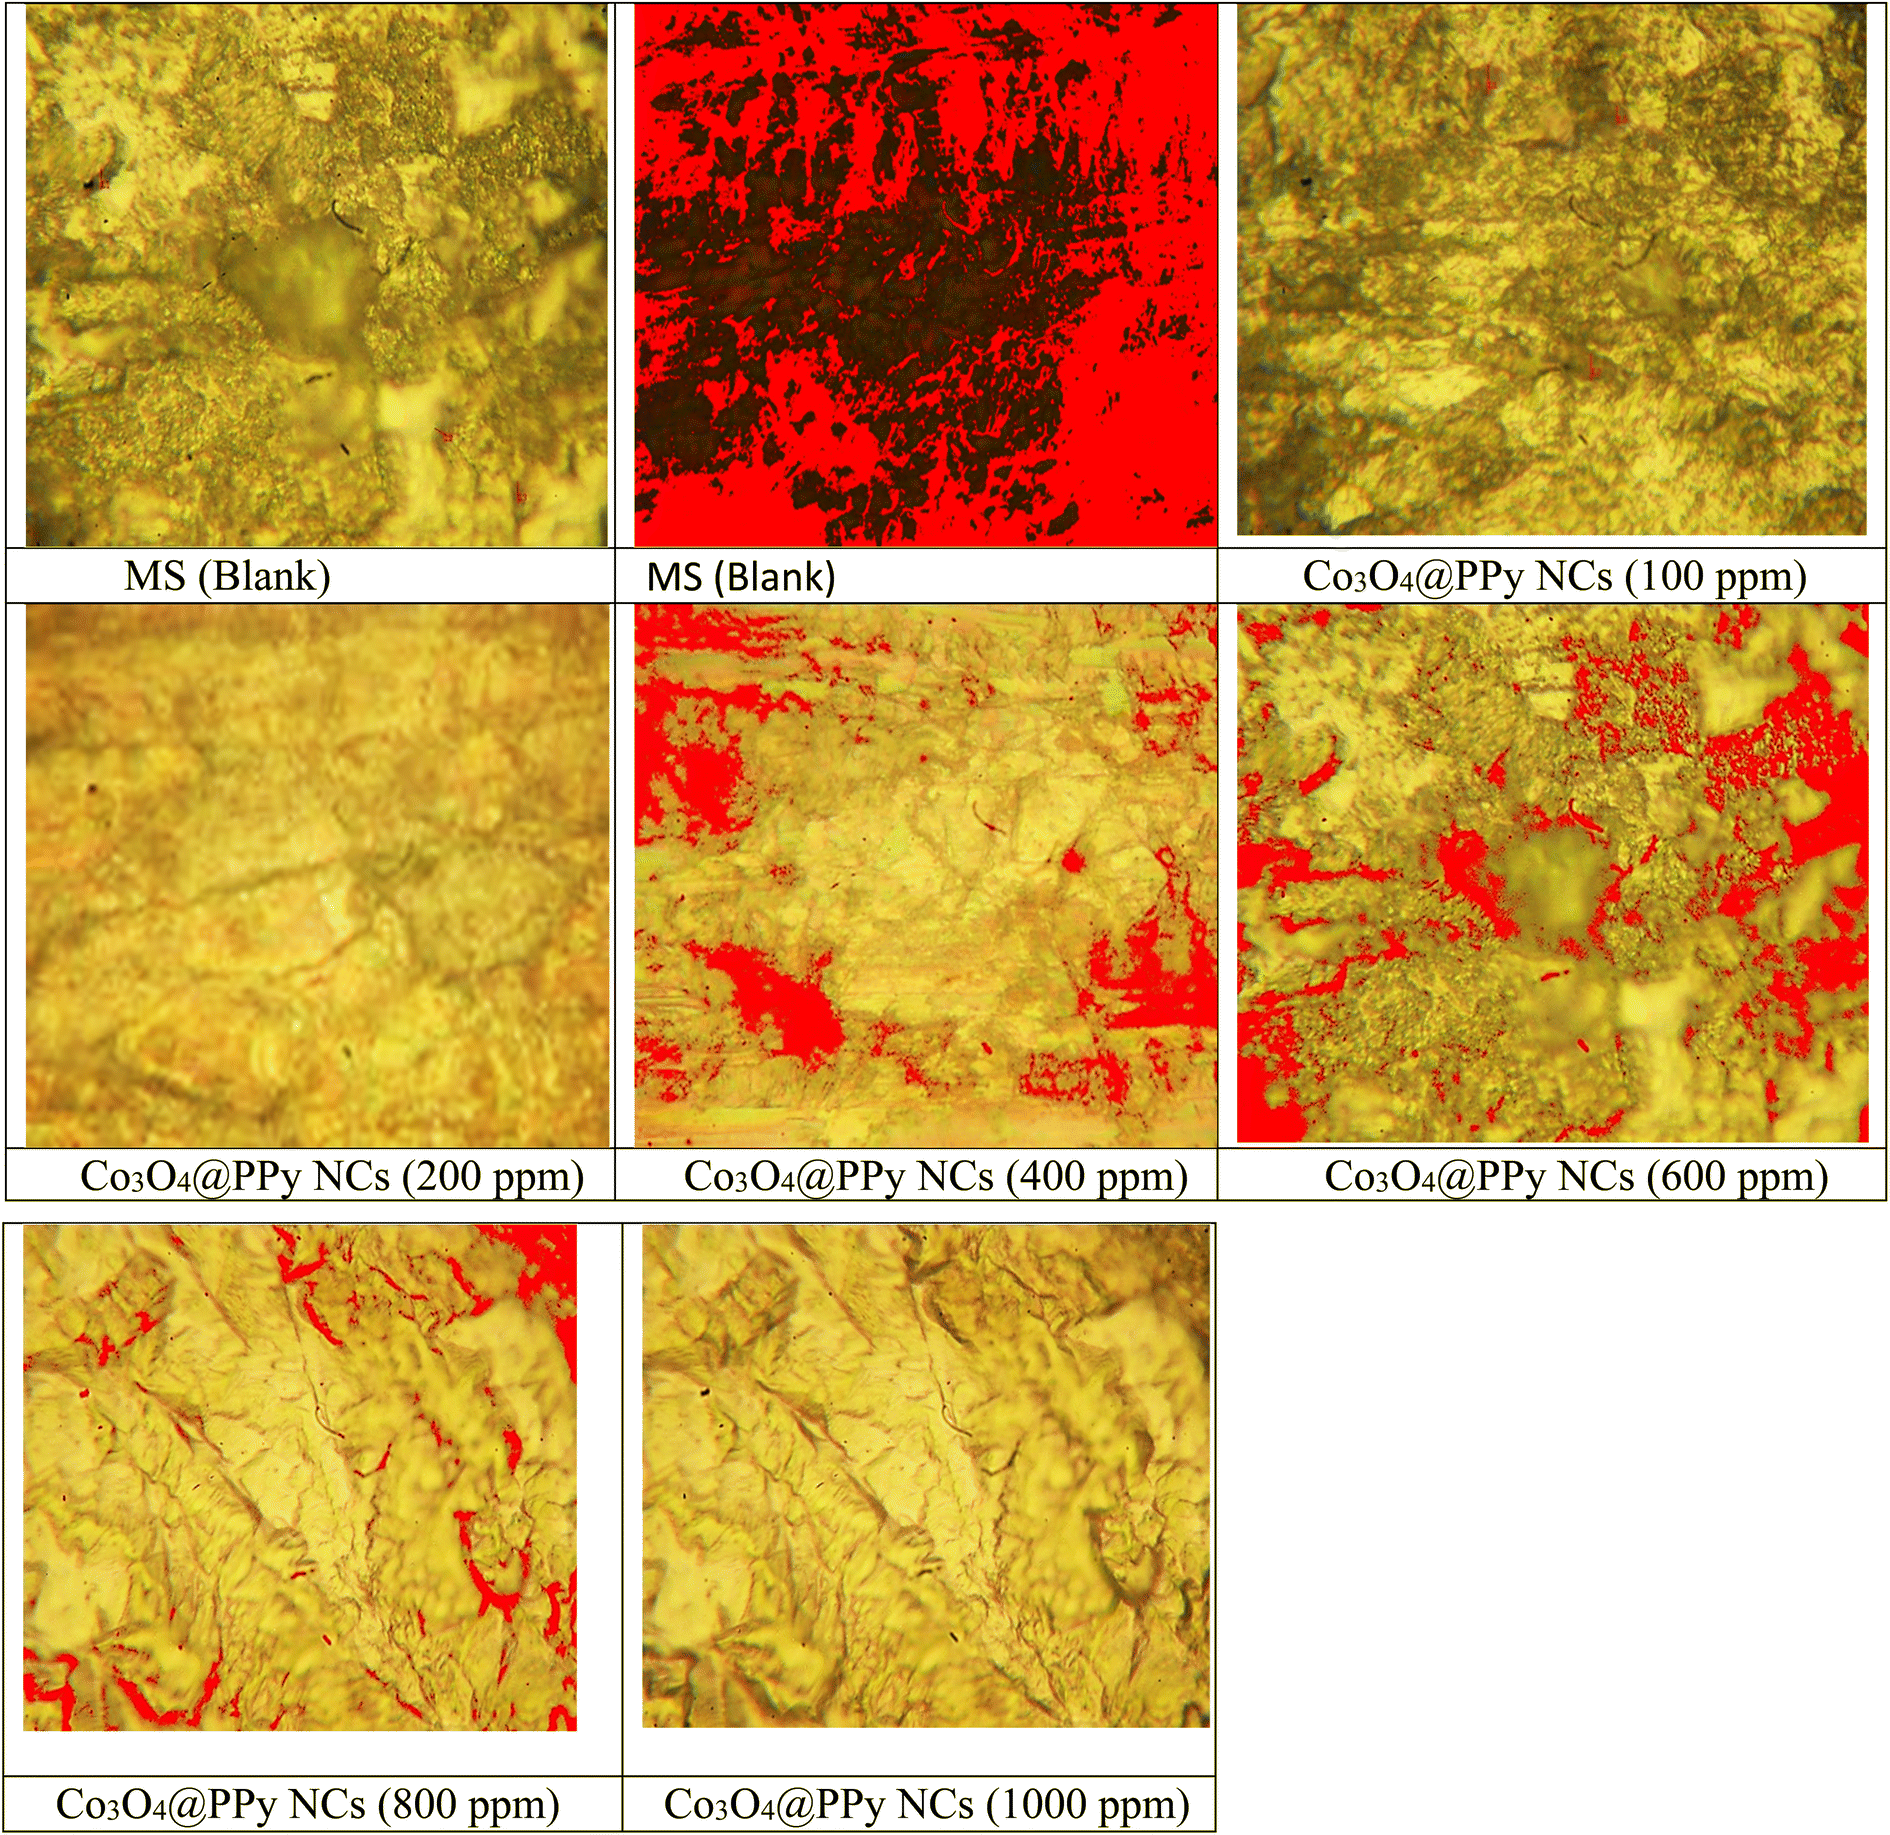
Anticorrosive properties of QD decorated Co3O4@PPy NCs were observed for MS in 0.1 M HCl at NTP. Table 3 shows the corrosion data obtained from the gravimetric study. Fig. 3 depicts a change in IE (%) with Co3O4@PPy NC concentrations. A direct relationship was seen between IE (%) and Co3O4@PPy NC concentration.13 A maximum of 81.58% IE was observed at 1 × 10³ ppm concentration. The IE (%) shown by Co3O4@PPy NCs was higher than that of rGO@MO NCs as CI for MS,9 PANI@MO NCs as CI for MS in an acidic solution,10Allium sativum as an environment-friendly CI for MS,35 pyrazole derivatives as acidic CI for steel,36 and Schiff base as the CI for MS.37 The metallurgical microscopy technique was used for the surface study of the MS surface. Fig. 4 depicts metallurgical images of MS coupons after a gravimetric study. The surface of MS becomes smoother with a rise in Co3O4@PPy NC concentration. The magnitude of cracks and pits declines with Co3O4@PPy NC concentration. The coating thickness increases from 51.3 to 161.2 μm. The percentage porosity decreases from 92.54% to 14.9% with the concentration of NCs. Pore length decreases from 191.6 μm to 11.7 μm at 100 ppm concentration. This supports the formation of a uniform film of inhibitor molecules whose thickness increases with the Co3O4@PPy NC concentration.23–26Table 4 depicts the porosity (%), the thickness of the film (μm), and pore length (μm) recorded using Meta-plus software. The porosity (%) and length of pores decrease and the thickness of the film shoots up with Co3O4@PPy NC concentrations.
 |
| | Fig. 3 The IE (%) versus concentration of Co3O4@PPy NCs after exposing MS to 0.1 M HCl at NTP. | |
 |
| | Fig. 4 Metallurgical images of blank and Co3O4@PPy NC treated MS coupons. | |
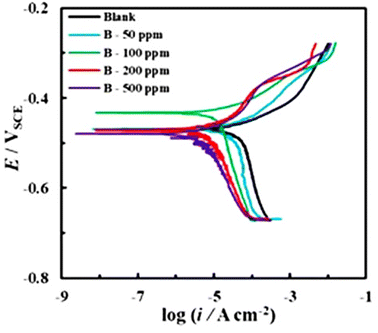
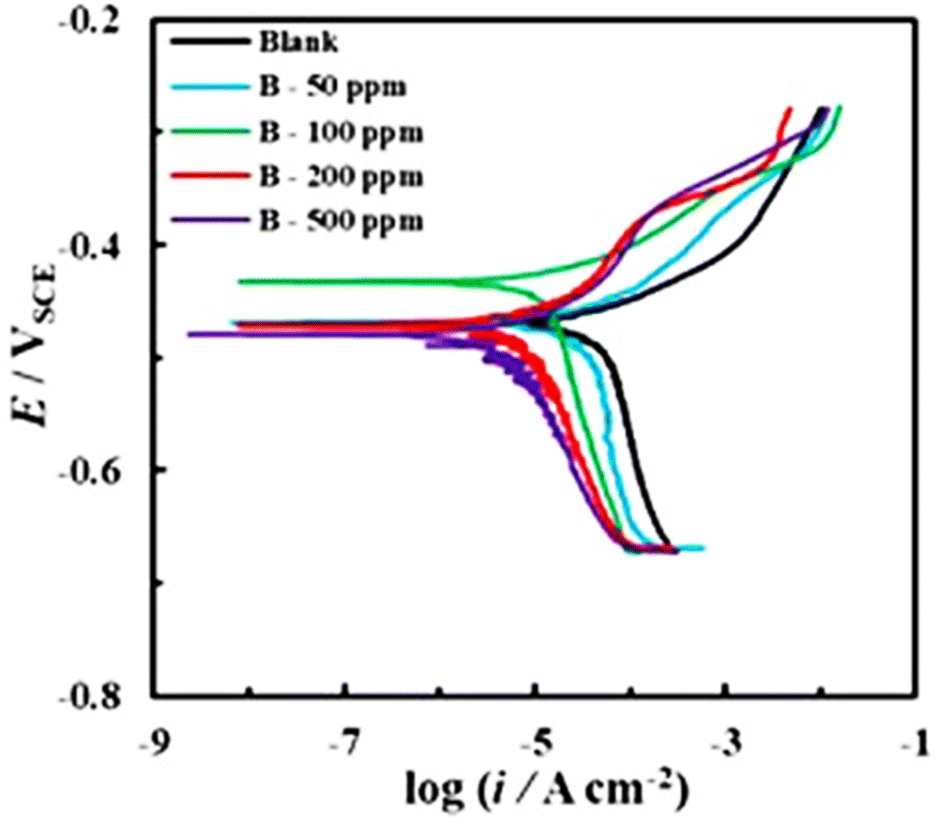
Table 5 shows the results of electrochemical polarization experiments performed in the presence of different concentrations of Co3O4@PPy NCs. Fig. 5 shows electrochemical polarization curves (Tafel slopes) of Co3O4@PPy NCs in 0.1 M HCl solution. The maximum IE (%) was 91.8% at 500 ppm of Co3O4@PPy NCs. The CR and corrosion current density (icorr) decrease and IE (%) increases with Co3O4@PPy NC concentration. Ecorr remains almost constant on addition of Co3O4@PPy NCs in the corroding solution.
Table 5 Electrochemical polarization data of Co3O4@PPy for MS in 0.1 M HCl at room temperature
| Inhibitor |
C
inh (ppm) |
E
corr (VSCE) |
β
a (V dec−1) |
β
c (V dec−1) |
i
corr (μA cm−2) |
CR (mpy) |
IE (%) |
| Blank |
— |
−0.472 |
0.085 |
−0.249 |
51.77 |
23.65 |
— |
| 50 |
−0.469 |
0.059 |
−0.311 |
28.75 |
13.12 |
43.9 |
| 100 |
−0.432 |
0.054 |
−0.245 |
16.61 |
7.59 |
68.1 |
| NCs |
200 |
−0.472 |
0.048 |
−0.184 |
5.54 |
2.53 |
89.4 |
| 500 |
−0.479 |
0.042 |
−0.168 |
4.22 |
1.93 |
91.8 |
 |
| | Fig. 5 Polarization curves of Co3O4@PPy NCs for mild steel in 0.1 M HCl at different concentrations. | |
3.3 Antibacterial study of Co3O4@PPy NCs
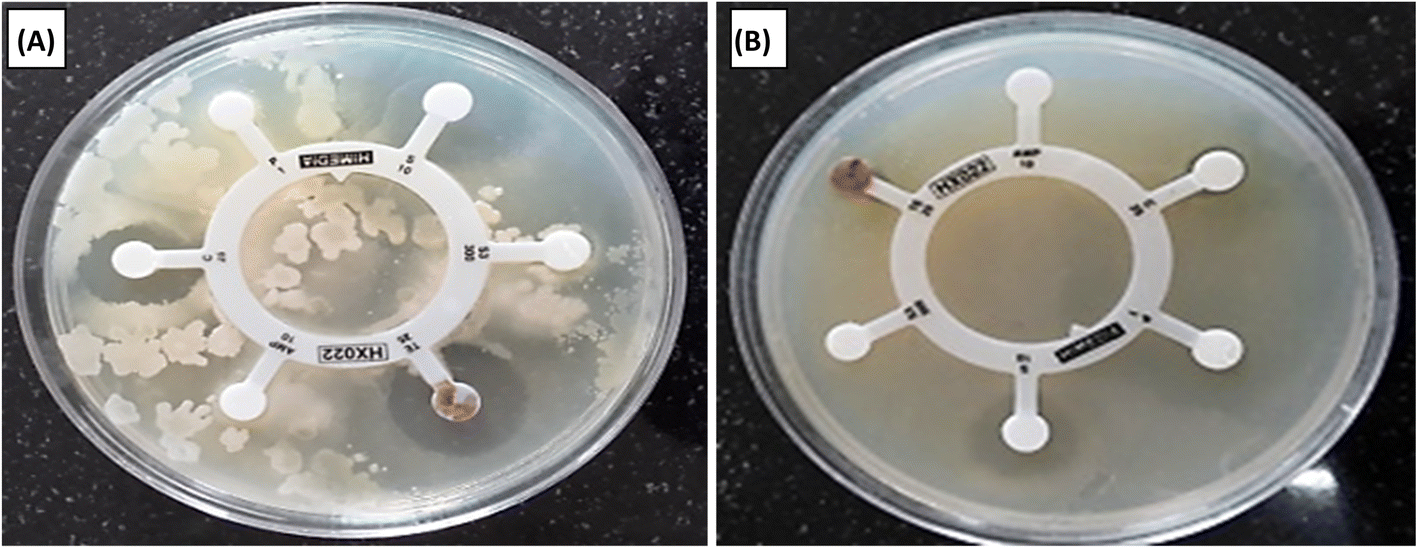
The antibacterial properties of Co3O4/PPy NCs were investigated against E. coli and S. epidermidis using the agar–agar method. The average ZoI (mm) in different directions was observed for both gram −ve and +ve bacteria. Table 6 displays the ZoI in mm of Hexa disk against S. epidermidis and E. coli.Table 6 displays ZoI shown by Co3O4@PPy NCs against Gram +ve (S. epidermidis) and Gram −ve (E. coli) bacteria. Fig. 6 depicts the ZoI produced by Hexa disk in bacterial strain. Fig. 7 depicts the ZoI at different Co3O4@PPy NC concentrations. The ZoI rises with the concentration of Co3O4@PPy NCs. The two standard antibiotics present in Hexa disk that is Ampicillin 10 mcg and S3-300 (Sulphatrid 300 mcg) do not show any antibacterial activity for both E. coli and S. epidermidis. Three other antibiotics, that is, TE-25 (Tetracycline 25 mcg), C-25 (Chloramphenicol 25 mcg), and P-1 (Penicillin-G) show very less antibacterial activity. The maximum ZoI observed in the case of Streptomycin-10 mcg (S-10) antibiotic of Hexa disk was 13 mm and 23 mm for E. coli and S. epidermidis, respectively. The Co3O4@PPy NCs show a maximum ZoI of 18 and 16 mm for E. coli and S. epidermidis, respectively at 1200 mg ml−1 which is higher than that of five standard antibiotics present in Hexa disk. The ZoI of Co3O4@PPy NCs is almost comparable to that of S-10 from the Hexa disk which shows the maximum ZoI. The ZoI and antibacterial properties of Co3O4@PPy NCs were higher than those of nanomaterials reported in the literature, that is, NiO@CdO NCs against K. pneumonia and S. aureus8 and silver oxide NPs against E. coli.26 The proposed mechanism is due to the production of toxic Reactive Oxygen Species (ROS), i.e., peroxides and OH˙ radicals formed under ordinary light. First of all, electrons and holes are generated from metal Co3O4 QDs. Free electrons combine with dissolved oxygen in the water and change into toxic ROS, i.e., superoxide radicals. Holes combine with hydroxyl ions of water molecules to change into hydroxyl free radicals. The toxic ROS and hydroxyl free radicals enter the bacterial cell through protein channels and damage multiple cellular organelles hence leading to the killing of bacteria.27,28
Table 6 ZoI (mm) shown by Hexa disk (standard antibiotics) against S. epidermidis and E. colia
|
|
Hexa disc |
| TE (25) |
C (25) |
P1 |
AMP 10 |
S (10) |
S3 (300) |
|
The six standard antibiotics present in Hexa disk were: TE-25 (Tetracycline 25 mcg), C-25 (Chloramphenicol 25 mcg), P-1 (Penicillin-G), AMP-10 (Ampicillin 10 mcg), S-10 (Streptomycin 10 mcg) and S3-300 (Sulphatrid 300 mcg).
|
|
S. epidermidis
|
19 |
17 |
15 |
NS |
23 |
NS |
|
E. coli
|
11 |
9 |
NS |
NS |
13 |
NS |
 |
| | Fig. 6 ZoI shown by Hexa disk (standard antibiotics) with S. epidermidis (A) and E. coli (B). | |
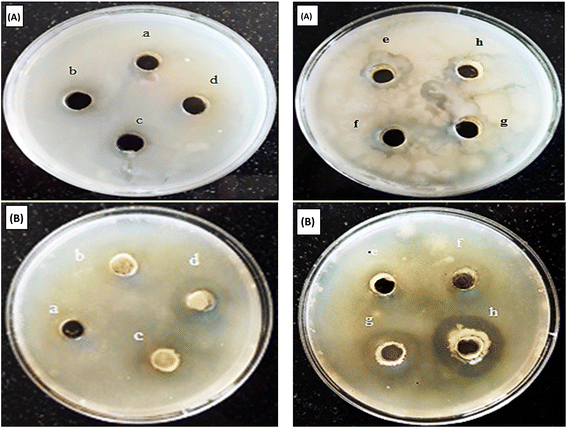 |
| | Fig. 7 ZoI shown by Co3O4@PPy NCs against S. epidermidis (A) and E. coli. (B). ZoI at 100 mg ml−1 (a), 200 mg ml−1 (b), 300 mg ml−1 (c), 400 mg ml−1 (d), 600 mg ml−1 (e), 800 mg ml−1 (f), 1000 mg ml−1 (g) and 1200 mg ml−1 (h) against S. epidermidis and E. coli, respectively. | |
3.4 Adsorption and kinetics study
The thermodynamics, kinetics, and adsorption studies of Co3O4@PPy NCs for adsorption on the MS surface were investigated using data from a gravimetric study. The gravimetric study was carried out at three different temperatures to determine the activation energy (Ea), free energy (ΔG0), ΔH0, ΔS0, and Kads using Arrhenius (simple and integrated) and van't Hoff equations (eqn (14)–(17)).| |  | (14) |
| | | ΔG0ads = ΔH0ads − TΔS0ads | (15) |
| |  | (16) |
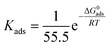
| | | ΔG0ads = −RTln(55.5 × KAds) | (17) |
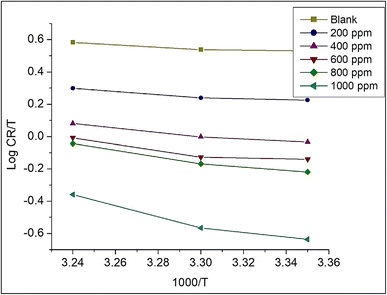
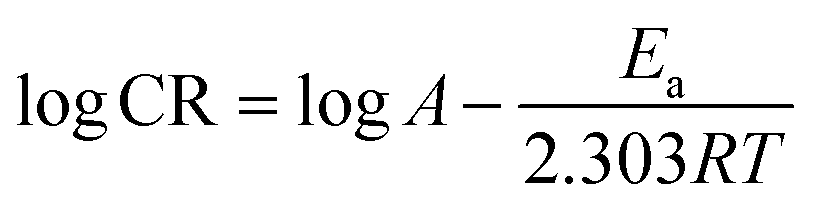
The CR at different temperatures obtained from the gravimetric study was plotted against 1000/T (Fig. 8). The slope of the graph gives the value of Ea/2.303R and hence helps in the evaluation of activation energy of adsorption of NCs on the MS surface. Table 7 depicts thermodynamic, kinetic and adsorption parameters found from the adsorption study of Co3O4@PPy NCs. The intercept of Fig. 8 gives the value of the Arrhenius constant which is linearly related to Ea.
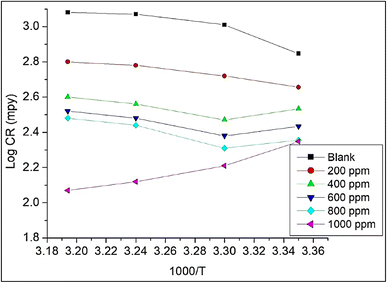 |
| | Fig. 8 LogCR (mpy) versus 1000/T for MS in Co3O4@PPy NCs. | |
Table 7 ZoI (mm) of Co3O4@PPy NCs against Gram +ve (S. epidermidis) and Gram −ve (E. coli) bacteria at different concentrations
| Bacterial test organism |
Co3O4/PPy NCs |
| Sample concentration (mg ml−1) |
| 100 |
200 |
300 |
400 |
600 |
800 |
1000 |
|
S. epidermidis
|
5 |
8 |
10 |
10 |
14 |
15 |
16 |
|
E. coli
|
3 |
4 |
6 |
11 |
12 |
14 |
18 |
For obtaining other important thermodynamic parameters like activation entropy (ΔS*) and standard enthalpy (ΔH*), a graph is plotted between logCR/T against 1000/T (Fig. 9). The intercept gives ΔS*/R which is used to find the activation entropy, ΔS*. The slope gives ΔH*/R which was utilized to obtain the activation enthalpy, ΔH* (Fig. 9). A positive and high activation enthalpy (9.36 kJ mol−1) shows that the adsorption of Co3O4@PPy NCs on MS is endothermic. The activation entropy increases with the concentration of Co3O4@PPy NCs which suggests that more and more NCs molecules enter the interface region with increase in concentration and thus increase the randomness of the system (Table 8).57,58
 |
| | Fig. 9 Plot of logCR/T versus 1000/T for Co3O4@PPy NCs. | |
Table 8 Adsorption, thermodynamic and kinetic parameters obtained from Langmuir and Henry isotherms for Co3O4@PPy NCs at 25, 30, and 35 °C
| Temperature (°C) |
Slope |
R
2
|
K
ads (L mol−1) |
−ΔG0ads (kJ mol−1) |
−ΔH0ads (kJ mol−1) |
ΔS0ads (kJ mol−1. K) |
E
a (kJ mol−1) |
|
Langmuir adsorption isotherm
|
| 25 |
1.03 |
0.971 |
25.76 |
42.43 |
9.36 |
0.011 |
31.2 |
| 30 |
1.14 |
0.957 |
18.64 |
37.76 |
|
|
|
| 35 |
1.23 |
0.964 |
11.32 |
31.64 |
|
|
|
|
|
Henry adsorption isotherm
|
| 25 |
1.21 |
0.945 |
2.13 |
27.32 |
8.44 |
0.12 |
33.63 |
| 30 |
1.17 |
0.973 |
1.12 |
18.46 |
|
|
|
| 35 |
1.23 |
0.956 |
0.97 |
13.78 |
|
|
|
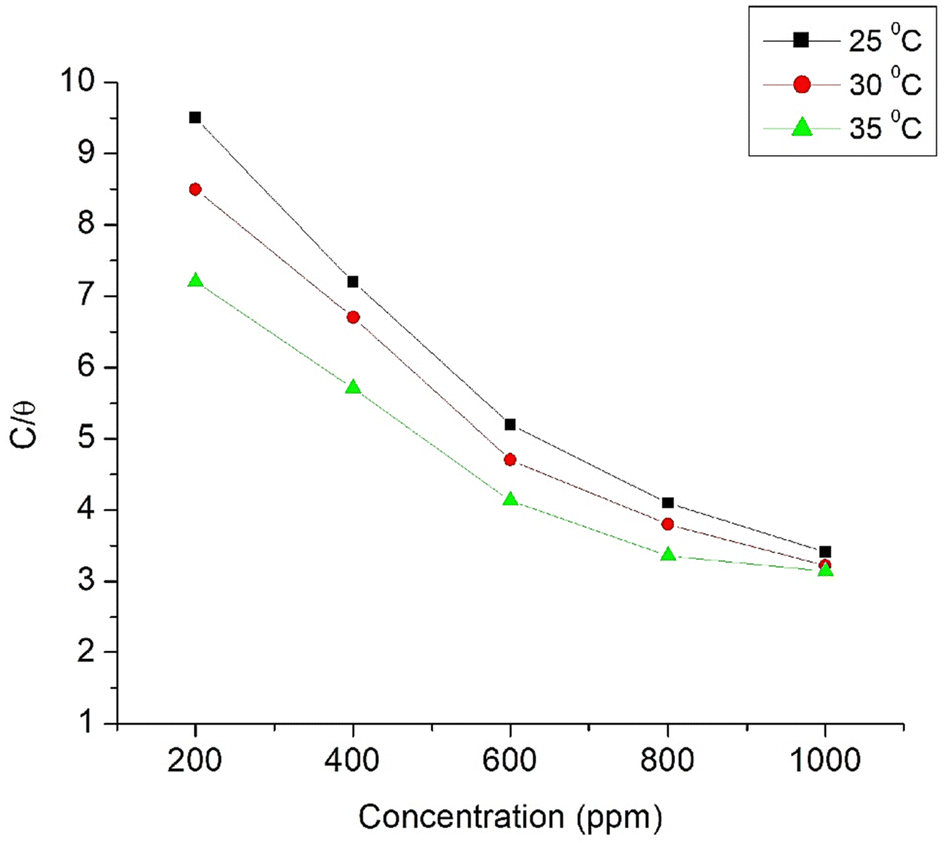
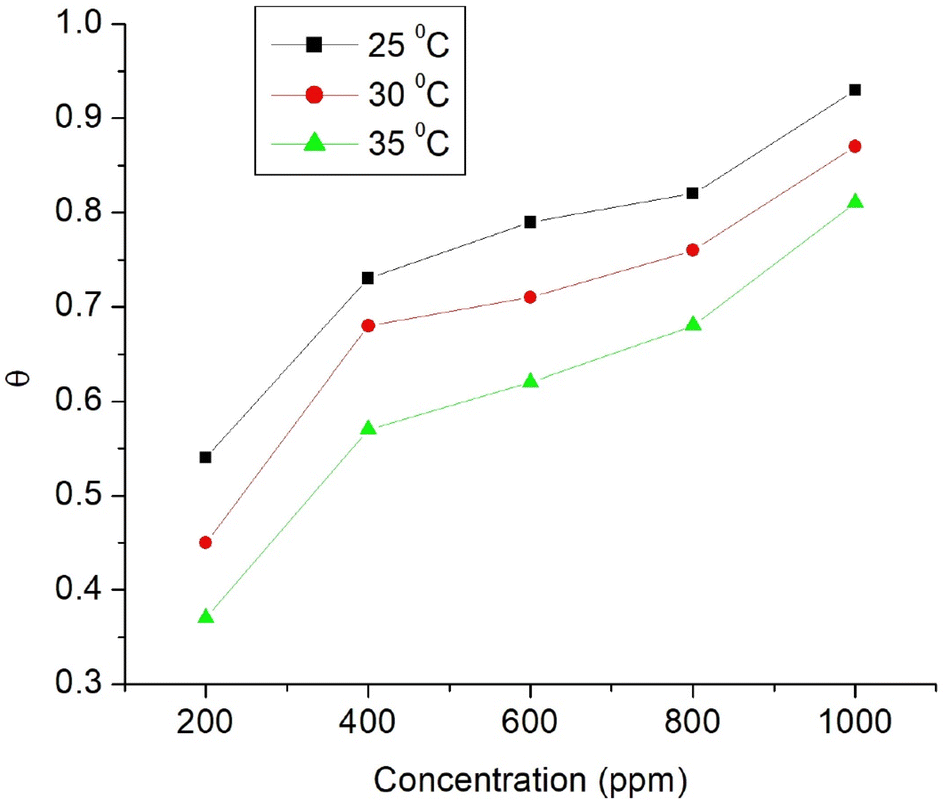
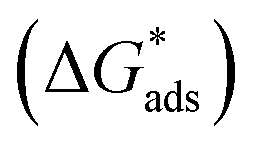
Langmuir adsorption and Henry adsorption isotherms were used for understanding the nature of the adsorption of Co3O4@PPy NCs on the MS surface (Table 8). Fig. 10 and 11 depict Langmuir (C/θ versus concentration) and Henry (θ versus C) adsorption isotherms for Co3O4@PPy NCs. The adsorption of Co3O4@PPy NCs on MS is under thermodynamic control proved by an increase in activation entropy (ΔS*), high adsorption-free energy  , and low activation energy (Ea) of adsorption.
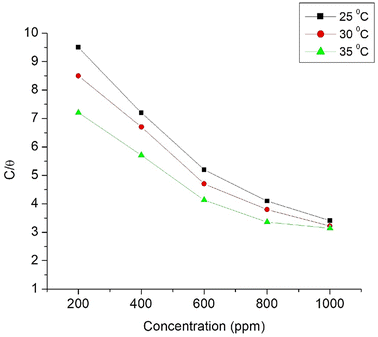 |
| | Fig. 10 Langmuir adsorption isotherm (C/θ) versus concentration of Co3O4@PPy NCs at 25, 30, and 35 °C. | |
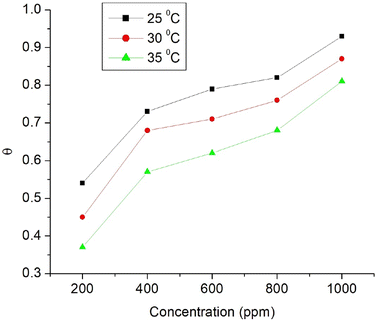 |
| | Fig. 11 Henry adsorption isotherm (θ) versus concentration (ppm) of Co3O4@PPy NCs at 25, 30, and 35 °C. | |
4. Conclusions
Self-assembled Co3O4 QDs were prepared by the reverse-micelle method. Co3O4@PPy NCs were prepared by the in situ method. Co3O4 QDs, PPy CPs, and Co3O4@PPy NCs were analyzed by p-XRD, FTIR, UV-visible, and TEM techniques. The experimental data were supported by theoretical (DFT and adsorption) studies. The conductivity, corrosion inhibition, and antibacterial activity of Co3O4@PPy NCs were investigated. Co3O4@PPy NCs show 81.58% IE at 1000 ppm. The significant chemical potential, global hardness parameters, interaction, and adsorption energy demonstrate the strong adsorption of PPy NCs on MS. The antibacterial properties of PPy NCs were compared with those of Hexa disk. The ZoI of Co3O4@PPy NCs at 1200 ppm against E. coli and S. epidermidis was greater than five antibiotics of Hexa disk. The proposed mechanism of antibacterial activity was due to the formation of toxic ROS (peroxides and OH˙ radicals) formed under daylight. The optical band (Eg) of PPy NCs was found to be lower than that of pure QDs and PPy CPs. The Eg obtained from the UV Tauc plot and DFT study was almost comparable. The Co3O4@PPy NCs shows good anticorrosive properties, antibacterial activity, and electrical conductivity suitable for use in soft electronics.
Conflicts of interest
There are no conflicts to declare.
Acknowledgements
The authors of this paper are very thankful to the authorities of CDLU and CUH for providing infrastructural support for this research work.
References
- B. Zhang, B. Zhao, S. Huang, R. Zhang, P. Xu and H. L. Wang, CrystEngComm, 2012, 14, 1542–1544, 10.1039/C2CE06396D.
- M. E. Rhazi, S. Majid, M. Elbasri, F. E. Salih, L. Oularbi and K. Lafdi, Int. Nano Lett., 2018, 8, 79–99, DOI:10.1007/s40089-018-0238-2.
- R. Sharma, R. Malik, S. Lamba and S. Annapoorni, Bull. Mater. Sci., 2008, 31(3), 409–413 CrossRef CAS.
- K. Sivakumar, S. V. Kumar, J. J. Shim and Y. Haldorai, Synthesis and Reactivity in Inorganic and Metal-Organic Chemistry, 2014, 44, 1414–1420, DOI:10.1080/15533174.2013.809743.
- Y. Wang, L. Cai, Y. Li, Y. Tang and C. Xie, Phys. E, 2010, 43, 503–509, DOI:10.1016/j.physe.2010.09.005.
- X. Jiang, X. Zhao, L. Duan, H. Shen, H. Liu, T. Hou and F. Wang, Ceram. Int., 2016, 42, 15160–15165, DOI:10.1016/j.ceramint.2016.05.098.
- L. Yosefi and M. Haghighi, Appl. Catal., B, 2018, 220, 367, DOI:10.1016/j.apcatb.2017.08.028.
- S. Anitha, M. Suganya, D. Prabha, J. Srivind, S. Balamurugan and A. R. Balu, Mater. Chem. Phys., 2018, 211, 88, DOI:10.1016/j.matchemphys.2018.01.048.
- H. Kumar, R. Rani, R. Sharma, A. Yadav and R. Kumari, Chem. Data Collect., 2020, 29, 100527, DOI:10.1016/j.cdc.2020.100527.
- H. Kumar, A. Boora, A. Yadav, R. Kumari and R. Sharma, Results Chem., 2020, 2, 100046, DOI:10.1016/j.rechem.2020.100046.
- M. Zhang, Y. Xu, H. Fan, N. Zhao, B. Yan, C. Wang, J. Ma, A. K. Yadav, W. Zhang, Z. Du, X. Zheng, M. Li, G. Dong and W. Wang, J. Alloys Compd., 2020, 826, 154115, DOI:10.1016/j.jallcom.2020.154115.
- X. Ren, H. Fan, J. Ma, C. Wang, M. Zhang and N. Zhao, Appl. Surf. Sci., 2018, 441, 194–203, DOI:10.1016/j.apsusc.2018.02.013.
- L. Ma, H. Fan, X. Wei, S. Chen, Q. Hu, Y. Liu, C. Zhi, W. Lu, J. A. Zapien and H. Huang, J. Mater. Chem. A, 2018, 6, 19058–19065, 10.1039/C8TA07477A.
- A. H. Monfared and M. Jamshidi, Prog. Org. Coat., 2019, 136, 105257, DOI:10.1016/j.porgcoat.2019.105257.
- L. Zhang, P. Liu and Z. Su, Polym. Degrad. Stab., 2006, 91, 2213e2219, DOI:10.1016/j.polymdegradstab.2006.01.002.
- S. Sarmah and A. Kumar, Indian J. Phys., 2011, 85, 713, DOI:10.1007/s12648-011-0071-1.
- N. V. Nerkar, S. B. Kondawar, S. K. Brahme and Y. H. Kim, Int. J. Mod. Phys. B, 2018, 32(19), 1840085, DOI:10.1142/S0217979218400854.
- H. Kumar, N. Kumari and R. Sharma, Environmental Impact Assessment Review, 2020, 85, 106438, DOI:10.1016/j.eiar.2020.106438.
- A. Yadav, H. Kumar, R. Sharma and R. Kumari, Colloid Interface Sci. Commun., 2020, 40, 100339, DOI:10.1016/j.colcom.2020.100339.
- A. Yadav and H. Kumar, ChemistrySelect, 2022, e202201475, 01–10, DOI:10.1002/slct.202201475.
- A. Yadav, H. Kumar, R. Sharma, R. Kumari and M. Thakur, RSC Adv., 2022, 12, 24063, 10.1039/d2ra03554e.
- H. S. Gadow and M. Fakech, RSC Adv., 2022, 12, 8953–8986, 10.1039/D2RA01296K DOI:10.1016/j.molstruc.2021.129958.
- R. Aslam, M. Mobin, M. Shoeb and J. Aslam, Sci. Rep., 2022, 12, 9274, DOI:10.1038/s41598-022-13359-y.
- L. H. Qiang, Y. Zhao and S. Zhang, Corros. Sci., 2021, 191, 109715 CrossRef.
- M. Mobin, M. Parveen and R. Aslam, J. Phys. Chem. Solids, 2022, 161, 110422 CrossRef CAS.
- R. Aslam, M. Mobin, M. Manilal, P. Banerjee and J. Aslam, J. Mol. Liq., 2021, 334, 116469 CrossRef CAS.
- M. A. Raza, Z. Kanwal, A. Rauf, A. N. Sabri, S. Riaz and S. Naseem, Nanomaterials, 2016, 6, 74, DOI:10.3390/nano6040074.
- S. Gurunathan, Arabian J. Chem., 2014, 12, 168–180, DOI:10.1016/j.arabjc.2014.11.014.
- P. A. Zapata, L. Tamayo, M. Páez, E. Cerda, I. Azócar and F. M. Rabagliati, Eur. Polym. J., 2011, 47, 1541–1549, DOI:10.1016/j.eurpolymj.2011.05.008.
- M. Shanmugam, A. Alsalme, A. Alghamdi and R. Jayavel, ACS Appl. Mater. Interfaces, 2015, 7, 14905–14911, DOI:10.1021/acsami.5b02715.
- L. Cheng, Y. Wang, D. Huang, T. Nguyen, Y. Jiang and H. Yu,
et al.
, Mater. Res. Bull., 2015, 61, 409–414, DOI:10.1016/j.materresbull.2014.10.036.
- X. Wu, L. Wen, K. Lv, K. Deng, D. Tang and H. Ye,
et al.
, Appl. Surf. Sci., 2015, 358, 130–136, DOI:10.1016/j.apsusc.2015.08.061.
-
L. Pauling, The Nature of the Chemical Bond, Cornell University Press, New York, 1960 Search PubMed.
- R. G. Parr and R. G. Pearson, J. Am. Chem. Soc., 1983, 105, 7512–7516, DOI:10.1021/ja00364a005.
- K. Rajam, S. Rajendran and R. Saranya, J. Chem., 2013, 743807, 1–4, DOI:10.1155/2013/743807.
- S. K. Saha, A. Hens, A. R. Chowdhury, A. K. Lohar, N. C. Murmu and P. Banerjee, Can. Chem. Trans., 2014, 2, 489, DOI:10.13179/canchemtrans.2014.02.04.0137.
- S. K. Saha, P. Ghosh, A. Hens, N. C. Murmu and P. Banerjee, Phys. E, 2015, 66, 332–341, DOI:10.1016/j.physe.2014.10.035.
- Y. Teng, S. Yamamoto, Y. Kusano, M. Azuma and Y. Shimakawa, Mater. Lett., 2010, 64, 239–242 CrossRef CAS.
- C. C. R. L. Esenbaumer, Synth. Met., 1989, 30, 123 CrossRef.
- T. L. A. Campos, D. F. Kersting and C. A. Ferreira, Surf. Coat. Technol., 1999, 122, 3 CrossRef CAS.
- P. C. Rodrigues, M. P. Cantão, P. Janissek, P. C. N. Scarpa, A. L. Mathias, L. P. Ramos and M. A. B. Gomes, Eur.
Polym. J., 2002, 38, 2213–2217, DOI:10.1016/S0014-3057(02)00114-3.
- M. Yarestani, A. D. Khalaji, A. Rohani and D. Das, J. Sci., Islamic Repub. Iran, 2014, 25(4), 339–343 Search PubMed.
- R. Manigandan, K. Giribabu, R. Suresh, L. Vijaylakshmi, A. Stephen and V. Narayanan, Chem. Sci. Trans., 2013, 2, 47–50 Search PubMed.
- S. Farhadi, J. Safabakhsh and P. Zaringhadam, J. Nanostruct. Chem., 2013, 3(69), 1–9 Search PubMed.
- H. Fuji, J. Tominaga, L. Men, T. Nakano, H. Katayama and N. Atoda, Jpn. J. Appl. Phys., 2000, 39, 980–981 CrossRef CAS.
- M. A. Muhsien and H. H. Hamdan, Energy Procedia, 2012, 18, 300–311 CrossRef.
- S. Neves and C. P. Fonseca, J. Power Sources, 2002, 107, 13–17, DOI:10.1016/S0378-7753(01)00971-5.
- K. Ghanbari, M. F. Mousavi, M. Shamsipur and H. Karami, J. Power Sources, 2007, 170, 513–519, DOI:10.1016/j.jpowsour.2007.02.090.
- W. M. Chen, L. Qie, L. X. Yuan, S. A. Xia, X. L. Hu, W. X. Zhang and Y. H. Huang, Electrochim. Acta, 2011, 56, 2689–2695, DOI:10.1016/j.electacta.2010.12.041.
- A. A. Syed and M. K. Dinesan, Talanta, 1991, 38, 815–837, DOI:10.1016/0039-9140(91)80261-W.
- S. Jaroslav, H. Drahomira, T. Miroslava, P. Jan and S. Irima, Polym. Int., 2004, 53, 294 CrossRef.
- L. A. Garcia-Cerda, L. Romo-Mendoza and M. A. Quevedo-Lopez, J. Mater. Sci., 2009, 44, 4553–4556, DOI:10.1007/s10853-009-3690-6.
- J. X. Huang, S. Virji, B. H. Weiller and R. B. Kaner, J. Am. Chem. Soc., 2003, 125, 314–315, DOI:10.1021/ja028371y.
- N. Parvatikar, S. Jain, S. V. Bhoraskar and M. V. N. A. Prasad, J. Appl. Polym. Sci., 2006, 102, 5533–5537, DOI:10.1002/app.24636.
- P. C. Rodrigues, M. P. Cantao and P. Janissek, Eur. Polym. J., 2002, 38, 2213–2217, DOI:10.1016/S0014-3057(02)00114-3.
- M. V. Fuke, A. Vijayan, M. Kulkarni, R. Hawaldar and R. C. Aiyer, Talanta, 2008, 76, 1035–1040, DOI:10.1016/j.talanta.2008.04.064.
- A. Mohammadi, S. M. A. Hosseini, M. J. Bahrami and M. Shahidi, Prog. Color, Color. Coat., 2016, 9(2), 117–134 CAS.
-
N. Harckerman and R. M. Hurd, 1st International Congress on Metallic Corrosion, Butterworths, London, 1962, vol. 166 Search PubMed.
|
| This journal is © The Royal Society of Chemistry 2023 |

 Open Access Article
 This Open Access Article is licensed under a Creative Commons Attribution-Non Commercial 3.0 Unported Licence
 *a,
Manisha
Luthra
b,
Manisha
Punia
b,
Pawanvir
Kaur
b and
Ramesh
Kumar
c
*a,
Manisha
Luthra
b,
Manisha
Punia
b,
Pawanvir
Kaur
b and
Ramesh
Kumar
c


 was 21 nm.46
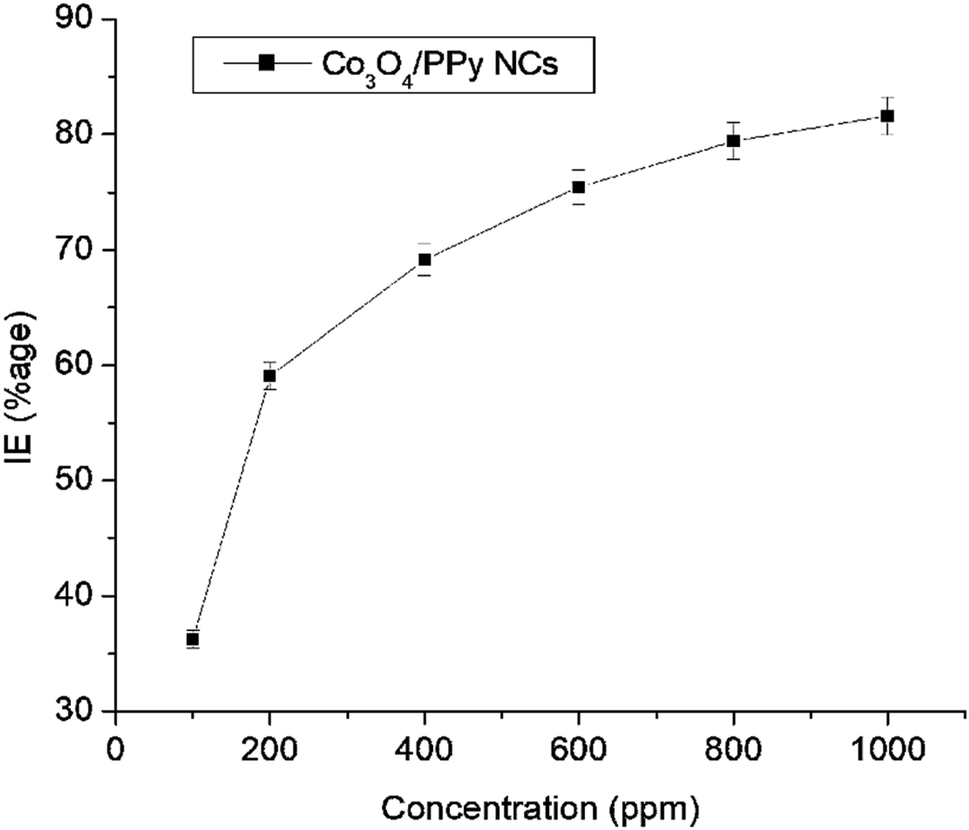


 , and low activation energy (Ea) of adsorption.