 Open Access Article
Creative Commons Attribution 3.0 Unported Licence
Highly enhanced photocatalytic activity of WO3 thin films loaded with Pt–Ag bimetallic alloy nanoparticles†
Pengyu Dong *a,
Bairen Yangb,
Chao Liuc,
Fenghua Xuc,
Xinguo Xid,
Guihua Houa and
Rong Shao*d
aKey Laboratory for Advanced Technology in Environmental Protection of Jiangsu Province, Yancheng Institute of Technology, Yancheng, 224051, P. R. China. E-mail: dongpy11@gmail.com; Fax: +86-515-8829-8923; Tel: +86-515-8829-8923
bSchool of Environmental Science and Engineering, Yancheng Institute of Technology, Yancheng 224051, China
cSchool of Materials Engineering, Yancheng Institute of Technology, Yancheng, 224051, P. R. China
dJiangsu Collaborative Innovation Center for Ecological Building Materials and Environmental Protection Equipments, Yancheng Institute of Technology, Yancheng 224051, China. E-mail: sr@ycit.cn
First published on 4th January 2017
Abstract
WO3 thin films loaded with Pt–Ag bimetallic alloy nanoparticles were successfully synthesized by a three-step method involving the formation of a homogeneous precursor sol, spin coating as well as UV-light reduction, and calcination. Moreover, a systematic, comparative study of the microstructure, chemical environment and electrochemical characteristics of the as-prepared Pt/WO3, Ag/WO3, and Pt–Ag/WO3 thin films was carried out. It was found that the Pt–Ag/WO3 thin film exhibited a highly enhanced photocatalytic performance for the degradation of methylene blue solution compared with the pure WO3, Pt/WO3 and Ag/WO3 thin films. Based on the experimental results and the energy-band diagrams, the transfer paths of photogenerated charges and the enhanced photocatalytic mechanism were proposed. It was suggested that the photogenerated electrons from the conduction band of WO3 first transferred to Ag and then to Pt in the Pt–Ag/WO3 sample during the photocatalytic process, promoting the efficient two-electron reduction of O2 compared to in the Pt/WO3 and Ag/WO3 samples. In addition, this process prevented the oxidation of Ag in the Pt–Ag/WO3 sample during the photodegradation process in air. Overall, this study provides a novel approach to design efficient photocatalysts decorated by bimetallic alloy nanoparticles.
1. Introduction
It is well-known that photocatalysis is a promising technology for the production of hydrogen energy and the purification of environmental pollutants. In the past decades, TiO2, a traditional and typical photocatalyst, was widely and deeply investigated.1,2 However, the wide band gap (3.2 eV) of TiO2 photocatalyst greatly limits its further application, especially in applications that utilize visible light.WO3, a visible light-responsive photocatalyst, absorbs light at wavelengths up to 480 nm and has intriguing merits such as low cost, harmlessness, and stability in both acidic and oxidative conditions,3–5 leading to extensive application prospects in the field of visible light-driven photocatalysts. However, researchers have to face the fact that the photocatalytic activity of pure WO3 semiconductor without any suitable optimization is relatively low,6 which can be attributed to the rapid recombination of photogenerated charges and the relatively positive conduction band (CB) edge (+0.5 V vs. normal hydrogen electrode (NHE) at pH = 0) of WO3.6,7
Recently, the deposition of noble metals on the surface of WO3 semiconductor has been proven to be an effective strategy for improving the photocatalytic activity of WO3. Abe et al. demonstrated that the photocatalytic activity of WO3 loaded with Pt nanoparticles was almost comparable to that of TiO2 under UV light irradiation and much higher than that of N–TiO2 under visible light irradiation for the decomposition of organic acetic acid.8 Subsequently, other research groups supported the conclusion of Abe et al.8 using various experimental approaches.9–14 Our research group investigated the effect of carriers on the photocatalytic activity for purification of NO gas over Pt/WO3 catalyst and found that Pt/WO3–zeolite molecular sieves (carrier) exhibited the highest conversion efficiency.15 The Pt/WO3 photocatalyst exhibited high efficiency for both the decomposition of organic compounds and the purification of NOx. However, the high cost of Pt should not be ignored in photocatalytic applications. Apart from the noble metal Pt nanoparticles, Ag nanoparticles have been used to improve the photocatalytic activity of WO3 because of the low cost and surface plasmon resonance (SPR) effect of Ag nanoparticles. For example, Sun et al. found that an as-synthesized Ag/mesoporous WO3 sample exhibited superior photocatalytic activity for the decomposition of a common air pollutant (i.e., acetaldehyde) compared to mesoporous WO3, Ag/commercial WO3 and N–TiO2 under visible-light irradiation.16 Nevertheless, preventing the oxidation of surface Ag atoms in air atmosphere remains a great challenge.
It was reported that compared to the corresponding Pt or Ag monometallic catalysts, their combination resulted in an obvious synergistic effect and significantly enhanced the catalytic activity in the absence of light irradiation.17–19 However, the utilization of Pt–Ag for enhancing photocatalytic activity has seldom been investigated. To some extent, a better photocatalytic activity might be expected if Pt and Ag were simultaneously used to modify WO3, especially WO3 thin films. This is because WO3 thin film can be repeatedly used without a complicated recycling process, which is necessary for conventional powder photocatalysts, and is hardly lost during photocatalytic reaction.11,20–28
In this work, we fabricated WO3 thin-film photocatalysts co-modified by Pt–Ag bimetallic alloy nanoparticles (Pt–Ag/WO3) by simultaneously photo-depositing Pt and Ag precursor ions on a WO3 thin film to address the shortages of monometals Pt and Ag. Based on a systematic, comparative study of the microstructure, chemical environment and electrochemical characteristics of the prepared Pt/WO3, Ag/WO3, and Pt–Ag/WO3 thin films, the transfer paths of photo-generated charges and photocatalytic mechanism were proposed.
2. Experimental section
2.1 Preparation of Pt–Ag/WO3 thin film
The entire preparation process can be divided into three steps. First, the precursor sol was synthesized as follows: 3.45 μmol polyvinyl alcohol (PVA; average molecular weight: 129![[thin space (1/6-em)]](https://www.rsc.org/images/entities/char_2009.gif) 710; polymerization degree: 1750) was dissolved in deionized water (60 mL) with stirring at 80 °C for 1 h in a water bath to form a colloid. Next, 0.6 mmol ammonium metatungstate ((NH4)6H2W12O40, 99%) was added into the above colloid and stirred for 24 h to form a homogeneous precursor sol, which could remain stable for seven days. Second, a mixture of 0.5 mL of 10 mM H2PtCl6 and 0.5 mL of 10 mM AgNO3 in N,N-dimethylformamide (DMF) solution was added into the above precursor sol (2 mL) and mixed with stirring. Next, 3 mL of the precursor sol containing the H2PtCl6 and AgNO3 solution was spin coated onto an indium-tin oxide (ITO) substrate with dimensions of 3 × 3 cm at a rate of 3000 rpm for 50 s using a spin coater and then dried at room temperature to form a precursor gel. Subsequently, the layer was illuminated with UV light (365 nm, 500 W) for 3 h so that the platinum and silver salts (H2PtCl6 and AgNO3) were reduced from Pt4+ and Ag+ to Pt0–Ag0. Finally, calcination was conducted in a drop-tube furnace at a heating rate of 1 °C min−1 for 5 h at 550 °C in N2 atmosphere. The schematic illustration of the growth process is shown in Scheme 1.
710; polymerization degree: 1750) was dissolved in deionized water (60 mL) with stirring at 80 °C for 1 h in a water bath to form a colloid. Next, 0.6 mmol ammonium metatungstate ((NH4)6H2W12O40, 99%) was added into the above colloid and stirred for 24 h to form a homogeneous precursor sol, which could remain stable for seven days. Second, a mixture of 0.5 mL of 10 mM H2PtCl6 and 0.5 mL of 10 mM AgNO3 in N,N-dimethylformamide (DMF) solution was added into the above precursor sol (2 mL) and mixed with stirring. Next, 3 mL of the precursor sol containing the H2PtCl6 and AgNO3 solution was spin coated onto an indium-tin oxide (ITO) substrate with dimensions of 3 × 3 cm at a rate of 3000 rpm for 50 s using a spin coater and then dried at room temperature to form a precursor gel. Subsequently, the layer was illuminated with UV light (365 nm, 500 W) for 3 h so that the platinum and silver salts (H2PtCl6 and AgNO3) were reduced from Pt4+ and Ag+ to Pt0–Ag0. Finally, calcination was conducted in a drop-tube furnace at a heating rate of 1 °C min−1 for 5 h at 550 °C in N2 atmosphere. The schematic illustration of the growth process is shown in Scheme 1.
For comparison purposes, a pure WO3 thin film was prepared under the same conditions without adding H2PtCl6 and AgNO3 in DMF solution and without the reduction process under UV light irradiation. A Pt/WO3 thin film was prepared under the same conditions except that 0.5 mL of 10 mM H2PtCl6 in DMF solution was added instead of 0.5 mL of 10 mM H2PtCl6 and 0.5 mL of 10 mM AgNO3. A Ag/WO3 thin film was prepared under the same conditions except that 0.5 mL of 10 mM AgNO3 in DMF solution was added instead of the mixture of H2PtCl6 and AgNO3.
2.2 Characterization
Thermogravimetric and differential scanning calorimetric analyses (TG-DSC) were performed with a NETZSCH DSC 200 F3 instrument under N2 flow. Measurements were conducted from room temperature to 600 °C at a heating rate of 10 °C min−1. X-ray diffraction (XRD) experiments were carried out with a D/max-2400 diffractometer (Rigaku, Japan) using Cu-Kα radiation. The surface morphologies were analyzed by scanning electron microscopy (SEM; FEI Quanta 250). Transmission electron microscopy (TEM) images were collected with a Philips Tecnai 12 microscope. Atomic force microscopy (AFM) measurements were performed with a Bruker Dimension Icon atomic force microscope. X-ray photoelectron spectroscopy (XPS) measurements were carried out to investigate the surface chemical compositions and states with Al Kα X-ray (hν = 1486.6 eV) radiation (K-Alpha, Thermo Electron, USA). UV-vis diffuse reflectance spectra were obtained on a UV-vis spectrophotometer (Shimadzu, UV-2600). The electrochemical impedance spectroscopy (EIS) spectra and Mott–Schottky plots of the as-prepared thin films were measured on an electrochemical analyzer (CHI660E); the details are described in the ESI.†2.3 Photocatalytic tests
According to the test method of photocatalytic materials for the purification of water solution (GB/T 23762-2009, China), the visible light photocatalytic activities of the as-prepared samples were evaluated by the degradation of methylene blue (MB) in aqueous solution. In a typical photocatalytic experiment, the as-prepared thin-film sample using ITO glass as a substrate was fixed in the quartz frame and submerged in MB solution (5 mg L−1, 100 mL). Before irradiation, the solution was magnetically stirred for 40 min in the dark to ensure the establishment of adsorption–desorption equilibrium. A 350 W Xe lamp with a cutoff filter of 420 nm was employed as the visible-light irradiation source and positioned 10 cm away from the reactor. After the light was turned on, at given time intervals (20 min), approximately 4 mL of clear MB solution was withdrawn and analyzed by recording the maximum absorbance at 664 nm in the UV-visible spectrum of MB. The percentage of degradation was calculated by C/C0, where C is the concentration of remaining MB solution at each irradiated time interval, and C0 is the initial concentration.The photocatalytic stability of the Pt–Ag/WO3 thin film was investigated by using the film in multiple cycles of the photocatalytic degradation of MB. After one cycle, the photocatalyst was filtrated and washed thoroughly with deionized water, and fresh MB solution (5 mg L−1) was then added to the photocatalyst to begin the next cycle. Five consecutive cycles were completed, and each cycle lasted for 120 min.
Active-species capture experiments were carried out to study the photocatalytic mechanism. Different radical scavengers such as ethylene diamine tetraacetic acid disodium salt (EDTA–2Na, 1 mmol L−1), tert-butyl alcohol (t-BuOH, 1 mmol L−1) and 1,4-benzoquinone (BQ, 1 mmol L−1) were added to the MB aqueous solution. The remaining experimental processes were similar to the above photocatalytic test.
3. Results and discussion
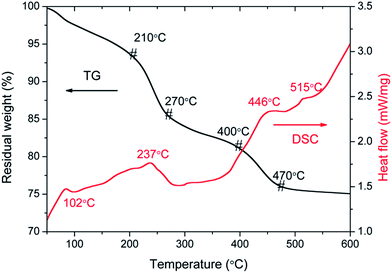
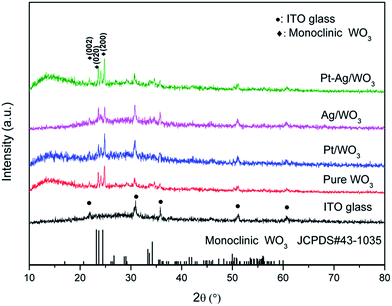
For sake of the thermal annealing process of the precursor gel, the TG/DSC curves of the precursor gel of Pt–Ag/WO3 were examined (Fig. 1). Weight loss was observed in four consecutive steps. The first step of mass loss (7.6%) occurred between 30 °C and 210 °C with an endothermic peak at 102 °C and was due to the loss of surface water and dehydration. The second stage of mass loss (8.1%) occurred between 210 °C and 270 °C with an exothermic band centered at 237 °C; this may have been due to the thermal evaporation and decomposition of HCl, NO3−, and other species from the raw material. The decomposition process of the film started from at 270 °C and proceeded until 470 °C in two consecutive steps, with mass losses of 4.2% and 5.2% corresponding to the third and fourth stages, respectively. An exothermic peak was observed at 446 °C, which can be attributed to the thermal decomposition of PVA.29 At temperatures above 470 °C, the residual weight remains constant, and the final exothermic peak at 515 °C is attributable to the transformation of the amorphous structure to the monoclinic phase of WO3. This result implies that 550 °C is a proper calcination temperature for the formation of Pt–Ag/WO3.Fig. 2 shows the XRD patterns of ITO glass and the as-prepared samples. It is clear that all of the as-prepared samples showed polycrystalline structures, and all of the peaks were attributed to the monoclinic phase of WO3 (JCPDS 43-1035), except those attributed to ITO glass. It is noted that the peaks attributed to ITO glass were observed in the pure WO3, Pt/WO3, Ag/WO3, and Pt–Ag/WO3 films. This is because the films were relatively thin. In addition, no diffraction peaks attributed to Pt, Ag, and Pt–Ag were observed in the Pt/WO3, Ag/WO3, and Pt–Ag/WO3 samples, respectively, indicating that the contents of these noble metals in the composite films were relatively low.
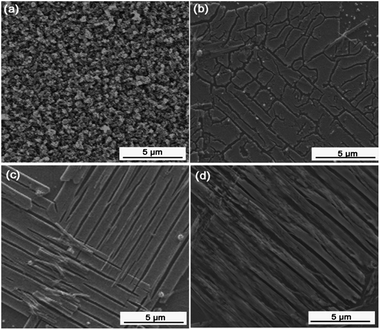
Fig. 3 shows the SEM images of these four samples at low magnification (8000×). The images illustrate the characteristic larger-scale microstructures of the samples. Fig. 3a shows that the pure WO3 film is dense and composed of particles with sizes of around 500 nm. In contrast, Fig. 3b–d show completely different microstructures for the Pt/WO3, Ag/WO3, and Pt–Ag/WO3 films. The Pt/WO3 film is composed of long, flat strips and isolated islands, while the Ag/WO3 film is composed of long, flat strips with lengths of several micrometers and widths of 1 μm. In the Pt–Ag/WO3 film, the long, flat strips were arranged along the same direction. Overall, the morphologies of the Pt/WO3, Ag/WO3, and Pt–Ag/WO3 films are similar. In addition, a piece of the Pt–Ag/WO3 thin film was peeled off from the ITO substrate and treated ultrasonically for TEM imaging. The corresponding TEM images of the Pt–Ag/WO3 sample are shown in Fig. S1 in ESI.† It can be seen that uniform Pt–Ag nanoparticles with sizes less than 5 nm were obtained.
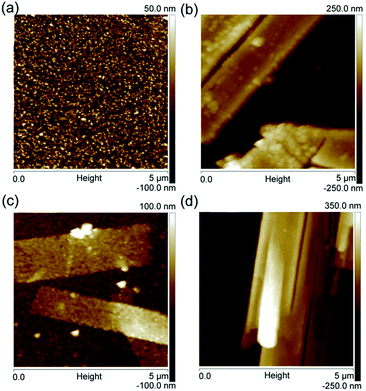
The microstructures of these four samples were further observed at a more local scale using AFM. The scanned areas of the AFM images were 5 μm × 5 μm. Fig. 4a shows that pure WO3 film exhibits small and uniform particle morphologies. In contrast, the Pt/WO3, Ag/WO3, and Pt–Ag/WO3 films are composed of long, flat strips, as shown in Fig. 4b–d, which is consistent with the SEM results in Fig. 3.
To determine the detailed elemental compositions of the samples, the XPS survey spectra of the as-prepared pure WO3, Pt/WO3, Ag/WO3 and Pt–Ag/WO3 thin films were collected and are displayed in Fig. S2 in ESI.† It can be seen that the survey spectrum of pure WO3 is dominated by the signals of W, O, and C (contaminant). The survey spectrum of the Pt/WO3 film confirms the presence of W, O, C, and slight Pt. In addition, an obvious Ag signal was observed in the survey spectrum of the Ag/WO3 sample, while slight Pt and Ag signals were found in that of the Pt–Ag/WO3 sample. It is also noted that the signals of In and Sn were observed, which could be related to the compositions of the ITO substrates.
Fig. 5a shows the high-resolution W 4f core-level spectra of the as-prepared pure WO3, Pt/WO3, Ag/WO3 and Pt–Ag/WO3 samples. The peaks attributed to W 4f5/2 and W 4f7/2 in the spectra of the Pt/WO3, Ag/WO3 and Pt–Ag/WO3 samples clearly shifted to higher binding energies compared to those in the spectrum of pure WO3. This may have resulted from the chemical interaction between Pt, Ag, Pt–Ag and WO3 in the samples of Pt/WO3, Ag/WO3 and Pt–Ag/WO3, respectively. Fig. 5b presents the XPS spectra of Pt 4f for the Pt/WO3 and Pt–Ag/WO3 samples; the Pt 4f5/2 and Pt 4f7/2 peaks were located at 74.6 and 71.4 eV, respectively, indicating that Pt is mainly present in the metallic state in the Pt/WO3 sample.30 The peaks of Pt 4f7/2 and Pt 4f5/2 in the spectrum of the Pt–Ag/WO3 sample were shifted to lower values by approximately 0.6–0.8 eV compared to in the spectrum of the Pt/WO3 sample, suggesting a change in the electronic environment of Pt and a local increase in the electron density on Pt9 in the Pt–Ag/WO3 sample. This might originate from the chemical interaction between Pt and Ag, which decreases the binding energy when Pt atoms act as electron acceptors.31 A similar result is shown in the XPS spectra of Ag 3d for Ag/WO3 and Pt–Ag/WO3 (Fig. 5c). The observation of the Ag 3d3/2 and Ag 3d5/2 peaks at 373.5 and 367.6 eV, respectively, indicates that Ag is mainly present in the metallic state in the Ag/WO3 sample.32 Moreover, the Ag 3d binding energy of the Pt–Ag/WO3 sample shifted to a lower binding energy with respect to that of the Ag/WO3 sample. This is indicative of a change in the electronic structure of Pt upon the formation of the alloy with Ag.19 A similar result was observed in Pt–Cu bimetallic nanoassemblies.33 Furthermore, the elemental surface compositions were determined by XPS. According to the XPS analysis, the contents of Pt and Ag in the Pt–Ag/WO3 thin film are 0.24 and 0.48 atom%, respectively.
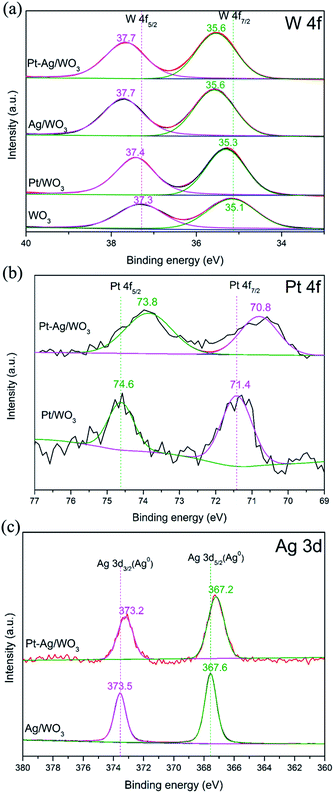 | ||
| Fig. 5 XPS spectra of (a) W 4f and (b) Pt 4f and (c) Ag 3d high-resolution spectra for the different as-prepared samples. | ||
The UV-vis absorption spectra of these different photocatalysts are compared in Fig. 6a. All samples exhibited strong peaks below 400 nm, which are assigned to the inter-band transition of the WO3 film.11 The Pt/WO3 catalyst shows increased absorbance at λ > 300 nm due to the scattering of light by the Pt particles.34,35 The Ag/WO3 sample shows a slightly broadened peak around 450–650 nm, which is assigned to the surface plasmon resonance effect of the metallic Ag particles.36–38 It is also noted that the plasmon resonance absorbance of Ag particles was not distinct, which might result from the low content of Ag in the Ag/WO3 catalyst. Additionally, the Pt–Ag/WO3 catalysts exhibit similar absorption spectra as the Ag/WO3 catalyst due to the slight surface plasmon resonance effect of the metallic Ag particles. The band gap energies (Eg) of these samples were calculated from the absorption data using the following equation:
| αhν = A(hν − Eg)n, | (1) |
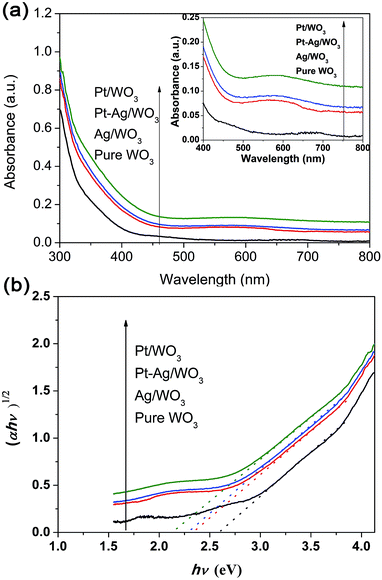 | ||
| Fig. 6 (a) UV-vis diffuse reflectance absorption spectra of the as-prepared samples (the inset shows the region from 400 to 800 nm). (b) Plots of (αhν)1/2 versus photon energy hν of these samples. | ||
MB was used as a target pollutant to evaluate the photocatalytic activity of the as-prepared samples because the self-degradation of MB is negligible under visible light (see Fig. 7a). The variation in the absorption intensity of MB dye solution over pure WO3, Pt/WO3, Ag/WO3 and Pt–Ag/WO3 thin films at different irradiation times is recorded in Fig. S3 in ESI.† It can be seen that the maximum absorption of MB dye solution is at 664 nm, and the intensity of the absorption peak decreased with increasing irradiation time for each sample. Based on these changes in absorption intensity, the photocatalytic degradation ratios of MB solution in the presence of pure WO3, Pt/WO3, Ag/WO3 and Pt–Ag/WO3 thin films are expressed in Fig. 7a. It can be seen that the photocatalytic degradation efficiency follows the order: Pt–Ag/WO3 > Pt/WO3 > Ag/WO3 > pure WO3. It is clear that the Pt–Ag/WO3 thin film shows the best photocatalytic activity. About 98% of the initial MB decomposed after 120 min in the presence of the Pt–Ag/WO3 thin film, whereas ∼60% of the dye molecules were decomposed over the pure WO3 thin film after the same time period. In addition, about 95% and 90% of the initial MB molecules were decomposed by Pt/WO3 and Ag/WO3 thin films after 120 min, respectively. Although the concentration of MB was low (5 mg L−1), a long irradiation time (nearly 120 min) was needed for the complete degradation of MB in the presence of the Pt–Ag/WO3 thin film. This is because the thin-film photocatalyst is deposited on a substrate, leading to a significant decrease in the absorption of light and contact with pollutant molecules. Therefore, the photocatalytic activities of thin films are often lower than those of powder photocatalysts. However, thin-film photocatalysts can be repeatedly used without complicated recycling processes, which are required for conventional powder photocatalysts, and are hardly lost during photocatalytic reactions; these are the main advantages of thin-film photocatalysts.
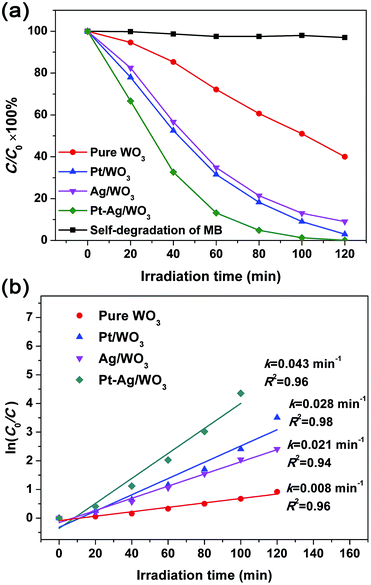 | ||
| Fig. 7 (a) Photocatalytic degradation ratio of MB solution in the presence of pure WO3, Pt/WO3, Ag/WO3 and Pt–Ag/WO3 thin films. (b) Plots of ln(C0/C) versus irradiation time. | ||
The degradation of dyes was reported to proceed via a pseudo-first order reaction with a Langmuir–Hinshelwood model when the initial concentration (C0) of the dye solution is small:39
| ln(C0/C) = kt, | (2) |
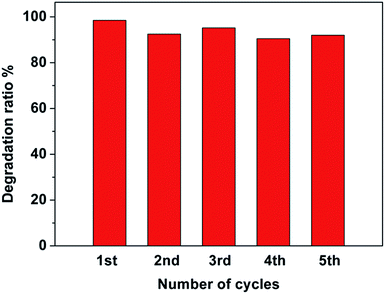
To investigate the photocatalytic stability of the Pt–Ag/WO3 thin film, cycling runs for the photocatalytic degradation of MB was carried out, and the results are displayed in Fig. 8. It is found that the Pt–Ag/WO3 thin film maintains a high photocatalytic degradation ratio (above 90%), even after five cycles. This result clearly indicates that the Pt–Ag/WO3 thin film possesses excellent photocatalytic stability for MB degradation.
EIS analysis is a powerful tool for studying the charge-transfer processes. The EIS Nyquist plots of the four samples are shown in Fig. 9a. It is clear that the Pt–Ag/WO3 film showed a smaller semicircle than the pure WO3, Pt/WO3 and Ag/WO3 electrodes, indicating that the introduction of Pt–Ag alloy nanoparticles greatly benefited charge transfer; that is, Pt–Ag alloy nanoparticles were more effective in trapping the electrons from the CB of WO3. Mott–Schottky experiments were carried out using the pure WO3, Pt/WO3, Ag/WO3, and Pt–Ag/WO3 thin-film electrodes (Fig. 9b). All four samples showed positive slopes in the Mott–Schottky plots, indicating that the as-prepared pure WO3, Pt/WO3, Ag/WO3, and Pt–Ag/WO3 films are n-type semiconductors. Importantly, the Pt–Ag/WO3 film sample exhibited the smallest slope in the Mott–Schottky plot, suggesting that the photogenerated electrons had the fastest charge-transfer rate.41 These results further confirm that compared with the pure WO3, Pt/WO3, and Ag/WO3 films, the Pt–Ag/WO3 film better promotes charge transfer and thus significantly enhances the photocatalytic activity.
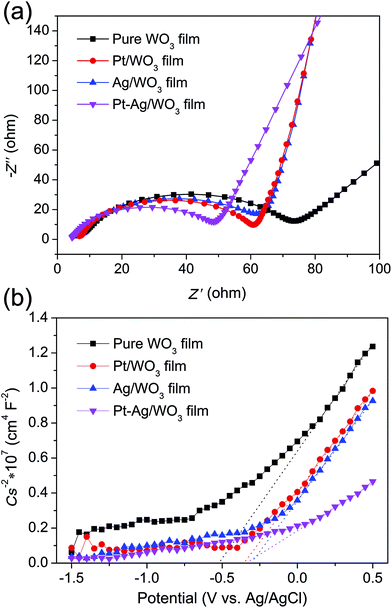 | ||
| Fig. 9 EIS Nyquist plots (a) and Mott–Schottky plots (b) of the pure WO3, Pt/WO3, Ag/WO3, and Pt–Ag/WO3 thin-film electrodes. | ||
For a photocatalytic reaction, it is necessary to ensure that active species are generated during the photo-degradation process. It is known that the active species can be identified by free radical- and hole-trapping experiments. In our case, BQ, EDTA–2Na, and t-BuOH were used as the superoxide radical (˙O2−) scavenger, hole (h+) scavenger, and hydroxyl radical (˙OH) scavenger, respectively.42–44 Fig. 10 shows the influence of the different scavengers on the visible-light photocatalytic activity of the Pt–Ag/WO3 thin film toward MB degradation. Compared with the Pt–Ag/WO3 system without scavenger, the degradation rate of MB is hardly inhibited after the addition of BQ (1 mM) in the reaction system. In contrast, in the presence of EDTA–2Na (1 mM), the degradation rate of MB is obviously decreased. Moreover, the photocatalytic activity of the Pt–Ag/WO3 film was greatly decreased by the addition of t-BuOH. These results indicate that h+ is one of the active species, while ˙OH is the main active species responsible for the oxidization of MB under visible-light irradiation. As for ˙O2−, it is hardly generated in the Pt–Ag/WO3 photocatalytic system.
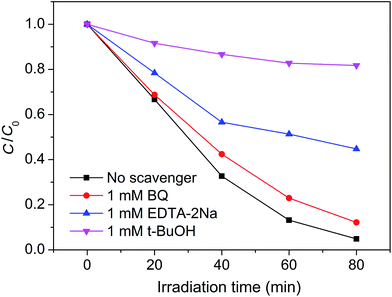 | ||
| Fig. 10 Plots of photogenerated carrier trapping during the photodegradation of MB by Pt–Ag/WO3 thin film under visible-light irradiation. | ||
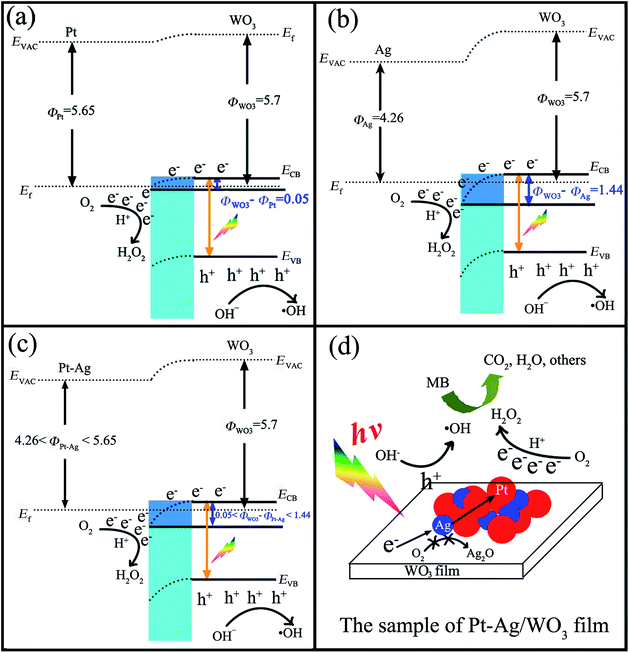
Investigations on the enhanced photocatalytic mechanism are necessary to understand the enhanced photocatalytic activity. Here, we discuss it in detail based on the band structure and work functions. It was reported that the work functions (Φ) of WO3 film, metallic Pt, and metallic Ag are 5.7 eV,45–47 5.65 eV,48 and 4.26 eV,49 respectively. In addition, the work function of the bimetallic alloy can be expressed by the sum of the work functions of the two metal components,50 which means that the work function of the alloy lies at a level intermediate between monometallic Pt and Ag (4.26 eV < ΦPt–Ag < 5.65 eV). If Pt, Ag or Pt–Ag contacts WO3, the electrons will migrate from Pt or Ag or Pt–Ag to the CB of WO3 to achieve Fermi level equilibration. As a result, the surface of WO3 accumulates excess electrons, while Pt or Ag or Pt–Ag exhibits excess positive charge, and a deflexed energy band forms at the Pt/WO3, Ag/WO3 or Pt–Ag/WO3 interface. As shown in Scheme 2a–c, the difference between the work functions of WO3 and noble metal (ΦWO3–ΦM) at the Pt/WO3, Ag/WO3 or Pt–Ag/WO3 junction is determined to be only about 0.05 eV, 1.44 eV, and 0.05–1.44 eV, respectively. When WO3 catalysts are illuminated under visible light, photo-generated electrons (e−) in the valence band (VB) of WO3 can be excited to the CB; simultaneously, the same amount of holes (h+) are generated in the VB. Moreover, the deflexed energy band in the space charge region facilitates the rapid transfer of the as-excited electrons from WO3 to Pt or Ag or Pt–Ag nanoparticles, which decreases the recombination of the photogenerated electron–hole pairs. In the Pt/WO3 and Ag/WO3 samples, since WO3 has a low CB level (+0.5 V vs. NHE) that is more positive than the potential for the single-electron reduction of oxygen,8 electrons accumulated at Pt or Ag nanoparticles may be transferred to surface-adsorbed oxygen molecules to form H2O2 via the multi-electron reduction of O2.16 In the Pt–Ag/WO3 sample, an electron donation from Ag to Pt could occur because Pt (2.28) is more electronegative than Ag (1.93), leading to an increase in the electron density of Pt atoms. That is to say, the photogenerated electron from the CB of WO3 could first transfer to Ag and then to Pt, promoting the efficient two-electron reduction of O2 in the Pt–Ag/WO3 sample compared to in the Pt/WO3 and Ag/WO3 samples, as shown in Scheme 2d. Moreover, this process leads to the two-electron reduction of O2 occurring on the surface of Pt instead of Ag, preventing contact between Ag and O2 and thus avoiding the oxidation of Ag in the Pt–Ag/WO3 sample during photodegradation in air. These alloying effects result in the increased formation of H2O2 on the Pt–Ag/WO3 catalyst, similar to in a Au–Ag/TiO2 catalyst.51 On the other hand, the leaving h+ with high oxidation potential (+3 V vs. NHE)52 are apt to react with surface-bound H2O or OH− to produce ˙OH, which is consistent with the results of the photogenerated carrier-trapping experiment (Fig. 10). Additionally, it was reported that H2O2 can degrade dye molecules.6 As a result, the adsorbed MB molecules can be effectively degraded by these reactive oxidative species, including ˙OH and H2O2, over the Pt–Ag/WO3 film photocatalyst under visible-light irradiation.
4. Conclusions
In this work, Pt/WO3, Ag/WO3, and Pt–Ag/WO3 thin films were successfully synthesized by a three-step method involving the formation of a homogeneous precursor sol, spin coating as well as UV-light reduction, and calcination. The as-prepared Pt/WO3, Ag/WO3, and Pt–Ag/WO3 thin films showed similar morphologies mainly composed of long, flat strips. The XPS results suggested a change in the electronic structure of Pt upon alloying with Ag. Moreover, the EIS and MS plots demonstrated that the Pt–Ag/WO3 thin film can promote charge transfer and thus significantly enhance the photocatalytic activity compared with the Pt/WO3 and Ag/WO3 thin films. Active species-capture experiments indicated that ˙OH was the main active species responsible for the oxidization of MB. What's more, the photogenerated electrons from the CB of WO3 could first transfer to Ag and then to Pt, promoting the efficient two-electron reduction of O2 in the Pt–Ag/WO3 sample compared to in the Pt/WO3 and Ag/WO3 samples. Additionally, the effects of Pt–Ag alloy nanoparticles on the photocatalytic activity of WO3 thin film are significant, and corresponding investigations of this subject are in progress.Acknowledgements
This work is financially supported by the National Natural Science Foundation of China (Grant No. 21403184), Natural Science Foundation of the Jiangsu Higher Education Institutions of China (Grant No. 14KJB150025), China Postdoctoral Science Foundation (No. 2014M561622), Jiangsu Collaborative Innovation Center for Ecological Building Materials and Environmental Protection Equipment (No. CP201502 and GX2015102), Natural Science Foundation of Jiangsu Province (BK20150428 and BK20160434), and National Key Research and Development Project of China (No. 2016YFC0209202).Notes and references
- K. Hashimoto, H. Irie and A. Fujishima, Jpn. J. Appl. Phys., 2005, 44, 8269 CrossRef CAS.
- K. Nakata and A. Fujishima, J. Photochem. Photobiol., C, 2012, 13, 169–189 CrossRef CAS.
- C. Janáky, K. Rajeshwar, N. De Tacconi, W. Chanmanee and M. Huda, Catal. Today, 2013, 199, 53–64 CrossRef.
- G. R. Bamwenda and H. Arakawa, Appl. Catal., A, 2001, 210, 181–191 CrossRef CAS.
- K. Sayama, H. Hayashi, T. Arai, M. Yanagida, T. Gunji and H. Sugihara, Appl. Catal., B, 2010, 94, 150–157 CrossRef CAS.
- B. Weng, J. Wu, N. Zhang and Y.-J. Xu, Langmuir, 2014, 30, 5574–5584 CrossRef CAS PubMed.
- A. Tanaka, K. Hashimoto and H. Kominami, J. Am. Chem. Soc., 2014, 136, 586–589 CrossRef CAS PubMed.
- R. Abe, H. Takami, N. Murakami and B. Ohtani, J. Am. Chem. Soc., 2008, 130, 7780–7781 CrossRef CAS PubMed.
- J. Wang, Z. Wang and C.-J. Liu, ACS Appl. Mater. Interfaces, 2014, 6, 12860–12867 CAS.
- Y. Shiraishi, Y. Sugano, S. Ichikawa and T. Hirai, Catal. Sci. Technol., 2012, 2, 400–405 CAS.
- M. Miyauchi, Phys. Chem. Chem. Phys., 2008, 10, 6258–6265 RSC.
- A. Fujii, Z. Meng, C. Yogi, T. Hashishin, T. Sanada and K. Kojima, Surf. Coat. Technol., 2015, 271, 251–258 CrossRef CAS.
- T. Ohashi, T. Sugimoto, K. Sako, S. Hayakawa, K. Katagiri and K. Inumaru, Catal. Sci. Technol., 2015, 5, 1163–1168 CAS.
- G. Xi, J. Ye, Q. Ma, N. Su, H. Bai and C. Wang, J. Am. Chem. Soc., 2012, 134, 6508–6511 CrossRef CAS PubMed.
- P. Dong, N. Xu, Y. Xu and X. Wang, Catal. Commun., 2016, 84, 142–146 CrossRef CAS.
- S. Sun, W. Wang, S. Zeng, M. Shang and L. Zhang, J. Hazard. Mater., 2010, 178, 427–433 CrossRef CAS PubMed.
- W. He, X. Wu, J. Liu, K. Zhang, W. Chu, L. Feng, X. Hu, W. Zhou and S. Xie, J. Phys. Chem. C, 2009, 113, 10505–10510 CAS.
- K. Kim, K. L. Kim and K. S. Shin, J. Phys. Chem. C, 2011, 115, 23374–23380 CAS.
- J. Xu, T. Zhao and Z. Liang, J. Phys. Chem. C, 2008, 112, 17362–17367 CAS.
- Z. Jiao, J. Wang, L. Ke, X. W. Sun and H. V. Demir, ACS Appl. Mater. Interfaces, 2011, 3, 229–236 CAS.
- S. H. Baeck, K. S. Choi, T. F. Jaramillo, G. D. Stucky and E. W. McFarland, Adv. Mater., 2003, 15, 1269–1273 CrossRef CAS.
- N. Oka, A. Murata, S.-i. Nakamura, J. Jia, Y. Iwabuchi, H. Kotsubo and Y. Shigesato, APL Mater., 2015, 3, 104407 CrossRef.
- M. Choobtashani and O. Akhavan, Appl. Surf. Sci., 2013, 276, 628–634 CrossRef CAS.
- H. Katsumata, K. Inoue, T. Suzuki and S. Kaneco, Catal. Lett., 2014, 144, 837–842 CrossRef CAS.
- J. Y. Zheng, G. Song, J. Hong, T. K. Van, A. U. Pawar, D. Y. Kim, C. W. Kim, Z. Haider and Y. S. Kang, Cryst. Growth Des., 2014, 14, 6057–6066 CAS.
- D. Vernardou, H. Drosos, E. Spanakis, E. Koudoumas, C. Savvakis and N. Katsarakis, J. Mater. Chem., 2011, 21, 513–517 RSC.
- A. Srinivasan and M. Miyauchi, J. Phys. Chem. C, 2012, 116, 15421–15426 CAS.
- G. Leftheriotis, M. Liveri, M. Galanopoulou, I. D. Manariotis and P. Yianoulis, Thin Solid Films, 2014, 573, 6–13 CrossRef CAS.
- V. A. Pereira Jr, I. N. Q. de Arruda and R. Stefani, Food Hydrocolloids, 2015, 43, 180–188 CrossRef.
- G. P. Jin, X. Peng, Y. F. Ding, W. Q. Liu and J. M. Ye, J. Solid State Electrochem., 2009, 13, 967–973 CrossRef CAS.
- L. Qiu, F. Liu, L. Zhao, W. Yang and J. Yao, Langmuir, 2006, 22, 4480–4482 CrossRef CAS PubMed.
- Z. Jiang and J. Xie, RSC Adv., 2015, 6, 3186–3197 RSC.
- G. Fu, H. Liu, N. You, J. Wu, D. Sun, L. Xu, Y. Tang and Y. Chen, Nano Res., 2016, 9, 755–765 CrossRef CAS.
- Y. Shiraishi, Y. Sugano, S. Tanaka and T. Hirai, Angew. Chem., 2010, 122, 1700–1704 CrossRef.
- Y. Shiraishi, Y. Takeda, Y. Sugano, S. Ichikawa, S. Tanaka and T. Hirai, Chem. Commun., 2011, 47, 7863–7865 RSC.
- H. M. Coleman, K. Chiang and R. Amal, Chem.–Eur. J., 2005, 113, 65–72 CAS.
- H. Zhang, G. Wang, D. Chen, X. Lv and J. Li, Chem. Mater., 2008, 20, 6543–6549 CrossRef CAS.
- Y. Han, J. Zhou, W. Wang, H. Wan, Z. Xu, S. Zheng and D. Zhu, Appl. Catal., B, 2012, 125, 172–179 CrossRef CAS.
- X. Wang, J.-G. Li, H. Kamiyama, Y. Moriyoshi and T. Ishigaki, J. Phys. Chem. B, 2006, 110, 6804–6809 CrossRef CAS PubMed.
- P. Dong, Y. Wang, H. Li, H. Li, X. Ma and L. Han, J. Mater. Chem. A, 2013, 1, 4651–4656 CAS.
- F. Su, T. Wang, R. Lv, J. Zhang, P. Zhang, J. Lu and J. Gong, Nanoscale, 2013, 5, 9001–9009 RSC.
- C. Chen, Q. Wang, P. Lei, W. Song, W. Ma and J. Zhao, Environ. Sci. Technol., 2006, 40, 3965–3970 CrossRef CAS PubMed.
- C. Pan and Y. Zhu, Environ. Sci. Technol., 2010, 44, 5570–5574 CrossRef CAS PubMed.
- H. Lee and W. Choi, Environ. Sci. Technol., 2002, 36, 3872–3878 CrossRef CAS PubMed.
- G. Vida, V. Josepovits, M. Gyor and P. Deak, Microsc. Microanal., 2003, 9, 337–342 CrossRef CAS PubMed.
- A. Yella, U. K. Gautam, E. Mugnaioli, M. Panthöfer, Y. Bando, D. Golberg, U. Kolb and W. Tremel, CrystEngComm, 2011, 13, 4074–4081 RSC.
- K. Cheng, Z. Qiao, S. Pang, S. Wang, X. Han and Z. Du, Appl. Phys. Express, 2012, 5, 105801–105803 CrossRef.
- H. B. Michaelson, J. Appl. Phys., 1977, 48, 4729–4733 CrossRef CAS.
- C.-M. Chen, C.-M. Liu, K.-H. Wei, U. S. Jeng and C.-H. Su, J. Mater. Chem., 2012, 22, 454–461 RSC.
- R. Ishii, K. Matsumura, A. Sakai and T. Sakata, Appl. Surf. Sci., 2001, 169–170, 658–661 CrossRef CAS.
- D. Tsukamoto, A. Shiro, Y. Shiraishi, Y. Sugano, S. Ichikawa, S. Tanaka and T. Hirai, ACS Catal., 2012, 2, 599–603 CrossRef CAS.
- T. Arai, M. Yanagida, Y. Konishi, Y. Iwasaki, H. Sugihara and K. Sayama, J. Phys. Chem. C, 2007, 111, 7574–7577 CAS.
Footnote |
| † Electronic supplementary information (ESI) available: Details of electrochemical measurement, TEM images of Pt–Ag/WO3 sample, the survey XPS spectra of as-prepared samples, UV-vis absorption spectra of MB solutions. See DOI: 10.1039/c6ra25272a |
| This journal is © The Royal Society of Chemistry 2017 |


