Effects of dysprosium oxide nanoparticles on Escherichia coli†
N. M.
Anaya
,
F.
Solomon
and
V.
Oyanedel-Craver
*
Department of Civil and Environmental Engineering, Bliss hall 203, University of Rhode Island, Kingston, RI 02881, USA. E-mail: nelson_anaya@my.uri.edu; fsolomon@my.uri.edu; craver@uri.edu; Fax: +1 401 874 2786; Tel: +1 401 874 2784
First published on 8th September 2015
Abstract
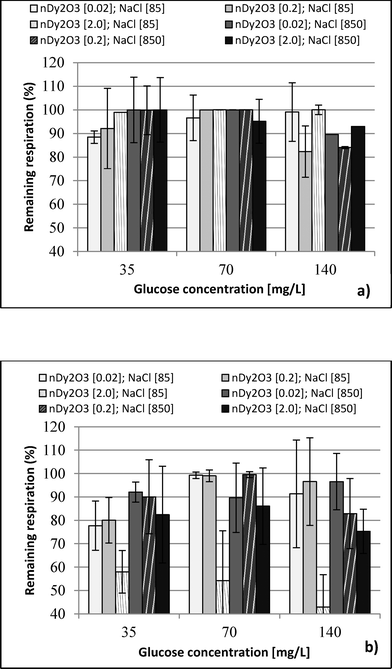
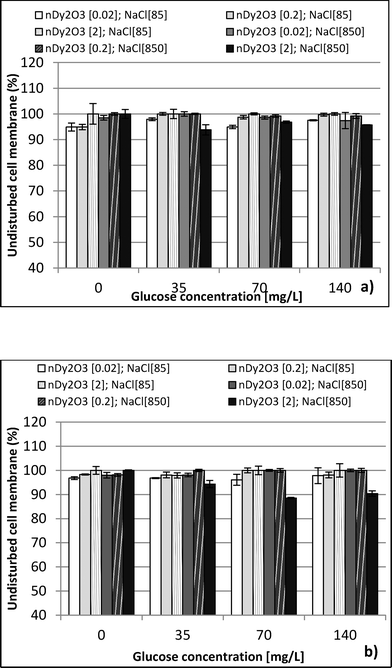
There is increasing interest in the study of dysprosium oxide nanoparticles (nDy2O3) for biomedical applications due to their fluorescence and paramagnetic properties. However, the fate of nDy2O3 and their effects on natural biological systems are a growing concern. This study assessed the toxicity of nDy2O3 on Escherichia coli for concentrations between 0.02 and 2 mg L−1, exposed to three concentrations of NaCl (8500, 850, and 85 mg L−1) and three glucose concentrations (35, 70, and 140 mg L−1). The ranges of these variables were selected to cover manufacturer recommendations of analytical methodologies for toxicity assessment, environmental and industrial nDy2O3 effluent concentrations, and metabolic activity. Two array-based toxicity techniques were used to evaluate the 27 combinations of conditions. Fluorescent dyes (Live/Dead) and respirometric assays were used to measure the undisturbed cell membrane (UCM) and remaining respiration percentage (RRP), respectively. Respirometric tests showed a higher toxic effect than Live/Dead test assays, indicating that metabolic processes are more affected than the physical structure of the cell by exposure to nDy2O3. After exposing the bacteria to concentrations of 2.0 mg L−1 uncoated nDy2O3 for 2 h at 85 mg L−1 NaCl and 140 mg L−1 glucose, the RRP and UCM decreased to 43% and 88%, respectively. Dysprosium ion (Dy+3) toxicity measurement suggested that Dy+3 was the main contributor to the overall toxicity.
Nano impactThis study offers new insights into dysprosium oxide nanoparticle (nDy2O3) exposure on E. coli with respect to its metabolic activity and structural integrity. The toxicity of nDy2O3 was evaluated for two array-based techniques, Live/Dead and respirometric assays. Our work is novel since new nDy2O3 toxicity data were produced covering manufacturer recommendations for toxicity assessments, environmental and industrial nDy2O3 effluent concentrations and metabolic activity. This is highly relevant to the evaluation of the toxic effect of nanoparticles since the physicochemical properties of the nanoparticles can differ greatly depending on the physicochemical characteristics of the aqueous solution. With an understanding of the nanoparticles' fate in aqueous medium, a careful selection of appropriate toxicological methodologies can be made to improve the accuracy of future nanotoxicological studies. |
1. Introduction
Gadolinium, holmium and dysprosium belong to the lanthanide oxide-based nanoparticles (LnONps), which have acquired more relevance in recent years in regard to the location, diagnosis and treatment of diseases.1–3 LnONps have unique paramagnetic properties that allow greater spatial and temporal resolution through a higher signal-to-noise ratio. These properties play a fundamental role in acquiring and enhancing the contrast in T1 or T2 magnetic resonance images (MRI).4,5 Due to the higher sensitivity provided by the LnONps, the MRI contrast is improved and the T1 or T2 relaxation times are discriminatorily shortened in the region of interest.6Dysprosium oxide nanoparticles (nDy2O3) have recently received increasing attention due to their potential applications in the biomedical field4,5 including cancer research, new drug screening, and the delivery of drug applications.2,7,8 However, the fate of nDy2O3 and their effects on natural biological systems are growing concerns.9 nDy2O3 will enter into aquatic and land environments through wastewater treatment facility effluent and wastewater sludge due to an inability to retain and or remove these nanoparticles completely.10 Moreover, the release of nDy2O3 into land environments from agricultural applications could transport nanoparticles to surface waters via storm water runoff and to groundwater via infiltration through the soil.10,11
Previous studies have provided limited insight into the toxic effects of nDy2O3 and Dy ions on natural systems. Kattel et al.12 investigated the in vitro toxicity effect of ultra-small spherical dysprosium oxide and dysprosium hydroxide nanorods.5 Both nanoparticles were coated with D-glucuronic acid and exposed to DU 145 and NTC 1469 cell lines. These studies showed that the nanoparticles were not toxic to the human cells for concentration values ranging from 0 to 37.3 mg L−1.
Harper et al.13 tested 11 types of metal oxide nanoparticles, including nDy2O3, and found that high mortality of embryonic zebrafish was observed when they were exposed to 250 mg L−1 nDy2O3 for 5 days of continuous waterborne conditions. In addition, concentrations of 250 mg L−1 for nDy2O3 produced morphological malformations of the zebrafish's jaw and eyes.
Toxicological assessment of nanoparticles can be studied in terms of their impact on metabolic functions and cell structure such as cell viability, membrane permeation, growth and respiration. Live/Dead assay (BacLight viability kit) is a commonly used method to measure cell viability14 and membrane permeation on bacteria through the integrity of cell membranes. The manufacturer of the reagents used for the Live/Dead test recommends that experiments and samples have to be prepared in specific water chemistry conditions (8500 mg L−1 NaCl) to avoid a decrease in staining efficiency.14 Previously, the metabolic activity of bacteria has been measured using a traditional respirometric bottle test (RT). Water chemistry conditions with monovalent and divalent cations have been successfully used in the range of 10 to 1000 mg L−1; however, high concentrations of glucose (in the order of 300 mg L−1) and bacteria (in the order of 109 CFU mL−1) were required to quantify a toxic response.15 This type of test can be used to measure the interaction and effect of nanoparticles on microorganisms. Nevertheless, each methodology required its own range of optimal conditions, which makes it a complex process to assess toxic effects when identical water chemistry conditions are used. This is highly relevant to the evaluation of the toxic effect of nanoparticles since the physicochemical properties of the nanoparticles (e.g., charge, aggregation, cell–nanoparticle ratio and dissolution) can differ among each other and also their properties are influenced by the physicochemical characteristics of the aqueous solution.
In this study, we propose to evaluate the use of array-based dye methods in identical water chemistry conditions and observe the effect of nDy2O3 and exposure on E. coli metabolic activity and structural integrity of E. coli under variable water chemistry conditions.
2. Materials and methods
2.1 Materials
A non-pathogenic wild strain of E. coli (IDEXX Laboratories) was selected for this study. E. coli is a Gram-negative bacterium that has been found to be metabolically active in saline solution without growth16 and has been extensively studied in nanotoxicological research.15,17,18 Reagents used to prepare the growth medium for the bacteria – sodium chloride (NaCl), yeast extract, and tryptone – were purchased from Sigma Aldrich. Glucose was purchased from Sigma Aldrich and used as received. Tetrazolium dye (Redox Dye Mix A) was purchased from Biolog and used to measure the respiratory responses of E. coli. Cell membrane permeation was measured using SYTO 9 and propidium iodide; both reagents were purchased from Invitrogen.2.2 Methods
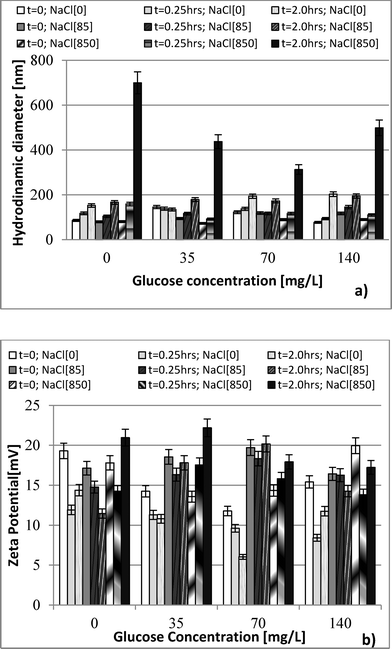
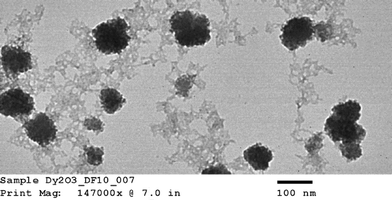
Hydrodynamic diameter and zeta potential were measured by dynamic light scattering (DLS) using a Malvern Zetasizer Nano ZS, ZEN 3600 instrument. Data were collected at 0.25 h and at 2 h after nanoparticle exposure to bacteria to differentiate the effect of aggregation of nanoparticles. Shape characterization of the nanoparticle was obtained by using JEOL JEM-2100 LaB6 transmission electron microscope (TEM) imaging. Ionic release from nDy2O3 for each condition was quantified as per Liu and Hurt19 using centrifugal ultrafilter devices (Ultra-4 3K) purchased from Amicon. Inductively coupled plasma spectroscopy (ICP-OES Optima 3100, Perkin Elmer) was used to measure the concentration of nDy2O3 and Dy ions before and after the contact times established for each of the water chemistry conditions tested. Samples were digested in nitric acid (HNO3, 2% v/v) before analysis.The growth medium consisted of 10 g L−1 NaCl, 5 g L−1 yeast extract, and 10 g L−1 tryptone. After the solution was prepared, it was autoclaved and then E. coli seed was added. E. coli was grown for 12 h in a culture medium at 37 °C. Bacteria were harvested during the logarithmic growth phase and centrifuged at 2000 rpm for 0.25 h. The supernatant was discarded and the pellet re-suspended in the respective NaCl solution.15E. coli concentration was fixed to OD670 (optical density at a wavelength of 670 nm) of 2.68 using the respective NaCl solution. E. coli solutions were refrigerated at least 30 min prior to inoculation into the microplate in order to decrease the metabolism of the bacteria. This allowed for a homogenous metabolic reaction to the glucose.
Three NaCl concentrations were selected: 85, 850 and 8500 mg L−1 (ionic strength 1.45, 14.5 and 145 mM, respectively). The lowest concentration represents the ionic strength commonly found in surface waters,20 while the highest NaCl concentration was selected based on the manufacturer's recommendations of the Live/Dead test.14 The middle value was chosen for a three-tier comparison. Glucose concentrations in the range of 35 to 140 mg L−1 were used as a carbon source to evaluate nDy2O3 toxicity under different aerobic metabolic levels. Preliminary experiments were carried out to determine the glucose concentrations that inhibit the E. coli metabolic functions. The glucose concentration of 35 mg L−1 was the lowest limit of respiratory detection, and 140 mg L−1 was below the concentration (210 mg L−1) that produces an inhibitory effect on E. coli.
Three concentrations of non-coated Dy2O3 nanoparticles – 0.02, 0.2 and 2.0 mg L−1 – were used to simulate not only environmental concentrations (0.02 mg L−1) but also accidental spill scenarios (2.0 mg L−1). Non-coated Dy2O3 nanoparticles were prepared based on the method used by Kattel et al.12
Table 1 shows the 27 conditions and the blanks tested in this study for the respirometric and Live/Dead tests using a Synergy™ Mx Microplate Reader. Blanks without nDy2O3, glucose and NaCl were analyzed for each scenario.
| NaCl [mg L−1] | Glucose [mg L−1] | nDy2O3 [mg L−1] |
|---|---|---|
| 0* | 0* | 0.02, 0.2, 2 |
| 35 | 0*, 0.02, 0.2, 2 | |
| 70 | 0*, 0.02, 0.2, 2 | |
| 140 | 0*, 0.02, 0.2, 2 | |
| 85 | 0* | 0.02, 0.2, 2 |
| 35 | 0*, 0.02, 0.2, 2 | |
| 70 | 0*, 0.02, 0.2, 2 | |
| 140 | 0*, 0.02, 0.2, 2 | |
| 850 | 0* | 0.02, 0.2, 2 |
| 35 | 0*, 0.02, 0.2, 2 | |
| 70 | 0*, 0.02, 0.2, 2 | |
| 140 | 0*, 0.02, 0.2, 2 | |
| 8500 | 0* | 0.02, 0.2, 2 |
| 35 | 0*, 0.02, 0.2, 2 | |
| 70 | 0*, 0.02, 0.2, 2 | |
| 140 | 0*, 0.02, 0.2, 2 |
2.3 Toxicity tests
The microplate included a nDy2O3 blank and background correction sections to evaluate the interaction between nanoparticles and tetrazolium dye. Lack of coloration in the nDy2O3 blank section indicated that no interaction was observed between nDy2O3 and the tetrazolium dye. For the background (absorbance of nDy2O3) correction, the value obtained in the respective well was subtracted from the experiment values and also served as a secondary control to confirm that experimental conditions had no reducing effect on the tetrazolium dye without the presence of bacteria.
Each plate was set up in quadruplicate wells for each condition, and the plates were run in duplicate to quantify the percent of remaining respiration (PRR). The PRR (eqn (1)) is the ratio of slopes between bacteria exposed to nDy2O3 and the blank bacteria (samples containing bacteria that were not exposed to nDy2O3) at a specific nDy2O3 concentration from the absorbance–time graph.
 | (1) |
![[thin space (1/6-em)]](https://www.rsc.org/images/entities/char_2009.gif) :
:![[thin space (1/6-em)]](https://www.rsc.org/images/entities/char_2009.gif) 1 (v/v) ratio with a subsequent dilution in DI water (12 μL of mixed stain solution in 2 mL of DI water). Suspension mixtures of NaCl, glucose, nDy2O3, and bacteria were added into separate wells of a 96-well flat-bottom black microplate to achieve the required concentrations. The plate was incubated at 25 °C for 2.0 h, during which horizontal shaking (medium setting) was performed by the microplate every 0.25 h. After incubation, 100 μL of mixed stain solution was added and mixed thoroughly by pipetting at least 10 times for each well. Before reading with the microplate, 0.25 h of additional incubation was required in the dark at room temperature. A detailed description of the microplate setup is presented in the ESI.† Each plate contained quadriplicate wells for each condition, and each plate was run in duplicate to quantify the undisturbed cell membrane (UCM). The UCM (eqn (2)) is the green/red fluorescence ratio between bacteria exposed to nDy2O3 and the blank bacteria (bacteria not exposed to nDy2O3) at given nDy2O3 concentration. Data were analyzed at 0.25 and 2 h to differentiate the effect of aggregation of nanoparticles.
1 (v/v) ratio with a subsequent dilution in DI water (12 μL of mixed stain solution in 2 mL of DI water). Suspension mixtures of NaCl, glucose, nDy2O3, and bacteria were added into separate wells of a 96-well flat-bottom black microplate to achieve the required concentrations. The plate was incubated at 25 °C for 2.0 h, during which horizontal shaking (medium setting) was performed by the microplate every 0.25 h. After incubation, 100 μL of mixed stain solution was added and mixed thoroughly by pipetting at least 10 times for each well. Before reading with the microplate, 0.25 h of additional incubation was required in the dark at room temperature. A detailed description of the microplate setup is presented in the ESI.† Each plate contained quadriplicate wells for each condition, and each plate was run in duplicate to quantify the undisturbed cell membrane (UCM). The UCM (eqn (2)) is the green/red fluorescence ratio between bacteria exposed to nDy2O3 and the blank bacteria (bacteria not exposed to nDy2O3) at given nDy2O3 concentration. Data were analyzed at 0.25 and 2 h to differentiate the effect of aggregation of nanoparticles. | (2) |
2.4 Statistical analysis
The results from each data set were analyzed with SAS statistical software, version 9.1.2. A generalized linear mixer model (GLIMMIX) was used to identify statistical differences among glucose, NaCl, and nDy2O3 concentrations because the response was not necessarily normally distributed. A p value of less than 0.05 was considered to indicate significant difference.3. Results and discussion
3.1 Physiochemical characterization of nDy2O3
3.2. Toxicity tests
Respirometric tests at 8500 mg L−1 NaCl detected interference between tetrazolium dye and NaCl. Bacteria at 85 and 850 mg L−1 NaCl without stress conditions maintained an absorbance value after the dye was reduced. On the other hand, bacteria at 8500 mg L−1 showed the opposite behaviour (see the ESI†). Interference with glucose was discarded because Live/Dead tests showed no problems under similar condition. Although absorbance measurements could not be obtained at high NaCl concentration, it is known that E. coli may survive under high ionic strength conditions similar to those presented in this study.26–28| NaCl [mg/L] | Glucose [mg/L] | Dy ions [mg/L] | ||
|---|---|---|---|---|
| t = 0 h | t = 0.25 h | t = 2 h | ||
| 85 | 35 | 0.40 | 0.65 | 0.70 |
| 70 | 0.42 | 0.68 | 0.72 | |
| 140 | 0.43 | 0.69 | 0.75 | |
| 850 | 35 | 0.47 | 0.64 | 0.73 |
| 70 | 0.48 | 0.68 | 0.75 | |
| 140 | 0.49 | 0.68 | 0.79 | |
3.3. Comparison between toxicology methodologies
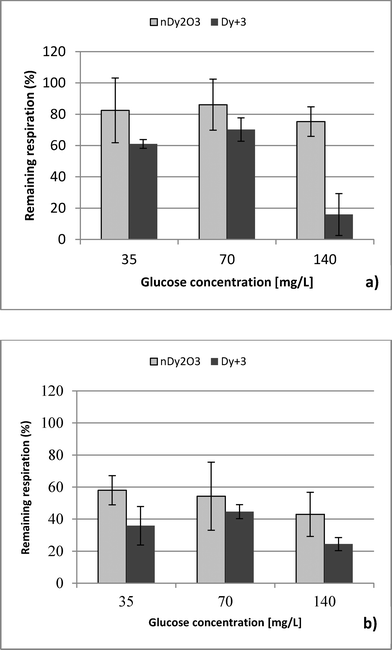
This study performed a comparison between two toxicological tests using nDy2O3 on E. coli. It was found that for both methodologies, and at the same conditions, nDy2O3 is most toxic at high concentrations (2.0 mg L−1). The respirometric test showed a more prominent response (PRR = 43%) compared to Live/Dead (UCM = 88%) test. This indicates that metabolic responses are more sensitive to toxicity than cell physiology when bacteria are exposed to nDy2O3.Statistical analysis (for details, see the ESI†) confirmed a correlation – first with the nDy2O3 concentrations (p < 0.0001), then with NaCl concentrations (p = 0.0040) and finally with glucose concentrations (p = 0.0074) on the exposure response to nDy2O3 for the metabolic activity of the cell. For both methods, nDy2O3 concentration was the most influential variable and determined the magnitude of the exposure response. In addition, a strong correlation was observed when the combined effect between NaCl and nDy2O3 (p = 0.0148) was analyzed. This is consistent with the results obtained, which showed higher toxicity effect in conditions with low NaCl and high nDy2O3 concentrations. Also, NaCl and glucose were analysed simultaneously and showed a significant correlation with a p value of 0.0566. A similar trend was observed in the high toxicity effect of nDy2O3 on E. coli when bacteria were more active at high glucose concentrations and nDy2O3 more stable at low NaCl concentrations.
Conclusion
The results showed that respirometric and permeation membrane tests can be used to provide a comprehensive assessment of nanoparticle toxicity on microorganisms. This study evaluated the performance of two toxicity methodologies: the Live/Dead assay to evaluate the membrane permeation and the respirometric assay to evaluate the metabolic activity of bacteria. The respirometric microarray test proved to be more sensitive than the Live/Dead test in measuring nanoparticle toxicity.With an understanding of the fate of nanoparticles in aqueous medium, a careful selection of appropriate toxicological methodologies can be made to improve the accuracy of future nanotoxicological studies.
Acknowledgements
Rhode Island Department of Transportation (RIDOT) for partially supporting Nelson M. Anaya, National Aeronautics and Space Administration (NASA) for partially supporting Farrah Solomon and the National Science Foundation (NSF), awards 1203555 and 0854113.References
- Y. Zhang, W. Wei, G. K. Das and T. T. Yang Tan, J. Photochem. Photobiol., C, 2014, 20, 71–96 CrossRef CAS.
- W. Xu, K. Kattel, J. Y. Park, Y. Chang, T. J. Kim and G. H. Lee, Phys. Chem. Chem. Phys., 2012, 14, 12687–12700 RSC.
- B. A. Bony, J. S. Baeck, Y. Chang, J. E. Bae, K. S. Chae and G. H. Lee, Biomater. Sci., 2014, 2, 1287–1295 RSC.
- T. Kubik, K. Bogunia-Kubik and M. Sugisaka, Curr. Pharm. Biotechnol., 2005, 6, 17–33 CAS.
- K. Kattel, J. Y. Park, W. Xu, H. G. Kim, E. J. Lee, B. A. Bony, W. C. Heo, S. Jin, J. S. Baeck, Y. Chang, T. J. Kim, J. E. Bae, K. S. Chae and G. H. Lee, Biomaterials, 2012, 33, 3254–3261 CrossRef CAS PubMed.
- G. K. Das, N. J. J. Johnson, J. Cramen, B. Blasiak, P. Latta, B. Tomanek and F. C. J. M. van Veggel, J. Phys. Chem. Lett., 2012, 3, 524–529 CrossRef CAS PubMed.
- T. G. Goonan, Rare earth elements—End use and recyclability: Scientific Investigations, US Geological Survey, 2011 Search PubMed.
- M. Hofmann-Amtenbrink, H. Hofmann and X. Montet, Swiss Med. Wkly., 2010, 1–8 Search PubMed.
- A. Valavanidis and T. Vlachogianni, Sci Adv Env. Toxicol Ecotoxicol Issues, http://www.Chem-Tox-Ecotox.Org, 2010 Search PubMed.
- S. K. Brar, M. Verma, R. D. Tyagi and R. Y. Surampalli, Waste Manage., 2010, 30, 504–520 CrossRef CAS PubMed.
- G. E. Batley, J. K. Kirby and M. J. McLaughlin, Acc. Chem. Res., 2013, 46, 854–862 CrossRef CAS PubMed.
- K. Kattel, J. Y. Park, W. Xu, H. G. Kim, E. J. Lee, B. A. Bony, W. C. Heo, J. J. Lee, S. Jin, J. S. Baeck, Y. Chang, T. J. Kim, J. E. Bae, K. S. Chae and G. H. Lee, ACS Appl. Mater. Interfaces, 2011, 3, 3325–3334 CAS.
- C. U. S. Harper, J. Exp. Nanosci., 2008, 3, 195–206 CrossRef.
- L. Boulos, M. Prévost, B. Barbeau, J. Coallier and R. Desjardins, J. Microbiol. Methods, 1999, 37, 77–86 CrossRef CAS PubMed.
- H. Zhang and V. Oyanedel-Craver, J. Environ. Eng., 2012, 138, 58–66 CrossRef CAS.
- M. Doudoroff, J. Gen. Physiol., 1940, 23, 585–611 CrossRef CAS PubMed.
- H. Zhang and V. Oyanedel-Craver, J. Hazard. Mater., 2013, 260, 272–277 CrossRef CAS PubMed.
- L. A. S. Varun and K. Kasaraneni, ACS Sustainable Chem. Eng., 2014, 1609–1615 Search PubMed.
- J. Liu and R. H. Hurt, Environ. Sci. Technol., 2010, 44, 2169–2175 CrossRef CAS PubMed.
- K. Van Hoecke, K. A. C. De Schamphelaere, P. Van der Meeren, G. Smagghe and C. R. Janssen, Environ. Pollut., 2011, 159, 970–976 CrossRef CAS PubMed.
- A. Omsland and R. A. Heinzen, Annu. Rev. Microbiol., 2011, 65, 111–128 CrossRef CAS PubMed.
- S. Borglin, D. Joyner, K. M. DeAngelis, J. Khudyakov, P. D'haeseleer, M. P. Joachimiak and T. Hazen, Curr. Opin. Biotechnol., 2012, 23, 41–48 CrossRef CAS PubMed.
- B. R. Bochner, P. Gadzinski and E. Panomitros, Genome Res., 2001, 11, 1246–1255 CrossRef CAS PubMed.
- V. Tremaroli, M. L. Workentine, A. M. Weljie, H. J. Vogel, H. Ceri, C. Viti, E. Tatti, P. Zhang, A. P. Hynes, R. J. Turner and D. Zannoni, Appl. Environ. Microbiol., 2009, 75, 719–728 CrossRef CAS PubMed.
- B. Klimek and M. Niklińska, Bull. Environ. Contam. Toxicol., 2007, 78, 112–117 CrossRef CAS PubMed.
- R. F. Vaccaro, M. P. Briggs, C. L. Carey and B. H. Ketchum, Am. J. Public Health, 1950, 40, 1257–1266 CrossRef CAS.
- Y. Rozen and S. Belkin, FEMS Microbiol. Rev., 2001, 25, 513–529 CrossRef CAS PubMed.
- P. Arense, V. Bernal, J. L. Iborra and M. Cánovas, Process Biochem., 2010, 45, 1459–1467 CrossRef CAS.
- L. Brynhildsen, B. V. Lundgren, B. Allard and T. Rosswall, Appl. Environ. Microbiol., 1988, 54, 1689–1693 CAS.
Footnote |
| † Electronic supplementary information (ESI) available. See DOI: 10.1039/c5en00074b |
| This journal is © The Royal Society of Chemistry 2016 |

