Aqueous CO2 reduction on morphology controlled CuxO nanocatalysts at low overpotential
Mengyang Fana,
Zhengyu Baib,
Qing Zhangb,
Chengyu Ma*ac,
Xiao-Dong Zhou*d and
Jinli Qiao*ab
aCollege of Environmental Science and Engineering, Donghua University, 2999 Ren'min North Road, Shanghai 201620, P. R. China. E-mail: qiaojl@dhu.edu.cn; machengyu@dhu.edu.cn; zhox@cec.sc.edu; Fax: +86-21-67792159; Tel: +86-90-6008-9342 Tel: +86-21-67792379
bSchool of Chemistry and Chemical Engineering, Key Laboratory of Green Chemical Media and Reactions, Ministry of Education, Henan Normal University, Xinxiang, Henan 453007, P. R. China
cDepartment of Chemistry and Environmental Science, Kashigar Teachers College, Kashgar, 844006, P. R. China
dDepartment of Chemical Engineering, University of South Carolina, Columbia, SC 29208, USA
First published on 4th September 2014
Abstract
Various CuxO catalysts with different special microstructures were synthesized using a simple one-step hydrothermal method by controlling the reaction time and temperature conditions. Scanning electron microscopy (SEM) and high-resolution transmission electron microscopy (HR-TEM) were used to observe the morphologies of the received catalysts. The 3-dimensional (3D) hierarchical nanospheres (500 nm) comprised of secondary structured nanorods (50 nm) are formed at 180 °C for 2 hours. However, when increasing the hydrothermal reaction temperature to 220 °C, solid microspheres with a large size of 2.5 μm begin to appear instead of flabby hierarchical nanospheres. To further investigate the effect of morphologies on the activity and production selectivity of CuxO catalysts, cyclic voltammetry (CV) was used to evaluate the onset potential and current density of catalyzed CO2 reduction combining linear sweep voltammetry (LSV) in 0.5 M KHCO3 solution. The effect of catalyst loading was also tested by applying the gas diffusion layer (GDL) to make up a working electrode for CO2 electroreduction. The results indicate that the synthesized temperature of 180 °C for 2 h is the optimal condition for CuxO nanospheres and the optimal loading is about 3 mg cm−2, under which the onset potential for CO2 electroreduction reaches −0.55 V vs. SHE. By ion chromatography measurement, the faradaic efficiency and production rate of produced formate was found to be 59%, which is much higher than most reported Cu-based catalysts at the same electrolysis conditions, indicating the high selectivity of the CuxO nanospheres due to their controlled special surface morphology.
1. Introduction
Extra emission of carbon dioxide (CO2) into the atmosphere, induced by the depletion of non-renewable fossil fuels and excess human industrial activities, has been considered one of the primary causes of possible global warming due to the greenhouse effect, and has also becoming an increasing concern in recent years. Electrochemical reduction of CO2 to form useful chemicals or fuels is a potentially efficient method of CO2 utilization and recycling.1 However, in the process of CO2 electroreduction, there is a problem of the slow kinetic of CO2 electroreduction, leading to wastage of energy and the insufficient utilization of sources.2,3 Overcoming the challenges of CO2 reduction under mild conditions would enable development of a broader portfolio of fuel-producing device. Therefore, the focal point is to develop efficient catalysts which can increase the activity and selectivity, especially for room-temperature CO2 reduction in aqueous solutions.4–6In the past few decades, researchers found that many metal oxide nanopowders could be the perfect catalysts in supercapacitors and/or lithium ion batteries for their controllable various morphologies.7–10 This is because that different morphologies of the metal oxides might give different surface structures and surface areas, which then further influence the performance of electrochemical reaction. On the other hand, in the research field of electrochemical reduction of CO2, Prakash reported11 that taking Sn metal powder as the catalyst could give high current density and show high faradaic efficiency for produced formate in 0.5 M NaHCO3 solution. Li12 and Tang13 et al., find that the nanostructured surface of Cu metal plate could give more positive onset potential and higher current efficiency for CO2 reduction in 0.5 M NaHCO3 and 0.1 M KClO4 aqueous solution, respectively. It is believed that the special morphology on the surface could provide abundant undercoordinated sites, which are more likely to be the active sites for CO2 reduction.6,12,13 As yet, the large overpotential was required for CO2 reduction for many metal electrodes, resulting from the barrier associated with the initial electron transfer to form a CO2˙− intermediate that is poorly stabilized by the metal electrode surfaces.14 Most recently, it has been proposed that metastable metal oxides (e.g., SnOx) can participate in the CO2 reduction pathway on metal electrodes (e.g., Sn) by providing chemical functionality that stabilizes the incipient negative charge on CO2 or by mediating the electron transfer directly, therefore the catalytic activity for CO2 electroreduction was greatly enhanced relative to a bare metal electrode.15 Although the potentials required for CO2 reduction are past the standard reduction potentials for these oxides, metastable metal oxides are known to persist on electrode surfaces during cathodic reactions.16 This suggests us a clue that metal oxides might be promising candidates for CO2 reduction. Unfortunately, less is concern on the directly synthesized metal oxide nanocatalysts with different morphologies in CO2 reduction, although the control of different special morphologies is very important on both activity and production selectivity in CO2 reduction.
In this work, we report the synthesis of CuxO nanocatalysts with controlled different special morphologies by one-step hydrothermal method, which have the merits of low-cost, large-scale production and facile manipulation. By controlling the hydrothermal reaction conditions, various CuxO nanocatalysts with novel morphologies are received, such as hierarchical nanospheres with an average diameter of about 500 nm and solid microspheres in a large size of about 2.5 μm. In order to further investigate the effects of hydrothermal reaction time and temperature on the morphology and catalytic activity of as-prepared CuxO nanoparticles for CO2 electroreduction, cyclic voltammetry (CV) study was utilized combining linear sweep voltammetry (LSV). For all electrochemical measurements, the CuxO nanoparticles were coated on the gas diffusion carbon paper to form target electrodes, in this way, easy diffusion path lengths can be achieved for substrates to access, leading to faster kinetics. At the same time, H2 as byproduct which could impede the reduction reaction between CO2 and electrode, could also be inhibited effectively.11 The effect of catalyst loading was also tested by applying the gas diffusion layer (GDL) to make up a working electrode for CO2 electroreduction. The morphology effect on selectivity of formate production was studied systematically through faradaic efficiency combining production rate, which was examined by ion chromatography technique.
2. Experimental
2.1 Materials and catalyst synthesis
In this work, copper(II) acetate monohydrate (Cu(Ac)2) was used as precursor for Cu-oxide nanocatalyst preparation, which was provided by Sinopharm Chemical Reagent Co. (SCR) with 99% purity and, 2,5-dimethoxyaniline purchased from Ourchem Information Consulting Co. with 99% purity was used as the reducing agent in dilute aqueous solutions under hydrothermal conditions. In detail, 0.04 M Cu(Ac)2 solution (40 mL) was mixed with 0.02 M 2,5-dimethoxyaniline solution (10 mL) till the mixture became dark green. During this process, a small amount of HAc (99%) was always added into Cu(Ac)2 solution for avoiding the hydrolysis of Cu(Ac)2. Then such mixture was transferred to a 100 mL Teflon-lined stainless steel autoclave. The autoclave was sealed and maintained at 180 °C for 1–15 hours or at 160–220 °C for 2 hours, respectively, in order to clarify the optimal reaction condition. The final powder was washed by ethanol and dried overnight. In this way, CuxO nanocatalysts with different morphologies were synthesized as shown in Fig. 1. For a convenient discussion, the resulting catalysts were labeled as CuxOT-τ, where T indicates the temperature (°C) used for hydrothermal reaction and τ the time (h) of hydrothermal reaction. As an example, the CuxO catalyst synthesized at 180 °C for 2 hours was expressed as CuxO180-2 and so on.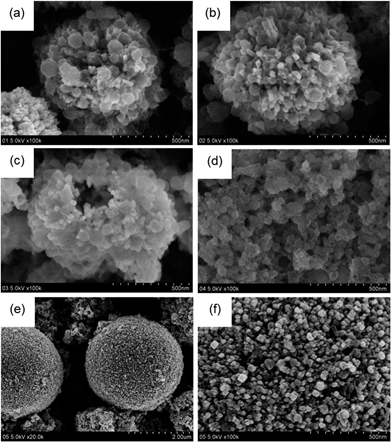 | ||
| Fig. 1 SEM images of (a) CuxO180-2, (b) CuxO180-5, (c) CuxO180-10, (d) CuxO180-15, (e) CuxO220-2. (f) High-resolution SEM image of CuxO220-2. | ||
2.2 Electrode preparation and electrochemical test
For all electrochemical measurements, the CuxO nanoparticles were coated on the gas diffusion carbon paper to form target electrodes. For catalyst ink preparation, CuxO nanocatalyst (15 mg) was suspended in 200 μL isopropyl alcohol (Sinopharm Chemical Reagent Co.) and 5 wt% Nafion® solution (100 mg) was dropped in order to improve adhesion of catalyst ink. For exploring the effect of catalyst loading on catalytic activity, 10 mg, 15 mg and 20 mg catalysts were dispersed in 200 μL isopropyl alcohol to form different loadings of catalyst inks (2 mg cm−2, 3 mg cm−2 and 4 mg cm−2, about 80% of the catalyst powders were coated on the electrode), respectively. A gas diffusion layer (GDL) (4 cm2 Toray carbon paper, TGP-H-090) with catalysts coated on was used as the working electrode and tested in a conventional three-electrode electrochemical H-type cell, in which a piece of Nafion® 117 cation exchange membrane (H+ form) as a separator, a platinum foil electrode as the counter electrode and a saturated calomel electrode (SCE) as the reference electrode. All measured potentials were referenced to a standard hydrogen electrode (SHE). A CH Instruments 600E was used for all electrochemical experiments. An aqueous electrolyte (0.5 M KHCO3) was used as the measurement solution, which was bubbled with 1.0 atm CO2 gas (99.99%) for 30 minutes for the CO2 reduction measurements. The electrocatalytic activity and kinetics of the working electrode was tested using cyclic voltammetry (CV) and linear sweep voltammetry (LSV) at a scan rate of 100 mV s−1 and 5 mV s−1, respectively, in the potentials ranging from 1.25 V to −1.25 V. All these tests were carried out at ambient temperature and pressure.2.3 Physical characterization and reduction product measurement
The scanning electron microscopy (SEM) images of samples were taken by Zeiss ultra plus thermal field emission SEM instrument (Carl Zeiss SMTAG, Germany). High-resolution transmission electron microscopy (HR-TEM) analyses were performed with a high-resolution Hitachi JEM-2100F operating at 200 kV to obtain information of the average particle size and the morphology difference of catalysts. The crystal-phase X-ray diffraction (XRD) patterns of typical CuxO catalysts were obtained using a Philips PW3830 X-ray diffractometer equipped with Cu-Ka radiation (λ = 0.15406 nm). The intensity data were collected at 25 °C in the 2θ range from 0° to 90° with a scan rate of 1.20 min−1. Brunauer–Emmett–Teller (BET) specific surface area was characterized by nitrogen adsorption in a Micromeritics ASAP 2020 nitrogen adsorption apparatus (USA). The product solution was filtered with filter membrane (0.22 μm) and the HCOO− concentration was determined by ion chromatography (ICS-90, Dionex, USA) using an AS14 4 mm × 250 mm separation column at a flow rate of 1 mL min−1. The mobile phase was a mixed aqueous solution of Na2CO3 (4.5 mM) and NaHCO3 (0.8 mM), and a H2SO4 (20 mM) aqueous solution was used as a regenerator.3. Results and discussion
3.1 Effect of hydrothermal reaction condition on the morphology of CuxO nanocatalysts
To observe the morphology changes under different hydrothermal conditions, Fig. 1 shows SEM images of the CuxO nanocatalysts synthesized at 180 °C for 2, 5, 10 and 15 hours, respectively. It can be seen that CuxO180-2 catalyst indicates a clear 3-dimensioned (3D) hierarchical nanosphere structure with an average diameter of about 500 nm (Fig. 1(a)). After a careful observation, it was found that such nanospheres are comprised of secondary structures which are made up of laminated small nanosheets with an average diameter of about 50 nm. With increasing the synthesis time to 5 hours, however, a little deformation of the secondary structure was observed for CuxO180-5 catalyst, where the slender nanorods with the diameter of about 20 nm and 50 nm are formed. Although the morphology with hierarchical nanosphere structure is still maintained, the diameter of the nanosphere increased to about 800 nm (Fig. 1(b)). Further increasing the hydrothermal reaction time to 10 hours induces the formation of inner hollow nanosphere structure for CuxO180-10, i.e., the 3D hierarchical nanosphere structure tends to break at this stage (Fig. 1(c)). Finally, when the reaction time was further increased to 15 hours, the 3D structure of CuxO180-15 catalyst completely collapsed. During this process, large amounts of nanoparticles with a diameter of 50 nm clustered together and, most of the nanoparticles were wrapped by amorphous substance which was inherited from the precursors as shown in Fig. 1(d). Normally, the fabrication process of these nanostructures in Fig. 1(a)–(c) can be explained by a self-transformation process of the metastable aggregated particles accompanied by the Ostwald ripening,17–19 where the time of hydrothermal reaction plays a key role in obtaining the special morphology of the catalyst.It is interesting to find that when the temperature for hydrothermal reaction was increased from 180 °C to 220 °C while still maintaining the reaction time for 2 hours, dense microspheres are formed for CuxO220-2 catalyst with a large size in diameter of 2.5 μm (Fig. 1(e)), which is very different from the morphology of CuxO180-2 catalyst (Fig. 1(a)). Further from the high-resolution SEM image of CuxO220-2 (Fig. 1(f)), it was found that the surface of these large microspheres are comprised of small nanorods with an average diameter of 25 nm, which are densely arrayed with sporadic cavities in the intervals of these nanorods. These morphology changes may greatly influence the catalytic activity of the catalysts for CO2 electroreduction, which will be discussed thoroughly in the following section.
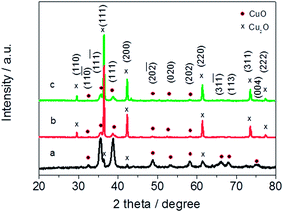
For further clarifying the morphology differences of CuxO catalysts, HR-TEM (Fig. 2) combining XRD patterns (Fig. 3) were used to investigate CuxO180-2, CuxO180-15, CuxO220-2, which are representatives in all CuxO catalysts. From Fig. 2(a), it can be seen clearly that CuxO180-2 catalysts are flabby nanospheres which are made up of small nanosheets. The corresponding fast Fourier transformation (FFT) pattern (inset of Fig. 2(a)) exhibited rings with several obviously brighter dots, indicating their polycrystalline characteristics. The HR-TEM image shown in Fig. 2(b) combing XRD patterns in Fig. 3(a) provides more detailed structural information of the CuxO180-2 catalyst. The lattice fringes showed a lattice spacing of 0.27 nm (Fig. 2(b)), corresponding to the {−111} planes of CuO. Fig. 2(c) shows the TEM image of CuxO180-15, which correlates well with the SEM image (Fig. 1(d)), where the CuxO180-15 catalysts did not show any special morphology, i.e., with the increase of synthesis time high up to 15 hours, the nanosphere structure was destructed completely, and the morphology of CuxO180-15 turned to scattered 1-dimension nanoparticles which were covered by amorphous substance. Therefore the FFT pattern shown in the inset of Fig. 2(c) does not show obvious brighter dots. However, in Fig. 2(d), by HR-TEM and calculation of XRD pattern, the lattice fringes on scattered nanoparticles were related to {110} planes of Cu2O. The morphology of CuxO220-2 shown in Fig. 2(e) also has a well consistent result with the SEM image as shown in Fig. 1(e) and (f). The FFT pattern (inset of Fig. 2(e)) combing HR-TEM (Fig. 2(f)) indicates that the Cu2O220-2 was also polycrystalline copper and the lattice spacing is 0.21 nm (Fig. 2(f)), indicating a relationship with {200} planes of Cu2O. All the clear crystalline information of CuxO180-2, CuxO180-15 and CuxO220-2 was shown in Fig. 3.
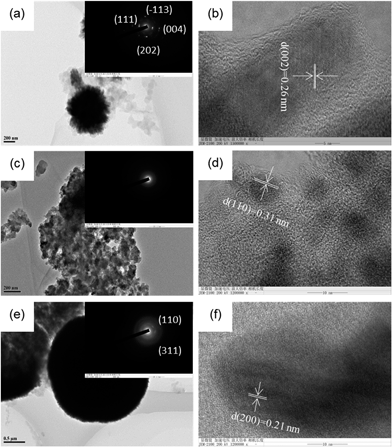 | ||
| Fig. 2 TEM images and corresponding FFT pattern (inset) of typical (a) CuxO180-2, (c) CuxO180-15, (e) CuxO220-2. High-resolution TEM images of (b) CuxO180-2, (d) CuxO180-15, (f) CuxO220-2. | ||
In Table 1, all the BET specific surface areas are summarized related to the different catalysts' morphology, their average particle size and electrochemically active surface area. One can see that CuxO180-2 catalyst has the largest specific surface area of 63.50 m2 g−1, CuxO180-15 has the specific surface area of 53.62 m2 g−1, while CuxO220-2 has the smallest specific surface area of 22.16 m2 g−1, which are ascribed to their structural difference. Based on the observations, it is reasonable to conclude that the largest surface area of CuxO180-2 results from the loose and hierarchical nanosphere structure. For CuxO180-15, the nanosphere structure was destroyed, and the catalyst was made up of clustered nanosheets, thus the BET surface area of CuxO180-15 decreased correspondingly. However, for CuxO220-2, the small surface area comes from the large size of microsphere structure which was densely arrayed by small nanorods.
| Catalysts | Morphology | Average size (nm) | BET surface area (m2 g−1) | Electrochemically active surface area C (μF) |
|---|---|---|---|---|
| CuxO180-2 | Hierarchical nanosphere | 500 | 63.50 | 800 |
| CuxO180-15 | Non-sphere | — | 53.62 | 300 |
| CuxO220-2 | Dense microsphere | 2500 | 22.16 | 790 |
The electrochemically active surface area was examined by the double layer capacitance in N2-saturated 0.1 M HClO4. The CV was measured in a potential range without faradaic process occurred and, the capacitance, C (F), was calculated by the equation C = current density/scan rate. As shown in Table 1, the CuxO180-2 with the special laminated nanosphere structure showed the best capacitance, and the capacitance of CuxO220-2 (microsphere structure) was just a little minor than that of CuxO180-2. Although the BET surface area of CuxO220-2 is the smallest in the tested three catalyst samples, the 3D sphere morphology of CuxO220-2 and the results of the electrochemically active surface area indicate that the sphere nanostructure might be competitive to give more active sites in CO2 electroreduction, as will be demonstrated below. These results could explain that why the catalytic activity of CuxO180-2 and CuxO220-2 is high for CO2 electroreduction from one hand. However, for the CuxO180-15 catalyst without any special morphology, the capacitance is only 300, which is about one-third smaller than that of CuxO180-2. These results are in line with the conclusions in Fig. 1–3.
3.2 Electrochemical activities of catalyzed CO2 reduction
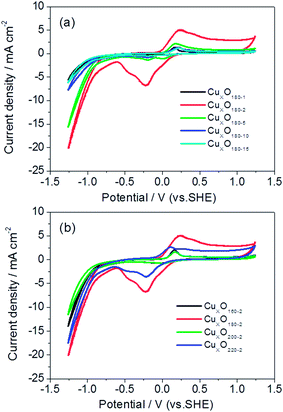
For clarifying the effects of hydrothermal conditions including reaction time and temperature on the catalysts' activities of catalyzed CO2 electroreduction, Fig. 4 shows CV responses of CO2 saturated 0.5 M KHCO3 solution on five catalysts coated on GDL, i.e., CuxO180-1, CuxO180-2, CuxO180-5, CuxO180-10 and CuxO180-15, respectively. From Fig. 4(a), it can be seen that the CuxO180-2 catalyst resulted in the earliest onset potential (about −0.55 V vs. SHE) in all tested catalyst samples and then the CuxO180-5 catalyst if the catalytic current obtained from CuxO to its reduction state (at the end of reduction peak) at the negative potential direction in Fig. 4 was ignored. However, for either CuxO180-1 or CuxO180-10 and CuxO180-15 catalysts, their onset potentials appear at about −0.85 V vs. SHE, which are more 300 mV negative shift compared to that of CuxO180-2. Moreover, at the most negative potentials, the cathodic current density is much larger for CuxO180-2 catalyst than the catalysts synthesized at 180 °C for longer times. This suggests that hydrothermal reaction at 180 °C for 2 hours is the optimal condition for CuxO catalyst, under which the morphology of 3D hierarchical nanospheres with secondary structures for CuxO180-2 can be well formed. Such special morphology may provide larger active surface area and more active sites for CO2 electroreduction, thus the improved catalytic activity of CuxO180-2 catalyst toward CO2 reduction. As described in Fig. 1(a)–(d), when the hydrothermal reaction time was increased while maintain the synthesis temperature unchanged (at 180 °C), such hierarchical structure was destroyed and no more 3D structure left at last, instead, the CuxO180-15 is only consisted of clustered nanosheets. Obviously, the decreased catalytic activity of CuxO180-10 and CuxO180-15 might be partly resulted from the destroyed hierarchical nanosphere structure.20 It should be mentioned that the CuxO220-2 catalyst also shows a comparably better performance for CO2 reduction (Fig. 4(b)). The onset potential of CuxO220-2 catalyst is very similar to that of CuxO180-2 catalyst under the same the measuring conditions. Additionally, the current density at the most negative potential for CuxO220-2 catalyst is even larger than that for CuxO160-2 and CuxO200-2 catalysts, while is only slightly less than that of CuxO180-2. These results imply that the microsphere morphology of CuxO200-2 could not be perfect as the special hierarchical nanosphere of CuxO180-2 because of the large size and dense structure of the former when compared to the fluffy structure of the latter, of which the dense microsphere morphology of CuxO200-2 may not easily offer more active sites for catalytic CO2 reduction than CuxO180-2, however, because of the 3D nanosphere structure of CuxO200-2, the activity of CuxO200-2 is still higher than that of CuxO180-15 (without special morphology). Note that the overpotential of CO2 electroreduction of the optimal CuxO180-2 was found to be at −0.55 V vs. SHE, which is much lower than those for metal Cu electrodes (about 450 mV positive shift) reported elsewhere.21–23 Even for those CuxO nanocatalysts (e.g., CuxO180-10 and CuxO180-15) with comparably lower activities in this work, their overpotentials of −0.85 V vs. SHE is still nearly 150 mV more positive shift than the reported ones.21–233.3 Faradaic efficiency of the produced formate
To further confirm that the morphology structures could have effect on the catalytic activity and production selectivity towards CO2 reduction, the produced formate was determined and analyzed as a target by ion chromatography (IC), after applying a constant potential of −0.7 V vs. SHE in CO2 saturated 0.5 M KHCO3 electrolyte for 60 minutes. The faradaic efficiency was calculated using the following equation:24
 | (1) |
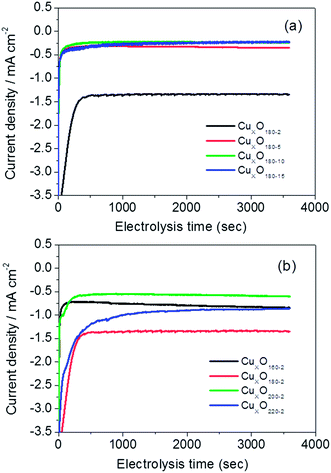 | ||
| Fig. 5 Current–time curves for CuxO nanocatalysts synthesized at (a) 180 °C for 2–15 hours and (b) 160–220 °C for 2 hours. Catalyst loading: 3 mg cm−2. | ||
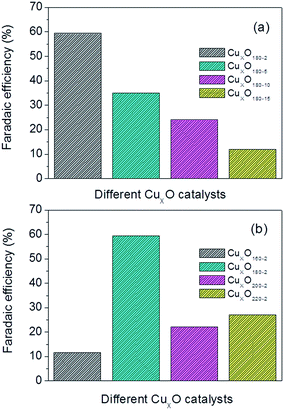 | ||
| Fig. 6 Faradaic efficiency of produced on CuxO nanocatalysts synthesized at (a) 180 °C for 2–15 hours and (b) 160–220 °C for 2 hours. Catalyst loading: 3 mg cm−2. | ||
| Catalyst | Loading (mg cm−2) | Onset potential (V vs. SHE) | Current density at potential = −1.25 V vs. SHE (mA cm−2) | Faradaic efficiency (%) | Production rate (μmol min−1 cm−2) |
|---|---|---|---|---|---|
| CuxO180-2 | 3 | −0.55 | −20.5 | 59.36 | 2.7 × 10⁻¹ |
| CuxO180-5 | 3 | −0.80 | −16.0 | 34.97 | 3.7 × 10⁻² |
| CuxO180-10 | 3 | −0.85 | −8.0 | 23.99 | 1.8 × 10⁻² |
| CuxO180-15 | 3 | −0.85 | −6.5 | 12.00 | 1.0 × 10⁻² |
| CuxO160-2 | 3 | −0.85 | −14.0 | 11.57 | 2.9 × 10⁻² |
| CuxO200-2 | 3 | −0.90 | −12.0 | 22.08 | 4.1 × 10⁻² |
| CuxO220-2 | 3 | −0.60 | −17.5 | 27.13 | 5.9 × 10⁻² |
| CuxO180-2 | 2 | −0.85 | −8.5 | 29.04 | 3.5 × 10⁻² |
| CuxO180-2 | 4 | −0.85 | −8.6 | 44.95 | 9.0 × 10⁻² |
Production rate combining the faradaic efficiency and current density could also be used to contrast the performance of different CuxO catalysts. Fig. 7 combing Table 2 shows the detailed production rate for each CuxO catalyst. Evidently, the CuxO180-2 has the best performance compared to CuxO catalysts made by other conditions. From Fig. 7, the production rate of CuxO180-2 is about one order higher than the other CuxO catalysts and follows the order: CuxO180-2 ≫ CuxO180-5 > CuxO180-10 > CuxO180-15, and CuxO180-2 ≫ CuxO220-2 > CuxO200-2 > CuxO160-2, which are synthesized for CuxO both at a longer reaction time or at a higher temperature of 220 °C and lower temperature of 160 °C (Table 2). All of these results of formate production rate are consist well with the results of faradaic efficiency. Based on the above observations we could give a schematic of the structures of the typical CuxO180-2, CuxO180-15 CuxO220-2 and the morphology effect on the active surface area and formate faradaic efficiency. This could help us to have a more clearly mechanistic understanding on why and how the structures are affecting the electrocatalytic activities. As seen in Fig. 8, both the CuxO180-2 and CuxO220-2 were consisted of secondary structures which provide them larger active surface area and higher faradaic efficiency than CuxO180-15 with only 1-dimensional structure. However, the diameter of CuxO220-2 was fairly large and catalyst sphere was 4 times bigger than that of CuxO180-2. That is why the faradaic efficiency of CuxO220-2 was not that perfect as CuxO180-2. Therefore, the morphology is a key factor in determining the activity and selectivity of catalysts and, the synthesis reaction time and temperature could effectively turning the catalysts' morphology and thus their catalytic performance.
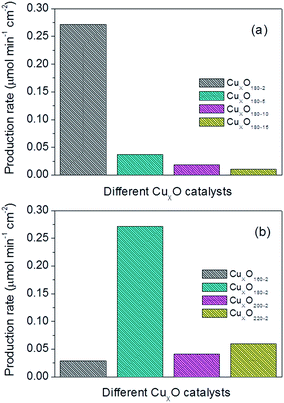 | ||
| Fig. 7 Production rate of CuxO nanocatalysts synthesized at (a) 180 °C for 2–15 hours and (b) 160–220 °C for 2 hours. Catalyst loading: 3 mg cm−2. | ||
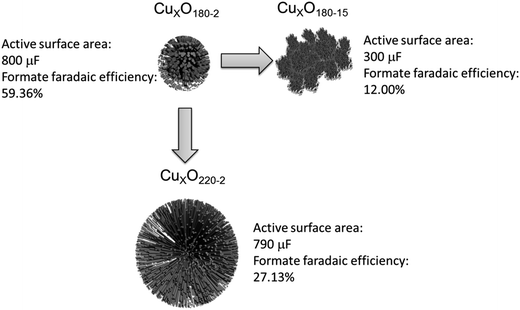 | ||
| Fig. 8 Schematic structures of typical CuxO180-2, CuxO180-15, CuxO220-2 and, the structure effect on the active surface area and formate faradaic efficiencies. | ||
3.4 Loading effect on the activity and selectivity for CO2 catalytic reduction
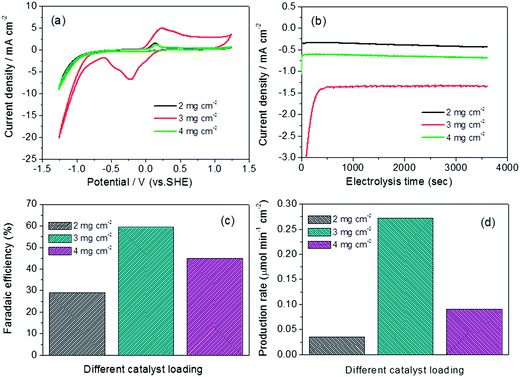
For low-cost Cu-based catalyst, increasing the catalyst loading obviously could be a way to improve its catalytic performance. Loading effect has been widely discussed in the field of fuel cell,27–29 however, for CO2 electroreduction, the effect of catalyst loading has never been reported yet. Based on this consideration, the loading effect on catalytic activity of CO2 electroreduction is investigated by CV curves, with the most efficient CuxO180-2 catalyst as a typical candidate. As shown in Fig. 9(a), both the onset potential and the current density at the most negative potential are greatly enhanced with increasing catalyst loading from 2 mg cm−2 to 3 mg cm−2 (with 300 mV positively shifted onset potential and 2.5 times increased current density). When the loading is further increased to 4 mg cm−2, both onset potential and current density are retreated to the level of 2 mg cm−2 loading. From what has been discussed above, it could be concluded that 3 mg cm−2 is the optimal catalyst loading for CO2 electroreduction.To further verify the loading effect on the performance of catalytic CO2 reduction, Fig. 9(b)–(d) combing Table 2 exhibit the current density, faradaic efficiency and production rate for different catalyst loadings. It can be obviously seen that the current density for catalyst loading of 3 mg cm−2 is much higher than for other two, and 2.2-fold of 4 mg cm−2 loading and 3.7-fold of 2 mg cm−2 loading, respectively (Fig. 9(b)). Furthermore, both the faradaic efficiency (Fig. 9(c)) and production rate (Fig. 9(d)) of formate reach the maximum under the loading of 3 mg cm−2 which are in accord with what concluded in Fig. 9(a) that the loading of 3 mg cm−2 is the optimal one.
Regarding the catalyst loading, there has not a clarified mechanism on its prompting and/or prohibiting effect. However, it is reasonable to be viewed that this loading effect could provide more active sites available for reducing initial electron transfer to form a CO2˙− intermediate that is poorly stabilized by the metal electrode surfaces, that is, increasing the catalyst loading may lead to an enhanced electron pathway in CO2 reduction process. Another explanation may be considered, that is, at low loading, the catalyst layer is so thin that the generated CO2˙− intermediate have no enough time to stay to find neighboring active site for next reduction process, while at high catalyst loading, CO2˙− intermediate could have longer time to remain in catalyst layer, thus more chance for the reduction of CO2˙− intermediate further to formate. However, too high loading will cause the catalyst layer too thick, leading to the easy cracking and falling off of the catalyst from the electrode as well as larger electric resistance, thus resulting in lower catalytic activity. And this has been well demonstrated for cathodic catalyst for oxygen reduction reaction in fuel cells.27–29
4. Conclusions
The effects of hydrothermal conditions on the morphology formation of CuxO nanocatalysts and their influences for catalytic performance in CO2 electroreduction were investigated. It was found that hydrothermal reaction at 180 °C for 1–15 or at 160–220 °C for 2 hours could induce the formation of sphere-like nanostructure. However, the special 3D hierarchical nanospheres (∼500 nm) comprised of secondary structures could only be received at 180 °C for 2 hours. This condition performs best for CuxO catalysts in CO2 catalytic reduction in terms of both catalytic activity and selectivity, under which the faradaic efficiency of formate could realize ∼59%, and the production rate is one order increased than CuxO synthesized under other conditions. However, the special hierarchical nanospheres were destroyed with increasing the hydrothermal reaction time, and at the same time, the reduction activity and production faradaic efficiency decreased greatly, suggesting that surface morphology control of the catalyst is a significant factor, which determines the active sites and surface area and even pathway for CO2 reduction reaction. The catalyst loading effects on CO2 electroreduction have also been investigated in this paper. It was concluded that under the loading of 3 mg cm−2, the CuxO180-2 performs the high catalytic activity and, the overpotential of CO2 reduction is −0.55 V vs. SHE, which is nearly 450 mV positive shift than previous works.Acknowledgements
This work was supported by the National Natural Science Foundation of China (21173039); Specialized Research Fund for the Doctoral Program of Higher Education, SRFD (20110075110001) of China; the Innovation Program of the Shanghai Municipal Education Commission (14ZZ074), International Academic Cooperation and Exchange Program of Shanghai Science and Technology Committee (14520721900), the Graduate degree thesis Innovation Foundation of Donghua University (EG2014014) and College of Environmental Science and Engineering, State Environmental Protection Engineering Center for Pollution Treatment and Control in Textile Industry, Donghua University. All the financial supports are gratefully acknowledged.References
- J. L. Qiao, Y. Y. Liu, F. Hong and J. J. Zhang, Chem. Soc. Rev., 2014, 43, 631–675 RSC.
- M. Gattrell, N. Gupta and A. Co, J. Electroanal. Chem., 2006, 594, 1–19 CrossRef CAS PubMed.
- N. S. Spinner, J. A. Vega and W. E. Mustain, Catal. Sci. Technol., 2012, 2, 19–28 CAS.
- P. Kang, T. J. Meyer and M. Brookhart, Chem. Sci., 2013, 4, 3497–3502 RSC.
- Y. Chen, C. W. Li and M. W. Kanan, J. Am. Chem. Soc., 2012, 134, 19969–19972 CrossRef CAS PubMed.
- J. L. Qiao, P. Jiang, J. S. Liu and J. J. Zhang, Electrochem. Commun., 2014, 38, 8–11 CrossRef CAS PubMed.
- Y. Tan, X. Xue, Q. Peng, H. Zhao, T. Wang and Y. Li, Nano Lett., 2007, 7, 3723–3728 CrossRef CAS.
- Z. Liu, Y. Yang, J. Liang, Z. Hu, S. Li, S. Peng and Y. Qian, J. Phys. Chem. B, 2003, 107, 12658–12661 CrossRef CAS.
- Y. Jiao, F. Wang, X. Ma, Q. Tang, K. Wang, Y. Guo and L. Yang, Microporous Mesoporous Mater., 2013, 176, 1–7 CrossRef CAS PubMed.
- C. D. Lokhande, D. P. Dubal and O. S. Joo, Curr. Appl Phys., 2011, 11, 255–270 CrossRef PubMed.
- G. K. S. Prakash, F. A. Viva and G. A. Olah, J. Power Sources, 2013, 223, 68–73 CrossRef CAS PubMed.
- C. W. Li and M. W. Kanan, J. Am. Chem. Soc., 2012, 134, 7231–7234 CrossRef CAS PubMed.
- W. Tang, A. A. Peterson, A. S. Varela, Z. P. Jovanov, L. Bech, W. J. Durand, S. Dahl, J. K. Norskov and I. Chorkendorff, Phys. Chem. Chem. Phys., 2012, 14, 76–81 RSC.
- M. Gattrell, N. Gupta and A. Co, J. Electroanal. Chem., 2006, 594, 1 CrossRef CAS PubMed.
- Y. Chen and M. W. Kanan, J. Am. Chem. Soc., 2012, 134, 1986–1989 CrossRef CAS PubMed.
- D. Rochefort, P. Dabo, D. Guay and P. M. A. Sherwood, Electrochim. Acta, 2003, 48, 4245 CrossRef CAS.
- J. J. Teo, Y. Chang and H. C. Zeng, Langmuir, 2006, 22, 7369–7377 CrossRef CAS PubMed.
- F. Behnoudnia and H. Dehghani, Polyhedron, 2013, 56, 102–108 CrossRef CAS PubMed.
- J. Li and H. C. Zeng, J. Am. Chem. Soc., 2007, 129, 15839–15847 CrossRef CAS PubMed.
- H. Zhang, J. Feng and M. Zhang, Mater. Res. Bull., 2008, 43, 3221–3226 CrossRef CAS PubMed.
- J. Lee and Y. Tak, Electrochim. Acta, 2001, 46, 3015–3022 CrossRef CAS.
- P. Jiang, J. L. Qiao, M. Y. Fan, C. Y. Ma and J. S. Liu, ECS Trans., 2013, 53, 71–77 CrossRef PubMed.
- P. Jiang, J. L. Qiao, M. Y. Fan, C. Y. Ma and J. S. Liu, ECS Trans., 2013, 58, 91–97 CrossRef PubMed.
- J. Wu, F. G. Risalvato, F. S. Ke, P. J. Pellechia and X. D. Zhou, J. Electrochem. Soc., 2012, 159, F353–F359 CrossRef CAS PubMed.
- Y. Hori, A. Murata and R. Takahashi, J. Chem. Soc., Faraday Trans. 1, 1989, 85, 2309–2326 RSC.
- Y. Hori, K. Kikuchi and S. Suzuki, Chem. Lett., 1985, 53, 1695 CrossRef.
- G. Lalande, R. Côté, G. Tamizhmani, D. Guay and J. P. Dodelet, Electrochim. Acta, 1995, 40, 2635–2646 CrossRef CAS.
- G. Lalande, G. Tamizhmani, R. Côté, L. Dignard-Bailey, M. L. Trudeau, R. Schulz, D. Guay and J. P. Dodelet, J. Electrochem. Soc., 1995, 142, 1162–1168 CrossRef CAS PubMed.
- L. Ding, J. L. Qiao, X. F. Dai, J. Zhang, J. J. Zhang and B. L. Tian, Int. J. Hydrogen Energy, 2012, 37, 14103–14113 CrossRef CAS PubMed.
| This journal is © The Royal Society of Chemistry 2014 |

