Controlled fabrication of bi-functional Fe3O4@SiO2@Gd2O3:Yb,Er nanoparticles and their magnetic, up-conversion luminescent properties
Peng Jinga,
Qin Wanga,
Baocang Liuab,
Guangran Xua,
Yanbing Zhanga,
Jun Zhang*abc and
Gejihu Ded
aCollege of Chemistry and Chemical Engineering, Inner Mongolia University, Hohhot 010021, P.R. China. E-mail: cejzhang@imu.edu.cn; Fax: +86 471 4992278; Tel: +86 471 4992175
bCollege of Life Sciences, Inner Mongolia University, Hohhot 010021, P.R. China
cInner Mongolia Key Lab of Nanoscience and Nanotechnology, Hohhot 010021, P.R. China
dCollege of Chemistry and Environment Science, Inner Mongolia Normal University, Hohhot 010022, China
First published on 3rd September 2014
Abstract
We develop a facile layer-by-layer deposition process to create bi-functional Fe3O4@SiO2@Gd2O3:Yb,Er nanostructures composed of magnetic Fe3O4 cores, variable SiO2 mid-layers, and up-converting Gd2O3 shells. The synthetic process is well-controlled and the obtained Fe3O4@SiO2@Gd2O3:Yb,Er nanoparticles show relative monodispersity and exhibit tunable magnetic and up-conversion luminescence depending on the thickness of SiO2 mid-layers. The influences of SiO2 mid-buffer-layers on morphology, magnetism, and up-conversion luminescence are well addressed. The obtained bi-functional Fe3O4@SiO2@Gd2O3:Yb,Er nanoparticles may be potentially applicable in magnetic, fluorescent, and biological applications. The synthetic route may be employed for fabricating other multifunctional nanostructures.
1. Introduction
Magnetic and luminescent bi-functional nanomaterials have attracted great attention in recent years owing to their potential application in biological fields such as in fluorescent targeting, multimodal imaging, and drug delivery.1–3 In the choice of luminescent nanomaterials for labeling, targeting and imaging, up-conversion nanoparticles (UCNPs) possess lots of advantages such as high fluorescence quantum yields, low toxicity, long lifetimes, and high stability in comparison with quantum dots and organic dyes.2 UCNPs can convert near-infrared wavelength radiation to shorter wavelength radiation through a two-photon or multi-photon mechanism.4–8 Because UCNPs can be luminous under the excitation of NIR radiation, the strong background autofluorescence from biological entities, which may decrease the sensitivity of detection, can be largely avoided.9,10 Thus, the biological detection and imaging based on UCNPs with NIR radiation may have deeper penetration depth in tissues, enabling better detection and imaging sensitivity and resolution.11 To realize the magnetic feasibility simultaneously in UCNPS, magnetic Fe3O4 nanoparticles with large magnetic moment are expected to be integrated into such UCNPs to achieve bi-functional entities through various synthetic strategies of core–shell architecture, surface decoration, and composite integration for multimodal applications.To date, there have been some reports for constructing bi-functional nanostructures that were made up of Fe3O4 and UCNPs. The Fe3O4 and UCNPs could be combined with each other by a cross-linker anchoring process or via a facile aqueous-based co-precipitation approach under mild conditions.3,12–15 In these demonstrations, if the UCNPs are chosen as cores,16 their luminescent intensity may be suppressed to some extent due to the coating of outer layers. Meanwhile, if the UCNPs are direct in contact with Fe3O4, their luminescence may be decreased as the direct contact can cause fluorescence quenching.17 Therefore, a SiO2 mid-layer between Fe3O4 and UCNPs is needed and the core–shell structure is widely endowed in such bi-functional nanostructures. These multifunctional nanostructures can be used not only in MRI and UCL imaging, but also in CT imaging due to their large atomic number and high X-ray absorption coefficient of lutetium. Besides, amino-modified surface and mesoporous silica outer shell can also endow them positive aspects for loading and controlled release of ibuprofen (IBU). It is revealed that in such core–shell nanostructures, SiO2 layer has a significant influence on their structure, morphology and property. Herein, we fabricate bi-functional core–shell Fe3O4@SiO2@Gd2O3:Yb,Er nanostructures composed of Fe3O4 cores, SiO2 mid-layers and Gd2O3 shells through a facial layer-by-layer deposition approach. The obtained bi-functional core–shell Fe3O4@SiO2@Gd2O3:Yb,Er nanostructures exhibit uniform spherical morphology and excellent magnetic and fluorescent properties. The thickness of SiO2 mid-layers is found to have great effects on the magnetic and luminescent properties of Fe3O4@SiO2@Gd2O3:Yb,Er nanoparticles. An appropriate thickness of SiO2 mid-buffer-layers may result in higher luminescent intensity of bi-functional core–shell Fe3O4@SiO2@Gd2O3:Yb,Er nanoparticles and make them retain good magnetic responsive property simultaneously. The obtained bi-functional Fe3O4@SiO2@Gd2O3:Yb,Er nanoparticles may have potential values in magnetic, fluorescent, and biological applications. The synthetic route may also be applicable for fabricating other multifunctional nanostructures.
2. Experimental
2.1. Chemicals
Tetraethyl orthosilicate (TEOS) was purchased from Sinopharm Chemical Reagent Co., Ltd. FeCl3·6H2O, sodium acetate, trisodium citrate, ammonia solution (25–28 wt%), urea, ethylene glycol, and absolute ethanol were obtained from Tianjin Windship Chemistry Technological Co., Ltd. Gd(NO3)3·6H2O, Yb(NO3)3·5H2O, Er(NO3)3·5H2O and 3-aminopropyl-triethoxysilane (APTES) were purchased from Aladdin. All chemicals were used as received without further treatment. Deionized water was used for all experiments.2.2. Preparation of materials
2.3. Characterization
XRD was used to characterize the phase structure of the samples. Measurements were performed using a PANalitical EMPYREAN X-ray diffractometer operated at 40 kV and 40 mA using Cu Kα radiation (k = 0.15406 nm). Scanning electron micrographs were recorded with a JEOL-JSM 6700-F field-emission scanning electron microscope (FE-SEM). Samples for SEM measurements were deposited on silicon substrates and coated with a 5 nm Pt for characterization. TEM characterization was performed on a Hitachi H-800 system operated at an acceleration voltage of 200 kV. Samples for TEM analysis were prepared by drying a drop of microspheres dispersion on an amorphous carbon coated copper grid for observation. Scanning transmission electron microscopy (STEM) was performed on a FEI Tecnai F20 field-emission transmission electron microscope (FE-TEM). The up-conversion luminescence spectra were recorded on an Edinburgh FLS-920 instrument with a 980 nm diode laser as the excitation source. The magnetization curves of different samples were measured with a vibrating sample magnetometer (Nanjing university Co., Ltd, HH-15).3. Result and discussion
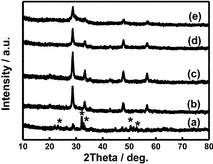
The synthetic procedures for Fe3O4@SiO2@Gd2O3:Yb,Er nanostructures are presented in Scheme 1. As illustrated in Scheme 1, magnetic Fe3O4 nanoparticles were firstly prepared and used as starting cores. Then, a layer of SiO2 was coated on Fe3O4 cores to achieve Fe3O4@SiO2 nanostructures. Depending on the amount of TEOS precursor used for SiO2 coating, the obtained Fe3O4@SiO2 nanostructures have variable shell thickness and morphologies. Then, by coating a layer of up-converting Gd2O3:Yb,Er, the bi-functional Fe3O4@SiO2@Gd2O3:Yb,Er nanostructures were obtained. The synthetic process was monitored by XRD characterization. Fig. 1 shows the XRD patterns of Fe3O4, Fe3O4@SiO2 (the amount of TEOS precursor fixed at 5.34 mL) and Fe3O4@SiO2@Gd2O3:Yb,Er (S3). The characteristic diffraction peaks in Fig. 1 can be well indexed to face centered cubic Fe3O4 (JCPDS no: 19-0629), cubic Gd2O3 (JCPDS no: 88-2165), and SiO2 (JCPDS no: 29-0085). Obviously, the diffraction peaks corresponding to Fe3O4 become weaker after depositing the SiO2 layer. When Gd2O3:Yb,Er layer was subsequently coated on Fe3O4@SiO2, the diffraction peaks indexed to Fe3O4 can be hardly seen and the diffraction peaks ascribed to SiO2 become weaker as well. This evidently proves the successful construction of core–shell Fe3O4@SiO2@Gd2O3:Yb,Er nanostructures. From the XRD data in Fig. 2, the full width at half maximum of Gd2O3 gradually narrows as the amount of added TEOS increases to 5.34 mL, then broadens as added amount further increases indicating the good crystallinity of Gd2O3 in S2, S3, and S4. The crystallinity of Gd2O3 in S3 is better than that in S2 and S4, while they are similar in S2 and S4. However, for S1 and S5, the characteristic diffraction peaks of Gd2O3 are relatively weak. Besides, there are also some diffraction peaks (they are noted as *) appeared in S1, which can be indexed to gadolinium iron oxide (JCPDS no: 78-0451 and no: 72-0141). The distinctions in crystallinity of Gd2O3 in S1 and S5 (Fig. 2a and e) will be discussed below combined with the corresponding TEM characterization. | ||
| Scheme 1 Schematic illustration shows the procedures for synthesis of Fe3O4@SiO2@Gd2O3:Yb,Er nanoparticles. | ||
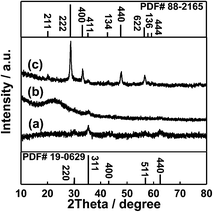 | ||
| Fig. 1 XRD patterns of (a) Fe3O4, (b) Fe3O4@SiO2 (the amount of TEOS fixed at 5.34 mL) and (c) Fe3O4@SiO2@Gd2O3:Yb,Er nanoparticles (S3). | ||
The size and morphology of Fe3O4, Fe3O4@SiO2, and Fe3O4@SiO2@Gd2O3:Yb,Er nanostructures are shown in Fig. 3 and 4. From the SEM images in Fig. 3a–f, it can be seen that Fe3O4 nanoparticles are quite uniform and possess spherical morphology. The Fe3O4@SiO2 nanoparticles show relative monodispersity with little aggregation. After coating Gd2O3:Yb,Er on Fe3O4@SiO2 nanoparticles, the morphology of the obtained Fe3O4@SiO2@Gd2O3:Yb,Er (Fig. 4) is similar as the corresponding Fe3O4@SiO2 nanoparticles, but the size is largely influenced by the quality of subsequent coating.20
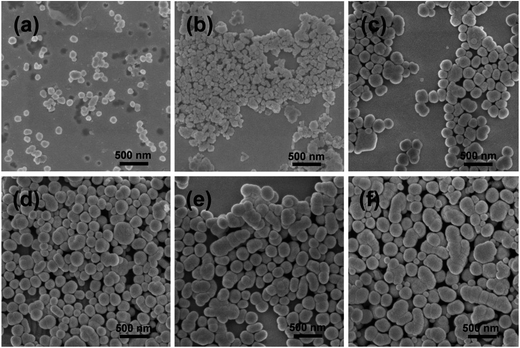 | ||
| Fig. 3 SEM images of Fe3O4 (a) and Fe3O4@SiO2 nanoparticles with different thickness of SiO2 shells obtained using (b) 0.53, (c) 2.67, (d) 5.34, (e) 13.35, and (f) 18.69 mL TEOS as precursor. | ||
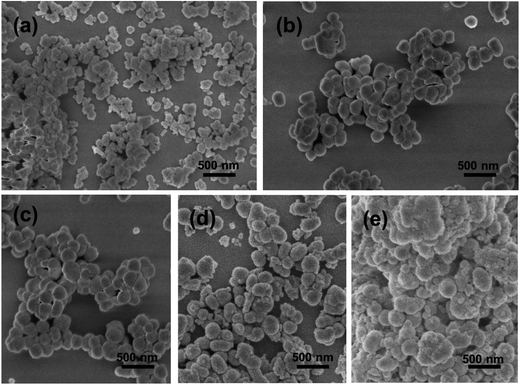 | ||
| Fig. 4 SEM images of Fe3O4@SiO2@Gd2O3:Yb,Er with different thickness of SiO2 mid-layers obtained using (a) 0.53, (b) 2.67, (c) 5.34, (d) 13.35, and (e) 18.69 mL TEOS as precursor. | ||
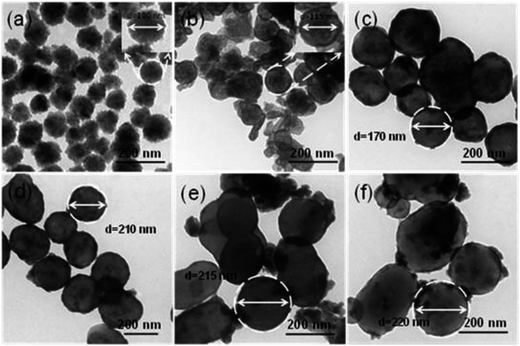
TEM characterization is conducted to further investigate the interior structure of the nanoparticles (Fig. 5). The mid-layer of SiO2 and the outer layer of Gd2O3:Yb,Er can be clearly observed, combined with the XRD data, indicating that the successful synthesis of core–shell Fe3O4@SiO2@Gd2O3:Yb,Er nanoparticles. The sizes of the nanoparticles increase when more TEOS precursor is used in the coating process. High angle annular dark field-scanning transmission electron microscopy (HAADF-STEM) and elemental mapping have also been performed to reveal the elemental distribution in the microspheres. The HAADF-STEM images indicate that the Fe3O4@SiO2@Gd2O3:Yb,Er (S3) possesses well defined core–shell structure (Fig. 6a–c). The EDX elemental mapping of Fe, O, Si, Gd, Er, and Yb (Fig. 6d–i) further confirm the structure as these elements are well dispersed at specific location in the core–shell structure. The line scanning and mapping results (Fig. 7A) indicate that the elements Fe, O, Si, Gd, Er and Yb are spread evenly throughout the whole spheres. Meanwhile, the Si, Gd, Er and Yb are almost completely located on the outermost surface of the microspheres. The energy-dispersive spectrum (EDS) result (Fig. 7B) also reveals that Fe, O, Si, Gd, Er and Yb are contained in the sample. The size and morphology of Fe3O4@SiO2@Gd2O3:Yb,Er nanoparticles with different thickness of SiO2 mid-layer can be tuned. From the XRD data (Fig. 2), the crystallinity of Gd2O3 in S1 and S5 are relatively low. A very thin layer of SiO2 which cannot act as an effective spacer means that some Fe3O4 are still exposed (S1). As a result, a large portion of Gd2O3 react with Fe3O4 at 800 °C during the synthesis of Gd2O3:Yb, Er.21 The severe aggregation and the breakdown of spherical morphology in TEM image (Fig. 5b) may also indicate the occurrence of this reaction. However, with a thick SiO2 layer (S5), the size of Fe3O4@SiO2@Gd2O3:Yb,Er nanoparticles is about 200 nm, which is twice as large as S1. More aggregated particles will form at the same time. Like cerium oxide, there may also occur a chemical reaction between gadolinium oxide particles or gadolinium precursor and SiO2.22 Larger surface area of SiO2 makes more gadolinium take part in the reaction under the same molar ratio of (Gd2O3)/(Fe3O4@SiO2), finally leading to the low crystallinity of Gd2O3 (S5). This phenomenon can be proven by HADDF-STEM (Fig. 8A) and EDX elemental mapping images (Fig. 8B) of Fe3O4@Gd2O3:Yb,Er after removing SiO2 from Fe3O4@SiO2@Gd2O3:Yb,Er nanoparticles (S5). There still exists some Si element close to gadolinium element even after removing SiO2 by 2 M NaOH twice. This left part of Si could be the section that reacts with gadolinium. Because the reacted Si does not exist in the type of SiO2, they cannot be removed by NaOH. This is a powerful proof for the chemical reaction between gadolinium oxide particles or gadolinium precursor and SiO2. That is to say too thin or too thick SiO2 layer is not helpful for crystallization of Gd2O3.
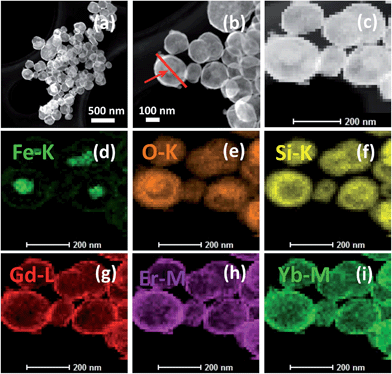 | ||
| Fig. 6 (a)–(c) HAADF-STEM images of Fe3O4@SiO2@Gd2O3:Yb,Er (S3) and (d)–(i) EDX elemental mapping of Fe, O, Si, Gd, Er and Yb in Fe3O4@SiO2@Gd2O3:Yb,Er (S3). | ||
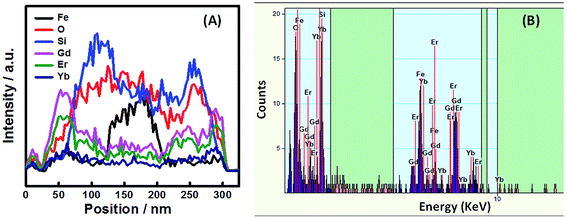 | ||
| Fig. 7 (A) line scanning profiles of Fe, O, Si, Gd, Er and Yb in Fe3O4@SiO2@Gd2O3:Yb,Er (S3) recorded along the line shown in Fig. 6c, (B) EDS spectrum of Fe3O4@SiO2@Gd2O3:Yb,Er (S3) recorded for the given point that the arrow indicated in Fig. 6c. | ||
 | ||
| Fig. 8 (a and b) HAADF-STEM images of Fe3O4@Gd2O3:Yb,Er (S5) and (c) EDX elemental mapping of Si in Fe3O4@Gd2O3:Yb,Er (S5). | ||
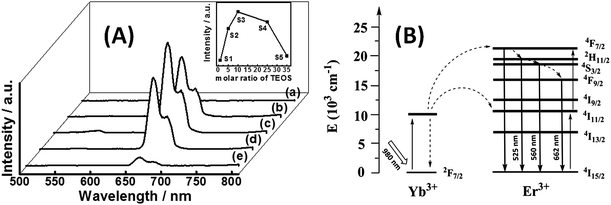
The up-conversion luminescence (UCL) spectra of Fe3O4@SiO2@Gd2O3:Yb,Er with different thicknesses of SiO2 layer under 980 nm NIR excitation are shown in Fig. 9A. There are three emission band appeared in the spectra. Fig. 9B displays the energy level diagrams of Er3+ and Yb3+ ions and possible mechanism accounting for the four emissions under 980 nm excitation. The green emission band in 525 nm and 560 nm are attributed to the transitions 2H11/2 to 4I15/2 and 4S3/2 to 4I15/2 and the red emission band in 662 nm corresponds to the 4F9/2 to 4I15/2 transition.15 As the molar ratio of Yb/Er in Gd2O3:Yb,Er is 10![[thin space (1/6-em)]](https://www.rsc.org/images/entities/char_2009.gif) :
:![[thin space (1/6-em)]](https://www.rsc.org/images/entities/char_2009.gif) 1, the dominant emission is in red region, which can be seen by naked eye as well.23 The inset in Fig. 9A shows the relationship between the thickness of SiO2 mid-layer and luminescence intensity at 662 nm of Fe3O4@SiO2@Gd2O3:Yb,Er (S1–S5). The intensity of luminescence is low at first (S1), then increases rapidly (S2) and reaches the highest point (S3), then decrease a little (S4), at last it decreases to nearly initial level (S5). There are two reasons accounting for this phenomenon: (1) direct contact between Fe3O4 and Gd2O3:Yb,Er will cause strong quenching effect on luminescence, this negative effect is weakened to some extent when Fe3O4 is coated by SiO2, so the luminescent intensities from S1 to S3 increase with the increase of the thickness of SiO2 layer; (2) Gd2O3 acts as matrix material for luminescence, so better crystallinity is significant for well-defined optical properties.24,25 The crystallinity of Gd2O3 in S1, S2 and S3 follows this order: S3 > S2 > S1. However, for S3 to S5, the luminescent intensities from S3 to S5 decrease with the further increase of the thickness of SiO2 layer, a thicker SiO2 mid-layer do not mean a better optical performance as before. The quenching effect is negligible, the crystallinity of Gd2O3 is the main reason as the crystallinity of Gd2O3 in S3, S4 and S5 follows this order: S3 > S4 > S5. The large particle size and serve aggregation, suppresses the luminescence as well.
1, the dominant emission is in red region, which can be seen by naked eye as well.23 The inset in Fig. 9A shows the relationship between the thickness of SiO2 mid-layer and luminescence intensity at 662 nm of Fe3O4@SiO2@Gd2O3:Yb,Er (S1–S5). The intensity of luminescence is low at first (S1), then increases rapidly (S2) and reaches the highest point (S3), then decrease a little (S4), at last it decreases to nearly initial level (S5). There are two reasons accounting for this phenomenon: (1) direct contact between Fe3O4 and Gd2O3:Yb,Er will cause strong quenching effect on luminescence, this negative effect is weakened to some extent when Fe3O4 is coated by SiO2, so the luminescent intensities from S1 to S3 increase with the increase of the thickness of SiO2 layer; (2) Gd2O3 acts as matrix material for luminescence, so better crystallinity is significant for well-defined optical properties.24,25 The crystallinity of Gd2O3 in S1, S2 and S3 follows this order: S3 > S2 > S1. However, for S3 to S5, the luminescent intensities from S3 to S5 decrease with the further increase of the thickness of SiO2 layer, a thicker SiO2 mid-layer do not mean a better optical performance as before. The quenching effect is negligible, the crystallinity of Gd2O3 is the main reason as the crystallinity of Gd2O3 in S3, S4 and S5 follows this order: S3 > S4 > S5. The large particle size and serve aggregation, suppresses the luminescence as well.
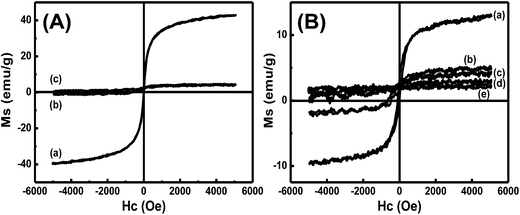
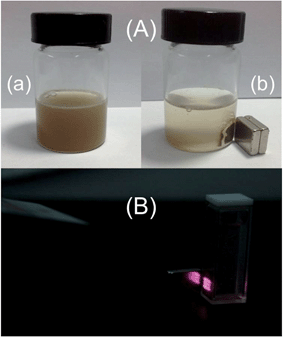
The magnetic property of Fe3O4@SiO2@Gd2O3:Yb,Er nanoparticles is also examined as shown in Fig. 10. The magnetization values are measured to be 42.90, 4.15, and 4.12 emu g−1 for Fe3O4, Fe3O4@SiO2 (the amount of TEOS precursor is fixed at 5.34 mL), and Fe3O4@SiO2@Gd2O3:Yb,Er (S3). The huge decrease in Ms value (42.90 to 4.15 emu g−1) is caused by coating a thick nonmagnetic SiO2 layers (curve b in Fig. 10A).15 However, Ms value of Fe3O4@SiO2 and Fe3O4@SiO2@Gd2O3:Yb,Er (4.15 and 4.12 emu g−1) are nearly the same. A thin Gd2O3:Yb,Er shell which can be clearly seen from the TEM image (Fig. 5d) is formed on the outer layer, causing little influence on the Ms value. The Ms values of Fe3O4@SiO2@Gd2O3:Yb,Er with different thickness of SiO2 mid-layers are 12.89, 4.82, 4.12, 3.09, and 2.22 emu g−1, respectively (Fig. 10B). This is consistent with the thicknesses of SiO2 mid-layers in S1–S5. Thick SiO2 mid-layers may cause the decrease of Ms value. To exhibit a better performance in biological applications, higher luminescent intensity and excellent magnetic property are needed. The dual properties of Fe3O4@SiO2@Gd2O3:Yb,Er are demonstrated by digital photographs in Fig. 11. The Fe3O4@SiO2@Gd2O3:Yb,Er nanoparticles can be easily collected by an external magnetic field near a vessel after several minutes. The red up-converting emitting light of the aqueous solution with dispersed Fe3O4@SiO2@Gd2O3:Yb,Er nanoparticles collected by a magnetic field can be easily seen. Therefore, the bi-functional Fe3O4@SiO2@Gd2O3:Yb,Er nanoparticles with good magnetic and luminescent properties may find a wide range of applications in magnetic, fluorescent, and biological applications.
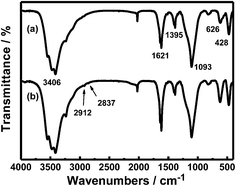
To further expand its application, surface modification with amino group is an excellent tool as it can be linked to specific drug or proteins. Infrared spectroscopy of the sample S3 before and after surface modification is shown in Fig. 12. Bands at 3406 cm−1 and 1621 cm−1 are attributed to bending vibration of absorbed molecular water. The Bands at 1093 cm−1, 626 cm−1 and 428 cm−1 correspond to Si–O bond, Gd–O bond and Fe–O bond. The carboxyl salts belonged to citric acid which was located on the surface of Fe3O4 has a absorption band at 1395 cm−1, After surface modification with amino groups (Fig. 12b), the absorption of asymmetrical and symmetrical stretching of –CH2– which was linked to –NH2 are presented at 2912 cm−1 and 2837 cm−1, suggesting that the nanoparticle is modified with amino groups successfully. As described above, these amino group modified nanoparticles may be applied for drug loading and further move to a specific area to under an external magnetic field.3 Moreover, Another significant application is cell imaging such as the HeLa cells.26 Specific protein is attached onto the nanoparticles and then through the recognition to the specific cells cell-imaging is achieved.
4. Conclusion
In summary, bi-functional core–shell Fe3O4@SiO2@Gd2O3:Yb,Er nanoparticles composed of Fe3O4 cores, SiO2 mid-layers and Gd2O3 shells were synthesized through a relatively simple layer-by-layer deposition process. The obtained Fe3O4@SiO2@Gd2O3:Yb,Er nanoparticles show relative monodispersity and possess magnetic and up-conversion luminescent properties with good water solubility. It is revealed that the SiO2 mid-layer has a great effect on the size, morphology and magnetic and luminescent properties of final bi-functional Fe3O4@SiO2@Gd2O3:Yb,Er nanoparticles. A suitable SiO2 mid-layer may help to gain higher luminescence while maintaining its magnetic property simultaneously. The bi-functional core–shell Fe3O4@SiO2@Gd2O3:Yb,Er nanoparticles may have potential application in MRI, biolabeling, and bioimaging.Acknowledgements
This work was supported by NSFC (21261011), NSFC (21467019), NSFC (21201097), Program for New Century Excellent Talents in University (NCET-10-0907), Application Program from Inner Mongolia Science and Technology Department (2011401), Inner Mongolia Talent Development Fund, and Inner Mongolia “Grassland Talent” Program (12101619) and Natural Science Foundation of Inner Mongolia Autonomous Region of china (2014MS0506).References
- V. Salgueiriño-Maceira, M. A. Correa-Duarte, M. Spasova, L. M. Liz-Marzán and M. Farle, Adv. Funct. Mater., 2006, 16, 509–514 CrossRef.
- J. Kim, Y. Piao and T. Hyeon, Chem. Soc. Rev., 2009, 38, 372–390 RSC.
- S. Gai, P. Yang, C. Li, W. Wang, Y. Dai, N. Niu and J. Lin, Adv. Funct. Mater., 2010, 20, 1166–1172 CrossRef CAS.
- H.-P. Zhou, C.-H. Xu, W. Sun and C.-H. Yan, Adv. Funct. Mater., 2009, 19, 3892–3900 CrossRef CAS.
- G. Wang, Q. Peng and Y. Li, Acc. Chem. Res., 2011, 44, 322–332 CrossRef CAS PubMed.
- N. M. Idris, Z. Li, L. Ye, E. K. Wei Sim, R. Mahendran, P. C.-L. Ho and Y. Zhang, Biomaterials, 2009, 30, 5104–5113 CrossRef CAS PubMed.
- H. Hu, M. Yu, F. Li, Z. Chen, X. Gao, L. Xiong and C. Huang, Chem. Mater., 2008, 20, 7003–7009 CrossRef CAS.
- Z. Liu, G. Yi, H. Zhang, J. Ding, Y. Zhang and J. Xue, Chem. Commun., 2008, 44, 694–696 RSC.
- J. H. Zeng, J. Su, Z. H. Li, R. X. Yan and Y. D. Li, Adv. Mater., 2005, 17, 2119–2123 CrossRef CAS.
- L. Wang, R. Yan, Z. Huo, L. Wang, J. Zeng, J. Bao, X. Wang, Q. Peng and Y. Li, Angew. Chem., Int. Ed., 2005, 44, 6054–6057 CrossRef CAS PubMed.
- R. Abdul Jalil and Y. Zhang, Biomaterials, 2008, 29, 4122–4128 CrossRef CAS PubMed.
- J. Shen, L.-D. Sun, Y.-W. Zhang and C.-H. Yan, Chem. Commun., 2010, 46, 5731–5733 RSC.
- L. Zhang, Y. S. Wang, Y. Yang, F. Zhang, W. F. Dong, S. Y. Zhou, W. H. Pei, H. D. Chen and H. B. Sun, Chem. Commun., 2012, 48, 11238–11240 RSC.
- X. Zhu, J. Zhou, M. Chen, M. Shi, W. Feng and F. Li, Biomaterials, 2012, 33, 4618–4627 CrossRef CAS PubMed.
- X. Yu, Y. Shan, G. Li and K. Chen, J. Mater. Chem., 2011, 21, 8104–8109 RSC.
- D. Hu, M. Chen, Y. Gao, F. Li and L. Wu, J. Mater. Chem., 2011, 21, 11276–11282 RSC.
- Y. Zhang, S. Pan, X. Teng, Y. Luo and G. Li, J. Phys. Chem. C, 2008, 112, 9623–9626 CAS.
- W. Li, Y. Deng, Z. Wu, X. Qian, J. Yang, Y. Wang, D. Gu, F. Zhang, B. Tu and D. Zhao, J. Am. Chem. Soc., 2011, 133, 15830–15833 CrossRef CAS PubMed.
- T.-K. Tseng, J. Choi, M. Davidson and P. H. Holloway, J. Mater. Chem., 2010, 20, 6111–6115 RSC.
- H. Sun, J. He, J. Wang, S.-Y. Zhang, C. Liu, T. Sritharan, S. Mhaisalkar, M.-Y. Han, D. Wang and H. Chen, J. Am. Chem. Soc., 2013, 135, 9099–9110 CrossRef CAS PubMed.
- X. Niu, H. Li and G. Liu, J. Mol. Catal. A: Chem., 2005, 232, 89–93 CrossRef CAS PubMed.
- N. C. Strandwitz and G. D. Stucky, Chem. Mater., 2009, 21, 4577–4582 CrossRef CAS.
- L. Zhou, Z. Gu, X. Liu, W. Yin, G. Tian, L. Yan, S. Jin, W. Ren, G. Xing, W. Li, X. Chang, Z. Hu and Y. Zhao, J. Mater. Chem., 2012, 22, 966–974 RSC.
- M.-H. Qu, R.-Z. Wang, Y. Chen, Y. Zhang, K.-Y. Li, H. Zhou and H. Yan, J. Lumin., 2014, 148, 181–185 CrossRef CAS PubMed.
- C. Zhao, X. Kong, X. Liu, L. Tu, F. Wu, Y. Zhang, K. Liu, Q. Zeng and H. Zhang, Nanoscale, 2013, 5, 8084–8089 RSC.
- C. Mi, J. Zhang, H. Gao, X. Wu, M. Wang, Y. Wu, Y. Di, Z. Xu, C. Mao and S. Xu, Nanoscale, 2010, 2, 1141–1148 RSC.
| This journal is © The Royal Society of Chemistry 2014 |

