Mn2+ ion influenced optical and photocatalytic behaviour of Mn–ZnS quantum dots prepared by a microwave assisted technique

S. Joicya, R. Saravananb, D. Prabhuc, N. Ponpandiand and P. Thangadurai*a
aCentre for Nanoscience and Technology, Pondicherry University, Kalapet, Puducherry-605 014, India. E-mail: thangaduraip.nst@pondiuni.edu.in
bPhysics Research Centre, Dhanalakshmi College of Engineering, Tambaram, Chennai 601 301, India
cCentre for Fuel Cell Technology and Centre for Automotive Energy Materials IIT M Research Park, Phase-1, Kanagam Road, Taramani, Chennai-600 113, India
dDepartment of Nanoscience and Technology, Bharathiar University, Coimbatore 641 046, India

Received 16th August 2014 , Accepted 4th September 2014

First published on 5th September 2014


Abstract

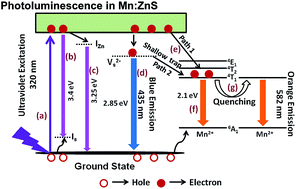
Fluorescent zinc blende structured pure and Mn2+ ion doped ZnS (Mn–ZnS) quantum dots were prepared via a rapid microwave assisted technique without any surfactants and their photocatalytic activity was tested for the photodegradation of methyl orange dye under UV light irradiation. They were characterized by X-ray diffraction, FE-SEM, UV-Vis and photoluminescence spectroscopies, XRF and BET surface area analysis. The Mn–ZnS quantum dots possessed a cubic blende crystal structure without any impurity phases. The absorption maximum by UV-Vis spectroscopy showed a blue shift with increasing Mn2+ content. Photoluminescence of Mn–ZnS was obtained as a result of combined broad blue emission from sulfur vacancies existing in the ZnS host and orange emission from the 4T1–6A1 transition of Mn2+. The relative intensity of blue to orange emissions was found to be quenched with increasing Mn2+ ion concentration. Methyl orange dye was photodegraded by Mn–ZnS quantum dots effectively up to a doping level of 4.28% Mn2+ and further increase in Mn2+ decreased the photocatalytic activity. Detailed mechanisms of photoluminescence and photocatalytic activity were proposed and discussed. The results suggested that the Mn–ZnS material is a potential candidate for photocatalytic applications.


1. Introduction

In recent years, semiconductor quantum dots (SQDs) have become popular due to their excellent optical and electrical properties. They exhibit quantum confinement effects, possess long fluorescence life times, high quantum yield and narrow emission which make them suitable for applications such as luminescent solar concentrators, light emitting diodes and bioanalysis.1–4 Optical properties of SQDs can be tailored by controlling the size of the particles below Bohr's excitonic radius and by introducing luminescent activators into the host material and can be used for applications varying from photocatalytic water treatment to bio-imaging.5 Among II–VI SQDs, cubic blende structured ZnS stands out as prominent fluorescent host material for a large variety of dopants due to low cost, direct wide optical band gap (3.67 eV), large exciton binding energy (40 meV) and relatively non-toxic when compared to cadmium based QDs.6,7 Furthermore, ZnS acts as a good photocatalyst for degrading organic dyes under UV-light irradiation.8,9 However, fast recombination of electron–hole pairs generated in ZnS limits its application in photocatalysis. Having a scope to enhance the photoluminescence and photocatalytic properties of ZnS by suitable doping, Mn2+ ion was chosen as a luminescent activator in ZnS QDs because of its excellent photo-emission in visible to near infrared region. The Mn2+ ions can also assist to increase the lifetime of photogenerated charge carriers in the ZnS host to be used in photocatalytic applications.10 Currently, a number of traditional synthesis approaches have been proposed for transition metal ion doped ZnS QDs such as reverse micelle route, hydrothermal and wet chemical methods.11–13 Over many methods proposed for the synthesis of transition metal ion doped ZnS QDs, the use of microwave energy has advantages of rapid volumetric heating, energy efficient, quick reaction time, eco and user friendly.

This work reports the surfactants free microwave synthesis of pure and Mn ions doped ZnS QDs. Their structural and optical properties, and photocatalytic degradation of methyl orange (under UV irradiation) have been studied at room temperature and reported. Based on those results, a feasible mechanism for photoluminescence and photocatalytic activity of Mn–ZnS QDs have been proposed and discussed.

2. Experimental details

2.1 Starting materials

Commercially available zinc acetate dihydrate (Zn(C2H3O2)2·2H2O) and thiourea (CH4N2S) from Himedia Chemicals (India), manganese acetate tetra-hydrate (C4H6MnO4·4H2O) and methyl orange (MO) organic dye from Sigma Aldrich were used as-received without further purification. Double distilled water was used throughout the preparation.

2.2 Synthesis of pure and Mn–ZnS QDs

The ZnS QDs with various concentrations of Mn2+ were prepared via microwave assisted technique.14 In a typical approach, precursor solution of Zn2+/thiourea was prepared by mixing aqueous solutions of 0.1 M zinc acetate hexahydrate (100 ml) and 0.1 M thiourea (100 ml) under continuous stirring for 1 h to obtain a clear transparent solution. The uncovered beaker containing the precursor solution was irradiated by microwave energy at 540 W by using domestic microwave oven for 45 minutes followed by natural cooling to room temperature. Finally, a dry pale yellowish powder was obtained. In the same procedure, manganese acetate was used as a Mn ion source to prepare Mn–ZnS QDs with five different concentrations of Mn2+ with the maximum of 6.45% Mn2+. The Mn ion doped ZnS samples are labelled as Mn–ZnS-A, Mn–ZnS-B, Mn–ZnS-C, Mn–ZnS-D and Mn–ZnS-E. Qualitative composition analysis of all the Mn–ZnS samples performed by EDS (spectra are shown in Fig. S1 in ESI) shows the presence of Zn, S in pure ZnS and Zn, S and Mn in Mn–ZnS samples. Quantitative composition analysis made by XRF for all the samples are presented in Table T1 in the ESI. Hereafter, Mn–ZnS label will be used in a common reference and Mn–ZnS-A, Mn–ZnS-B, etc will be used in specific reference of each sample.

2.3 Characterization

The X-ray diffraction (XRD) patterns for structural analysis were acquired in Rigaku Ultima-IV powder X-ray diffractometer by using Cu-Kα1 radiation (λ = 1.5406 Å) in a θ–2θ geometry in reflection mode. High magnification SEM images were acquired in a Quanta FE-SEM electron microscope operated at 30 kV. Energy dispersive spectroscopy (EDS) measurement was employed for qualitative chemical analysis by using EDS detector coupled with the FE-SEM. Quantitative chemical analysis was carried out using Rigaku XRF spectrometer (Primini) operated in WDXRF mode. Brunauer–Emmett–Teller (BET) specific surface area analysis was measured in Micromeritics Gemini VII 2390 by using N2 adsorption at 77 K. The UV-Vis absorption spectra were recorded on a Lambda 650 Perkin Elmer spectrometer in the range from 200 to 800 nm with 1 nm resolution. Photoluminescence spectra were recorded in HORIBA FluoroMax-4 spectrofluorometer with the 320 nm excitation.

2.4 Photocatalytic experiments

Photocatalytic degradation of methyl orange by Mn–ZnS was studied under UV light irradiation at room temperature. In this experiment, 100 mg of Mn–ZnS was dispersed well in 100 ml aqueous methyl orange solution under stirring for half an hour in dark conditions in order to make certain adsorption equilibrium on the surface of the catalysts. Then, this suspension was irradiated to UV light by an 8 W mercury vapour lamp (λmax = 365 nm) for 2 h under continuous stirring. After every 30 min of irradiation, part of the suspension was collected and sealed in separate containers. They were centrifuged to separate the catalysts from the MO solution and then their UV-Vis spectra were acquired.

3. Results and discussions

3.1 Structure and microstructure analysis

The XRD patterns of pure and all Mn–ZnS are presented in Fig. 1. The structural phase analysis was carried out by comparing the XRD peaks with the JCPDS data (card no: 65-0309) and all the samples possess cubic zinc blende structure of ZnS. No impurity/secondary phases were observed. This suggests and supports that the Mn2+ ions are more easily incorporated in NCs with zinc blende structure than in wurtzite or rock salt structure of NCs.15 Lattice parameters calculated (Table T2 in ESI) by standard procedure show that no significant lattice distortions were occurred even with higher loading of Mn2+ ions. This is probably due to a comparable ionic radii and same oxidation states of Mn2+ and Zn2+ ions. Crystallite sizes calculated by Scherrer equation from XRD line broadening are presented in Table 1. The crystallite sizes lie in the range from 2.38 to 2.46 nm, which are significantly smaller than the excitonic Bohr radius of ZnS (∼2.5 nm).16
image file: c4ra08757g-f1.tif
Fig. 1 XRD patterns of Mn–ZnS quantum dots for various doping concentrations of Mn ions.
Table 1 Crystallite sizes of Mn–ZnS quantum dots obtained from the analysis of XRD patterns (by Scherrer equation)
Sample description Average crystallite size (nm)
Pure ZnS 2.38
Mn–ZnS-A 2.40
Mn–ZnS-B 2.42
Mn–ZnS-C 2.43
Mn–ZnS-D 2.45
Mn–ZnS-E 2.46


Fig. 2 presents the microstructure of all Mn–ZnS by FE-SEM micrographs. The SEM micrographs reveal that the particles are agglomerated. This agglomeration of particles is caused by two factors: (i) because of the larger surface area of quantum dots (SBET measurement results are shown in Table 2) and (ii) surfactants were not used for the preparation. The aggregated particles consist of spherical shaped crystallites which are visible in the inset images.


image file: c4ra08757g-f2.tif
Fig. 2 FE-SEM images of (a) pure ZnS (b) Mn–ZnS-A (c) Mn–ZnS–B (d) Mn–ZnS–C (e) Mn–ZnS-D and (f) Mn–ZnS-E. A part of each micrograph marked by circle is magnified and shown as inset marked by a square.
Table 2 Photoluminescence peak positions and relative intensity of blue emission with respect to orange emission in Mn–ZnS QDs
Sample code SBET (m2 g−1) Band gap (eV) Particle size from UV spectra (nm) Peak position Relative intensity of BE with respect to OE (IBE/IOE)
Blue emission (nm) Orange emission (nm)
Pure ZnS 51.51 4.18 2.07 435
Mn–ZnS-A 4.13 2.18 435 582 3.3
Mn–ZnS-B 48.96 4.09 2.28 435 583 1.6
Mn–ZnS-C 4.07 2.34 435 584 1.4
Mn–ZnS-D 50.64 4.00 2.58 435 587 0.8
Mn–ZnS-E 3.94 2.87 435 589 0.7


For better visibility, a part of every SEM image marked with circle is magnified and presented as inset (marked with a square).

3.2 Optical studies

Fig. 3 shows the UV-Vis absorption spectra of Mn–ZnS QDs (the corresponding reflectance spectra is presented in Fig. S2 of the ESI).
image file: c4ra08757g-f3.tif
Fig. 3 UV-Vis absorption spectra of pure and Mn–ZnS. Inset is a plot of band gap energy Eg versus Mn ion concentration.

Absorption peak of all Mn–ZnS shows a blue shift with respect to the bulk ZnS band gap (λ = 340 nm) indicating clearly the quantum confinement effect due to its size smaller than excitonic Bohr's radius. The insert of Fig. 3 shows the variation of band gap energy with Mn ion concentration. It can also be seen that the increasing Mn ion concentration red shifts the band gap. Similar observations have been reported recently.17,18

Particle size of Mn–ZnS was estimated by using the “Effective Mass model” of Brus equation proposed for spherical shaped particles19 and the obtained particle sizes are presented in Table 2. The effective masses m*e = ∼0.25 mo and m*h = ∼0.59 mo (ref. 20) for ZnS with cubic blende structure have been used in the Brus equation.

Fig. 4(a) shows the photoluminescence emission spectra of Mn–ZnS excited at λex = 320 nm. Insert of Fig. 4(a) shows the PL spectra of Mn–ZnS-D and Mn–ZnS-E to have better visibility of their emission bands.


image file: c4ra08757g-f4.tif
Fig. 4 (a) Photoluminescence emission spectra of pure and Mn ions doped ZnS (b) the de-convoluted PL emission spectra of pure ZnS.

The PL peak of the pure ZnS is deconvoluted using Gaussian function by taking into account of the types of possible sources of emissions from the host ZnS (see Fig. 4(b)). The fit provides three emission components with maximum at 360, 382 and 435 nm. Relatively weak UV emissions at 360 and 382 nm are attributed to interstitial sulfur (Is) and interstitial zinc (IZn) related emissions respectively.21 A broad blue emission at 435 nm is attributed to the recombination of electrons in sulfur vacancy donor level (Vs) with holes in the ground state of ZnS host.22,23

The photoluminescence of Mn–ZnS is highly dependent on the location of doped ions within the host material. The emission spectra (Fig. 4(a)) revealed the effect of Mn2+ ion doping that leads to the quenching of host emission considerably at 435 nm and appearance of new luminescence featured at 582 nm which can originate from spin forbidden 4T16A1 transitions within 3d5 configuration of Mn2+ ion.24,25 According to the literature,26 when foreign Mn2+ ions are incorporated into ZnS QDs, the host blue emission (BE) and Mn2+ related orange emission (OE) were observed, while Mn2+ ion activated on ZnS would lead to UV-luminescence with no Mn2+ related luminescence. In our case, the Mn2+ ions are well incorporated in the host lattice, which is also in agreement with the XRD results. Finally, the blue emission originated from the host ZnS at 435 nm is dominated by the OE induced by the Mn2+ ion d–d transition.

The peak positions and relative intensity of the OE with respect to Mn2+ concentration determined from Fig 4(a) are presented in Table 2. With the increase of Mn2+ concentration, there is a red shift in OE of about 7 nm from 582 to 589 nm. The red shift in OE has been observed by many researchers.23,27–30 According to those reports, the red shift in OE is caused by a high density of surface defects or strong electron–phonon coupling effects. Kole and co-workers have reported that the increase in particle size and decrease in density of surface states leads to a red shift in emission wavelength.30 In addition to this, Karar et al.28 have mentioned that the red shift with Mn ion concentration can be attributed to a change in band gap structure of ZnS upon Mn2+ ion incorporation or Mn–Mn ion interactions. All these points suggest that the Mn ions are getting well incorporated into the host ZnS lattice and shifting the emission to a longer wavelength with increasing doping concentration. Similarly, intensity quenching of OE with doping concentration had been observed by many groups13,20,26 and this type of intensity quenching of OE is observed in Mn–ZnS (Fig. 4(a)) in our case. The relative intensity of OE increases up to 1.79% Mn2+ and decreases with further increase in it, which agrees well with the literatures.23,31 The shift up to 1.79% is mainly due to the capture of more electron–hole pairs by luminescent centers (Mn2+ ions) resulting in emission of more number of photons.32 The OE quenching above 1.79% is due the transfer of photoexcited electrons from one Mn2+ ion to its nearest neighbor Mn2+ ion via non-radiative transitions followed by a number of transfer steps.31 There are reports where no such quenching was observed due to a small percentage of dopant concentrations.33 Furthermore, in order to understand the variation of relative intensity of BE (at 435 nm) to OE against Mn2+ concentration, a peak intensity ratio of BE with respect to OE (IBE/IOE) is determined (see Table 2). With the increase of Mn2+ concentration, the intensity of BE arises from sulfur vacancy is decreasing as compared to OE originating from 3d5 configuration of Mn2+ ion. A detailed mechanism of photoluminescence along with optical quenching in Mn–ZnS QDs due to Mn ion doping is explained in the schematic energy level diagram presented in Scheme 1. Photoluminescence mechanism (Scheme 1) is beginning with an excitation of ground state electrons to the excitonic states in the ZnS host lattice when excited with the 320 nm light. The excited electrons can recombine with holes in the ground state through different path ways either by radiative or non-radiative recombination.


image file: c4ra08757g-s1.tif
Scheme 1 Photoluminescence mechanism in Mn–ZnS quantum dots (a) photon absorption and exciton formation, (b) interstitial sulfur emission, (c) interstitial zinc emission, (d) blue emission, (e) electron trapping by Mn ions' d state, (f) orange light emission and (g) orange emission quenching by electrons trapped by the neighbour Mn2+ ions.

In our case, there are three main paths possible for the exciton recombination. Firstly, the electron in the conduction band (CB) of ZnS lattice is radiatively relaxes to the holes in the valence band (VB) through interstitial sites such as interstitial sulfur (Is) and interstitial zinc (Iz) along with UV emission. Here, Is state should be positioned closer to the valence band than Iz state closer to the conduction band. This is due to lattice strain introduced by Is states because ionic radius of sulfur ion is slightly larger than that of Zn ions. Due to such strain, the electron levels initiated from the Is will have a small binding energy.21 Secondly, the BE at 435 nm is due to a relaxation that occurs when the excited state electrons are trapped by sulfur vacancy donor levels. Two probable paths can be suggested for the third relaxation process. Path 1: the excited electrons trapped by sulfur vacancy level are non-radiatively relax to the 4T1 level of Mn2+. Path 2: the electrons in the excited states directly relax to the 4T1 level of Mn2+ by non-radiative transition. The electrons collected in 4T1 level of Mn2+ via path 1 and 2 recombine with holes trapped in the ground state (6A1) of Mn2+ ion by radiative transitions. This radiative transition is accompanied by an OE at 582 nm. The relative intensity of OE is more intense than the BE. This is because the non-radiative transition of electrons from CB to 4T1 level of Mn2+ ion is faster than the electrons captured by sulfur vacancy level.34 In addition, as the concentration of Mn2+ increases from 1.79% to higher, there is a decrease in intensity of OE. This quenching is due to non-radiative migration of excitation energy from one Mn2+ ion site to its neighbouring Mn2+ion site.

3.3 Photocatalytic studies

Photocatalytic activity of Mn–ZnS QDs was evaluated by the photodegradation of a model organic dye methyl orange in aqueous solution under UV light irradiation. Photodegradation of MO with the assistance of Mn–ZnS for different Mn ion concentrations was performed. The photodegradation efficiency of Mn–ZnS catalysts is drawn between concentration of dye versus UV light irradiation time and presented in Fig. 5(a). Without loading any catalysts, photosensitivity of MO was observed for 2 h under UV light exposure and there was no change in MO concentration (see Fig. 5(a)). It confirms that MO does not undergo any decomposition by itself under UV-light. Percentage of photocatalytic degradation efficiency of Mn–ZnS catalysts is calculated by using the following relation (eqn (1)) and they are listed in Table 3:
 
image file: c4ra08757g-t1.tif(1)
where, C0 and C are concentration of MO dye before and after illumination of UV light for time ‘t’ minutes respectively.

image file: c4ra08757g-f5.tif
Fig. 5 (a) Photocatalytic degradation of MO without and with Mn–ZnS as a function of exposure time (b) pseudo-first order plots of −ln(C0C) versus irradiation time based on the data in (a) and (c) typical set of absorption spectra of MO aqueous solution in the presence of Mn–ZnS-D catalyst for different UV light exposure times.
Table 3 MO degradation efficiency rate and reaction rate constant k (10−2 min−1) of Mn–ZnS (in %) for various time of UV light irradiation
Sample Degradation rate, η (in %) of methyl orange (MO) under UV light for irradiation time (minutes) Rate constant k (10−2 min−1)
30 60 90 120
ZnS 23 24.5 39.4 41.2 0.433
Mn–ZnS-A 16.6 30.9 38.2 56.9 0.696
Mn–ZnS-B 21.4 36.1 47.4 67.4 0.849
Mn–ZnS-C 36.8 44.7 56.4 69.4 0.914
Mn–ZnS-D 65.5 68.6 86.9 95.4 2.488
Mn–ZnS-E 26.8 31.7 50.6 70.0 1.054


The photodegradation efficiency is ranging from 16.6% for the undoped ZnS to 95.4% for Mn–ZnS-D for various times of UV irradiation. For a given irradiation time, in all cases, the Mn–ZnS-D shows a maximum efficiency. In general, it can be pointed out that percentage of photodegradation efficiency of Mn–ZnS shows a significant enhancement when compared to the same of undoped ZnS (Fig. 5(a)). When the doping concentration reaches 4.28%, the photodegradation efficiency reaches its highest as 95.4% (for 120 minutes exposure) whereas the same is 41.2% for the undoped ZnS. It is due to the fact that doping of Mn2+ ions prolonged the lifetime of ZnS charge carriers, which has resulted in improving the photodegradation of MO. In the case of undoped ZnS, the photogenerated electron–hole pairs recombine rapidly, hence pure ZnS shows a low photocatalytic activity compared to Mn–ZnS. Increasing photocatalytic activity up to 4.28% Mn2+ is probably due to the alteration of the band gap of ZnS towards the longer wavelength, which in turn, could enhance the utilization efficiency of light exposure. This variation in electronic band structure is reflected in the UV-Vis absorption characteristics of Mn–ZnS (Fig. 3 and Table 2).

Moreover, Choi et al. have reported that the electron–hole recombination rate increased exponentially with increasing impurity ion concentration.35 Therefore, below the optimal concentration (less than 4.28%), less number of trapping sites are available which tends to lengthen the lifetime of the excitons. Further increase in dopant concentration (6.45%), the photocatalytic degradation turns to be weak. According to earlier reports, there are some possible reasons behind this photocatalytic reduction at higher concentration; (i) through quantum tunnelling electron–hole recombination rate suppresses the electrons trapped by impurity (Mn2+) ions (even though there is a high probability of electron–hole trapping at higher concentration) thereby reducing the degradation rate of MO,36 (ii) recombination rate through quantum tunnelling between the excitons depends on the separation distance (R) of the charge carriers given as follows,35,37

 
image file: c4ra08757g-t2.tif(2)
where KR is the recombination rate, R is the distance separating the charge carriers and a0 is the radius of hydrogenic wave function of the trapped charge carriers. According to eqn (2), R decreases as the average distance between the trapping sites decreases when dopant concentration reaches beyond the optimal concentration. Fig. 5(b) depicts the linear plots of −ln(C0C) as a function of irradiation time. The photocatalytic reaction rate constant was calculated from the slope of the linear fitted line: −ln(C0C) = kt (see Fig. 5(b), where C0 and C are the concentrations of MO at the irradiation time 0 and t min respectively, k is the pseudo-first order reaction rate constant (min−1) and they are listed in Table 3. Higher reaction rate constant was found for Mn–ZnS-D sample (2.49 × 10⁻² min−1). Fig. 5(c) shows the typical absorption spectra of MO solution in the presence of Mn–ZnS-D catalyst under UV light irradiation for various times. As the exposure time increases, the intensity of the absorption peak of MO dye at 465 nm gradually decreases and nearly disappears after 120 min of exposure.

3.3.1 Photocatalytic mechanism in Mn–ZnS. In order to understand the role of Mn ions on the electronic band structure of ZnS for the enhanced photocatalytic performance, a possible mechanism under UV-light exposure is proposed as presented in Scheme 2. Based on the obtained results and in concurrence with available reports,38–40 the photodegradation mechanism of Mn–ZnS on MO can be explained by the following steps:
image file: c4ra08757g-s2.tif
Scheme 2 Schematic diagram explaining a possible mechanism of photocatalytic activity of Mn–ZnS in the degradation of MO dye under UV-light irradiation.

Step 1: electron–hole pair generation.
 
ZnS + → ZnS (hVB+ + eCB) (3)

Step 2: charge trapping.
 
Vs2− + eCB → Vs (4)
 
Mnn+ + eCB → Mn(n−1)+ (5)
 
Mnn+ + hVB+ → Mn(n+1)+ (6)

Step 3: reduction and oxidation process.
 
eCB + O2 → O2˙ (7)
 
H2O + O2˙ → OOH˙ + OH (8)
 
2OOH˙ → O2 + H2O2 (9)
 
H2O2 + O2˙ → OH˙ + OH + O2 (10)
 
hVB+ + OH → OH˙ (11)
 
hVB+ + H2O → OH˙ + H+ (12)
 
OH˙ + O2˙ + MO → H2O + CO2 (13)
where Vs is a sulfur vacancy, M is dopant ion (Mn2+), and n is valency of dopant ion. On the basis of above equations (eqn (3)–(13)), the photocatalytic mechanism can be explained by several steps: step 1: the photocatalytic reaction is initiated with charge pair generation on the surface of Mn–ZnS catalysts by the irradiation of UV light (eqn (3)). Step 2: the existence of sulfur vacancy and incorporation of Mn2+ ion in the ZnS lattice, act as a reservoir of electrons or holes and booster for interfacial charge transfer thus suppresses the rate of electron–hole recombination leading to superior photocatalytic degradation (eqn (4)–(6)). Step 3: the photogenerated electrons in the CB of ZnS can react with electron acceptors such as O2, which are adsorbed on the surface of ZnS, to produce superoxide radical anions O2˙ (eqn (7)). Step 4: then these superoxide radical anions (O2˙) further react with hydrogen peroxide to create hydroxyl radicals, OH and O2 molecules (eqn (8)–(10)). Step 5: concurrently, the photogenerated holes left in the valence band state of ZnS can be captured by OH and generate hydroxyl radicals OH˙ (eqn (11)). Step 6: on the other hand, holes at the valence band can dissociate the H2O molecules into powerful oxidant OH˙ radicals plus hydrogen cations (eqn (12)). Step 7: finally, the overall photocatalytic reaction is determined by photogenerated strong OH˙ radicals and superoxide radical anion (O2˙) species, which are major active oxidizers capable of fighting with molecular structure of MO organic pollutants and decomposes them into degradable products such as CO2 and H2O (eqn (13)).

4. Conclusion

In summary, rapid microwave synthesized undoped and Mn2+ ion doped ZnS QDs have been well characterized for their structural and optical behavior. Maximum PL emission was obtained with 1.79% Mn ions and further increase in Mn concentration has led to a luminescence quenching of orange emission, which was due to the charge transfer from Mn2+ ion to its nearest neighbour ions. The Mn–ZnS QDs have shown a good photodegradation efficiency and much faster when compared to the undoped ZnS. The introduction of new transition states in the ZnS lattice by incorporating Mn2+ impurity ions and existence of sulfur vacancies to trap the photogenerated electrons in the conduction band has resulted in improved photocatalytic activity. Optimum concentration of 4.28% Mn had performed the highest photobleaching of MO under UV light irradiation (95.6%). Possible mechanisms for the photoluminescence emission and photocatalytic activity against MO dye were elucidated and discussed in detail. Based on the performance, these materials are proved to be a potential environmental friendly materials for photocatalytic applications.

Acknowledgements

Financial support from UGC-MRP (F. no. 41-934/2012 (SR) dated 23.07.2012) to carry out this research is gratefully acknowledged.

Notes and references

  1. A. P. Alivisatos, J. Phys. Chem., 1996, 100, 13226 CrossRef CAS.
  2. F. P. Milton and Y. K. Gunko, J. Mater. Chem., 2012, 22, 16687 RSC.
  3. L. Sun, J. J. Choi, D. Stachnik, A. C. Bartnik, B. R. Hyun, G. G. Malliaras, T. Hanrath and F. W. Wise, Nat. Nanotechnol., 2012, 7, 369 CrossRef CAS PubMed.
  4. R. Gill, M. Zayats and I. Willner, Angew. Chem., Int. Ed., 2008, 47, 7602 CrossRef CAS PubMed.
  5. S. Shen and Q. Wang, Chem. Mater., 2013, 25, 1166 CrossRef CAS.
  6. A. Mandal, A. Dandapat and G. De, Analyst, 2012, 137, 765 RSC.
  7. J. H. Yu, J. Joo, H. M. Park, S. Baik, Y. W. Kim, S. C. Kim and T. Hyeon, J. Am. Chem. Soc., 2005, 127, 5662 CrossRef CAS PubMed.
  8. A. L. Stroyuk, A. E. Raevskaya, A. V. Korzhak and S. Y. Kuchmii, J. Nanopart. Res., 2007, 9, 1027 CrossRef CAS.
  9. D. Chen, F. Huang, G. Ren, D. Li, M. Zheng, Y. Wang and Z. Lin, Nanoscale, 2010, 2, 2062 RSC.
  10. H. Yang, S. Santra and P. H. Holloway, J. Nanosci. Nanotechnol., 2005, 5, 1364 CrossRef CAS PubMed.
  11. R. M. K. Whiffen, D. J. Jovanovic, Z. Antic, B. Bartova, D. Milivojevic, M. D. Dramicanin and M. G. Brik, J. Lumin., 2014, 146, 133 CrossRef PubMed.
  12. Q. Pan, D. Yang, Y. Zhao, Z. Ma, G. Dong and J. Qiu, J. Alloys Compd., 2013, 579, 300 CrossRef CAS PubMed.
  13. A. A. Ashkarran, Mater. Sci. Semicond. Process., 2014, 17, 1 CrossRef CAS PubMed.
  14. D. W. Synnott, M. K. Seery, S. J Hinder, J. Colreavy and S. C. Pillai, Nanotechnology, 2013, 24, 045704 CrossRef PubMed.
  15. S. C. Erwin, L. Zu, M. I. Haftel, A. L. Efros, T. A. Kennedy and D. J. Norris, Nature, 2005, 436, 91 CrossRef CAS PubMed.
  16. V. L. Gayou, B. S. Hernandez, R. D. Macuil, G. Zavala, P. Santiago and A. I. Oliva, J. Nano Res., 2010, 9, 125 CrossRef CAS.
  17. R. Sahraei, A. Daneshfar, A. Goudarzi, S. Abbasi, M. H. Majles Ara and F. Rahimi, J. Mater. Sci.: Mater. Electron., 2013, 24, 260 CrossRef CAS.
  18. A. Jain, S. Panwar, T. W. Kang, H. C. Jeon, S. Kumar and R. K. Choubey, J. Mater. Sci.: Mater. Electron., 2014, 25, 1716 CrossRef CAS PubMed.
  19. M. N. Kalasad, M. K. Rabinal and B. G. Mulimani, Langmuir, 2009, 25, 12729 CrossRef CAS PubMed.
  20. M. Geszke, M. Murias, L. Balan, G. Medjahdi, J. Korczynski, M. Moritz, J. Lulek and R. Schneider, Acta Biomater., 2011, 7, 1327 CrossRef CAS PubMed.
  21. S. Wageh, Z. S. Ling and X. Xu-Rong, J. Cryst. Growth, 2003, 255, 332 CrossRef CAS.
  22. W. Chen, G. Li, J. Malm, Y. Huang, R. Wallenberg, H. Han, Z. Wang and J. Bovin, J. Lumin., 2000, 91, 139 CrossRef CAS.
  23. J. Cao, J. Yang, Y. Zhang, L. Yang, Y. Wang, M. Wei, Y. Liu, M. Gao, X. Liu and Z. Xie, J. Alloys Compd., 2009, 486, 890 CrossRef CAS PubMed.
  24. H. Yang, P. H. Holloway and B. B. Ratna, J. Appl. Phys., 2003, 93, 586 CrossRef CAS PubMed.
  25. R. N. Bhargava and D. Gallagher, Phys. Rev. Lett., 1994, 72, 416 CrossRef CAS.
  26. K. Sooklal, B. S. Cullum, S. M. Angel and C. J. Murphy, J. Phys. Chem., 1996, 100, 455 CrossRef.
  27. Z. Ren, H. Yang, L. Shen and S. D. Han, J. Mater. Sci.: Mater. Electron., 2008, 19, 1 CrossRef CAS.
  28. N. Karar, F. Singh and B. R. Mehta, J. Appl. Phys., 2004, 95, 656 CrossRef CAS PubMed.
  29. R. Maity and K. K. Chattopadhyay, Nanotechnology, 2004, 15, 812 CrossRef CAS.
  30. A. K. Kole and P. Kumbhakar, Appl. Nanosci., 2012, 2, 15 CrossRef CAS PubMed.
  31. M. Weia, J. Yang, Y. Yan, L. Yang, J. Cao, H. Fu, B. Wang and L. Fan, Phys. E., 2013, 52, 144 CrossRef PubMed.
  32. B. J. P. Ge, J. Wang, H. X. Zhang, X. Wang, Q. Peng and Y. D. Li, Adv. Funct. Mater., 2005, 15, 303 CrossRef.
  33. W. Q. Penga, S. C. Qu, G. W. Cong, X. Q. Zhang and Z. G. Wang, J. Cryst. Growth, 2005, 82, 179 CrossRef PubMed.
  34. M. M. Biggs, O. M. Ntwaeaborwa, J. J. Terblans and H. C. Swart, Phys. B, 2009, 404, 4470 CrossRef CAS PubMed.
  35. W. Choi, A. Termin and M. R. Hoffmann, J. Phys. Chem., 1994, 98, 13669 CrossRef.
  36. M. Chitkara, K. Singh, I. S. Sandhu and H. S. Bhatti, Nanoscale Res. Lett., 2011, 6(438), 1 Search PubMed.
  37. J. Guo, Z. Gan, Z. Lu, J. Liu, J. Xi, Y. Wan, L. Le, H. Liu, J. Shi and R. Xiong, J. Appl. Phys., 2013, 114, 104903 CrossRef PubMed.
  38. R. Qiu, D. Zhang, Y. Mo, L. Song, E. Brewer, X. Huang and Y. Xiong, J. Hazard. Mater., 2008, 156, 80 CrossRef CAS PubMed.
  39. R. Saravanan, S. Joicy, V. K. Gupta, V. Narayanan and A. Stephen, Mater. Sci. Eng., C, 2013, 33, 4725 CrossRef CAS PubMed.
  40. P. Arsana, C. Bubpa and W. Sang-aroon, J. Appl. Sci., 2012, 12, 1809 CrossRef CAS.

Footnote

Electronic supplementary information (ESI) available. See DOI: 10.1039/c4ra08757g

This journal is © The Royal Society of Chemistry 2014
Click here to see how this site uses Cookies. View our privacy policy here.