Electroanalytical study of the viability of conversion reactions as energy storage mechanisms
Alexandre Ponroucha,
Jordi Cabana*bc,
Romain Dugasa,
Jonathan L. Slackc and
M. Rosa Palacín*a
aInstitut de Ciència de Materials de Barcelona (ICMAB-CSIC) Campus UAB, E-08193 Bellaterra, Catalonia, Spain. E-mail: rosa.palacin@icmab.es
bDepartment of Chemistry, University of Illinois at Chicago, Chicago, IL 60607, USA
cEnvironmental Energy Technologies Division, Lawrence Berkeley National Laboratory, Berkeley, CA 94720, USA. E-mail: jcabana@uic.edu
First published on 6th August 2014
Abstract
Storing electrochemical energy by means of fully reducing transition metal compounds to their metallic state is attractive due to the large amounts of charge that are produced. However, while more reversible than originally envisioned, electrochemical conversion reactions are accompanied by large inefficiencies. These inefficiencies are associated with hysteresis between the potentials of reduction and re-oxidation, as well as the loss of capacity when reversing back to the initial state. This work presents a series of results collected from different kinds of electroanalytical experiments. The use of data from conventional powder electrodes as well as thin films offered the opportunity to compare measurements of common occurrence in the literature with more sophisticated experiments carried out at higher temperature, which provided a complete picture of the kinetic nature of the processes involved. This picture is supportive of the thermodynamic nature of potential hysteresis, and indicates that coulombic inefficiencies stem from the low reversibility of the conversion reaction. Taken together, the results cast a clear light on the significant challenges that lie ahead if this kind of reactivity is to become technologically relevant in devices such as Li-ion batteries.
Introduction
Current commercial lithium ion batteries use electrode materials exhibiting an insertion reaction mechanism with lithium for both the positive and negative electrodes. From a crystal-chemical point of view, the redox processes taking place in these compounds involve topotactic reversible intercalation of lithium ions without major structural changes. As a consequence, the electrochemical capacities are limited and seldom attain one mole of lithium (i.e. one mole of electrons) per transition metal ion. Indeed, the useful capacities for LiCoO2 and graphite are roughly 0.5 moles lithium ions/electrons per mole of cobalt (around 150 mA h g−1) and 0.17 moles of lithium ions/electrons per mole of carbon for graphite (close to 372 mA h g−1).Such a limitation handicaps the device in terms of energy density, and hence breakthroughs in performance can only be expected from alternative redox reaction mechanisms (see Fig. 1). Redox reaction mechanisms with lithium different from insertion have extensive precedent. On one hand, the electrochemical formation of alloys was already demonstrated in the 1970's. On the other hand, the first reports of partial reversibility for the mechanism currently termed “conversion reaction” date back to the 1980's,1 although interest in this reactivity was boosted in the last decade after high reversibility and cycling ability was first proved for oxides.2 The main advantage of such alternative reaction pathways is the large increase in electrochemical capacity (i.e. moles of lithium reacted per mole of material). In contrast, the main drawback is that these values are achieved at the expense of major structural changes, which are obviously caused by the major compositional modification of the material. While significant advances have been made for alloys with silicon-based electrodes, placing them in the commercialization pipeline, slow progress, if any, is observed in overcoming the bottlenecks for conversion reaction materials. All in all, conversion reactions remain, to date, a laboratory curiosity which has not had any technological impact in the rechargeable battery field.3
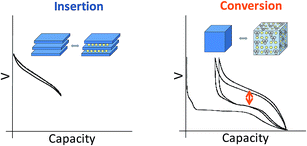 | ||
| Fig. 1 Schematic representation and typical potential vs. capacity profile for conventional insertion and alternative conversion reaction pathways in lithium-ion battery electrodes. | ||
The general conversion reaction can be formulated as:
| MaXb + (b·n) Li ⇌ a M + b LinX | (1) |
A myriad of studies on diverse conversion reaction materials has been published, either pure or composites, exhibiting diverse particle sizes and shapes including nanoarchitectured electrodes.4 Such efforts have, unfortunately, largely focused on improving cycle life and, to a lesser extent, coulombic efficiencies, rather than on yielding a fundamental understanding of this class of reactions. Indeed, even if apparently simple at a first glance, the evolution of the voltage with composition (or degree of charge/discharge), which is the expression of the energetics of the system, reveals a large hysteresis between reduction and oxidation (denoted with an arrow on Fig. 1) that, coupled with poor coulombic efficiencies, ultimately results in unacceptably low roundtrip efficiencies when compared to conventional insertion electrodes. These two effects are particularly pronounced in the first cycle. Aside from such crucial shortcomings, the analysis of the capacity values reported upon cycling generally reveals an additional capacity with respect to theoretical values for full reduction to the metallic state. Two alternative explanations were proposed to account for this observation: electrolyte degradation5–7 and interfacial charge storage in a capacitive-like manner.8,9 Recent studies indicate that this interfacial storage would only account for a small percentage of the experimentally observed capacity, the rest being faradaic in nature and fully related to electrolyte decomposition enhanced by the metal nanoparticles generated upon reduction.10
While there are engineering solutions to electrolyte degradation processes, such as particle coatings,11 the hysteresis barrier appears to be much more difficult to tackle. It is thus unsurprising that most studies related to conversion reaction materials do not even attempt to discuss it. Moreover, if only a plot of capacity vs. cycle number, the most popular metrics in the field, is provided, the daunting magnitude of the phenomenon is not even noticed. The fact that conversion electrodes can simultaneously show large voltage hysteresis and fast kinetics, i.e. when nanostructured current collectors are used,12 indicates that the roundtrip asymmetries are not due to simple ohmic or charge transfer polarization. This hypothesis is supported by first principles modelling on the Li–FeF3 system, which revealed an inherent difference in reaction path between reduction and oxidation, determined by the limitations imposed by the need to transport a second species (e.g., Fe or F) in addition to Li.13 DFT calculations on CoO also suggest an asymmetry in the chemical and electrical responses of the interfaces between oxidation and reduction, which could contribute to the voltage hysteresis.14,15
Within this scenario, we decided to embark on a fundamental study of the issues that could underpin the peculiarities of this kind of reactivity. Amongst the variety of compounds commonly exhibiting this behavior, NiO was selected as the most suited model material since it exhibits the simplest reaction mechanism amongst conversion materials as (i) it entails the operation of a single redox couple as no intermediate oxidation states between +2 and 0 can be expected (in contrast to the case of Co3O4 for which full reduction to Co can entail formation of CoO) and (ii) no insertion with formation of a Li–M–O phase prior to the conversion reaction can occur because there are no vacant positions in the NiO crystal structure. Indeed, it is only in absence of concomitant/successive reactions that a reliable and straigthforward interpretation of the results achieved can be attempted. Thin film electrodes were used in order to carefully study the fundamental mechanisms of the active material without the influence of additives (carbon or binder). These films enabled studies at high temperature, which provided valuable insight into the interplay between kinetics and thermodynamics in the electrochemical reaction. In addition to those, powder composite electrodes containing such additives, analogous to those fabricated with standard materials for commercial Li-ion cells, were also prepared and cycled to assess the representativeness of the behaviour observed for thin film electrodes.
Experimental
NiO in powder form was purchased from Alfa Aesar (99%, catalog number 12359-18), and used as-received, without further purification. NiO thin films were grown by sputter deposition onto 0.33 mm thick × 10 mm diameter Ni substrates. Mechanical polishing, using 4000 grit paper for the final stage, was followed by ultrasonic cleaning in 16![[thin space (1/6-em)]](https://www.rsc.org/images/entities/char_2009.gif) :
:![[thin space (1/6-em)]](https://www.rsc.org/images/entities/char_2009.gif) 1 water
1 water![[thin space (1/6-em)]](https://www.rsc.org/images/entities/char_2009.gif) :
:![[thin space (1/6-em)]](https://www.rsc.org/images/entities/char_2009.gif) Liquinox solution, deionized water rinse, and a final ultrasonic cleaning in electronic grade isopropanol. Once under vacuum, a 1100 V × 30 mA argon plasma etch was swept over the rotating batch of 27 substrates for 10 minutes. A cryopumped vacuum chamber with a 8 × 10⁻⁸ Torr (10−5 Pa) base pressure employed differentially pumped residual gas analysis for partial pressure monitoring during reactive sputtering in an Ar/O2 atmosphere. Twin metallic Ni 2′′ targets in a dual magnetron configuration were powered by a 40 KHz AC power supply. With a target to substrate distance of 12 cm and continuous planetary substrate rotation, initial film growth was in metallic mode at 4.2 mTorr (0.6 Pa) and 100 W, establishing a 60 nm Ni layer onto the Ni substrate, deposited at 16 nm min−1. A continuous transition into a NiO layer followed with the addition of O2 at 23% of the O2/Ar feed, a power ramp up to 370 W, and process pressure increase to 10 mTorr (1.3 Pa). At a NiO thickness estimated to be 275 nm (grown at a 18 nm min−1 rate), O2 flow was reduced to achieve an O2/Ar ratio of 17% and process pressure of 9.2 mTorr (1.2 Pa) for the subsequent 665 nm of film growth, with a rate of 21.5 nm min−1. NiO film thickness was 940 nm.
Liquinox solution, deionized water rinse, and a final ultrasonic cleaning in electronic grade isopropanol. Once under vacuum, a 1100 V × 30 mA argon plasma etch was swept over the rotating batch of 27 substrates for 10 minutes. A cryopumped vacuum chamber with a 8 × 10⁻⁸ Torr (10−5 Pa) base pressure employed differentially pumped residual gas analysis for partial pressure monitoring during reactive sputtering in an Ar/O2 atmosphere. Twin metallic Ni 2′′ targets in a dual magnetron configuration were powered by a 40 KHz AC power supply. With a target to substrate distance of 12 cm and continuous planetary substrate rotation, initial film growth was in metallic mode at 4.2 mTorr (0.6 Pa) and 100 W, establishing a 60 nm Ni layer onto the Ni substrate, deposited at 16 nm min−1. A continuous transition into a NiO layer followed with the addition of O2 at 23% of the O2/Ar feed, a power ramp up to 370 W, and process pressure increase to 10 mTorr (1.3 Pa). At a NiO thickness estimated to be 275 nm (grown at a 18 nm min−1 rate), O2 flow was reduced to achieve an O2/Ar ratio of 17% and process pressure of 9.2 mTorr (1.2 Pa) for the subsequent 665 nm of film growth, with a rate of 21.5 nm min−1. NiO film thickness was 940 nm.
X-ray diffraction (XRD) was performed in a PANalytical X'Pert Pro operating with Cu Kα radiation (λ = 1.5418 Å) using a 0.02° step size. Scanning electron microscopy (SEM) was performed in a JEOL 7500F operated at 1 kV and 20 μA in gentle beam mode. These experiments confirmed the purity of both powder and thin films (Fig. 2). While the XRD pattern of the films was dominated by the peaks due to the Ni substrate (Fig. 2a), small peaks that could be indexed with the rocksalt structure of NiO (JCPDS card 04-0835) were detected over the background (see arrows in Fig. 2a). SEM revealed that the films were composed of grains with triangular pyramid shape, which were 50 nm or less in the longest dimension (Fig. 2c). In contract, the commercial NiO powder was formed by large agglomerates composed of submicrometric crystallites.
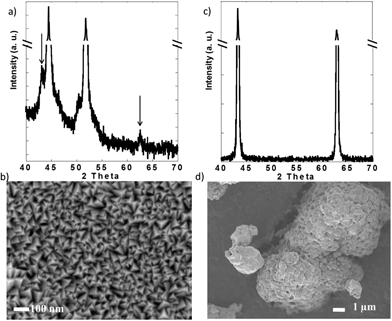 | ||
| Fig. 2 (a) X-ray diffraction pattern and (b) representative scanning electron micrograph of the NiO thin films and commercial NiO powder. | ||
Porous composite electrodes were prepared with 70 wt% NiO powder, 15 wt% polyvinyldifluoride (PVDF) as binder and 15 wt% carbon black conductive additive. The components were mixed in N-methylpyrrolidone (NMP) to form a dense slurry that was subsequently cast onto 15 μm Cu foil and dried in vacuum at 80 °C overnight. The active material loading was 3.4 mg cm−2. The NiO thin films were used as prepared. All samples were subject to Galvanostatic Cycling with Potential Limitation (GCPL) in two-electrode cells using Li metal foil as both counter and pseudo-reference electrode. The electrolyte used in the tests at room temperature consisted of 1 M LiPF6 solution in ethylene carbonate (EC) and dimethyl carbonate (DMC) mixture (1![[thin space (1/6-em)]](https://www.rsc.org/images/entities/char_2009.gif) :
:![[thin space (1/6-em)]](https://www.rsc.org/images/entities/char_2009.gif) 1 in weight, Merck), denoted LP30 from here on. Cycling at higher temperatures (75 °C, 100 °C and 150 °C) was carried out in a 1 M LiBOB solution in EC (Aldrich anhydrous 99.0%). The water content in the electrolytes was measured by Karl-Fischer titration, and found to be lower than 20 ppm. All experiments using composite electrodes were performed in 2032 coin cells with Celgard 2400 separators, whereas those carried out with thin film electrodes (including those carried out at high temperature) were done in Swagelok®-type cells with Whatman GF/D borosilicate glass fiber as separator. The current density was 55 and 40 μA cm−2 for powder and thin films, respectively. The former corresponds to an effective rate of C/20, i.e., the theoretical specific capacity (760 mA h g−1) being delivered in 20 h. Gravimetric capacities for thin film electrodes were estimated, based on the similar potential vs. capacity profiles observed compared to the composite film electrodes, by simply assuming the same total gravimetric capacity in both cases. This approach systematically led to a mass close to 0.4 mg of NiO on all thin film electrodes. In some cases, the cells were subject to relaxation periods of 500 h at selected points of the GCPL routine. Potentiostatic intermittent titration technique (PITT) measurements were also performed with potential steps of 5 or 10 mV, the potential being stepped to the next value when the current dropped below 2 μA cm−2 (corresponding to a rate of C/300 for NiO). Electrochemical tests were performed using either a MacPile or a VMP3 potentiostat (Bio-Logic); twin cells were assembled in selected cases in order to ensure reproducibility of results. Electrochemical impedance spectroscopy (EIS) measurements (10 mV perturbation amplitudes, with frequencies ranging from 500 kHz to 10 mHz) were performed in two electrode Swagelok cells upon cycling after various open circuit potential (OCP) periods (10 h, 48 h and 350 h).
1 in weight, Merck), denoted LP30 from here on. Cycling at higher temperatures (75 °C, 100 °C and 150 °C) was carried out in a 1 M LiBOB solution in EC (Aldrich anhydrous 99.0%). The water content in the electrolytes was measured by Karl-Fischer titration, and found to be lower than 20 ppm. All experiments using composite electrodes were performed in 2032 coin cells with Celgard 2400 separators, whereas those carried out with thin film electrodes (including those carried out at high temperature) were done in Swagelok®-type cells with Whatman GF/D borosilicate glass fiber as separator. The current density was 55 and 40 μA cm−2 for powder and thin films, respectively. The former corresponds to an effective rate of C/20, i.e., the theoretical specific capacity (760 mA h g−1) being delivered in 20 h. Gravimetric capacities for thin film electrodes were estimated, based on the similar potential vs. capacity profiles observed compared to the composite film electrodes, by simply assuming the same total gravimetric capacity in both cases. This approach systematically led to a mass close to 0.4 mg of NiO on all thin film electrodes. In some cases, the cells were subject to relaxation periods of 500 h at selected points of the GCPL routine. Potentiostatic intermittent titration technique (PITT) measurements were also performed with potential steps of 5 or 10 mV, the potential being stepped to the next value when the current dropped below 2 μA cm−2 (corresponding to a rate of C/300 for NiO). Electrochemical tests were performed using either a MacPile or a VMP3 potentiostat (Bio-Logic); twin cells were assembled in selected cases in order to ensure reproducibility of results. Electrochemical impedance spectroscopy (EIS) measurements (10 mV perturbation amplitudes, with frequencies ranging from 500 kHz to 10 mHz) were performed in two electrode Swagelok cells upon cycling after various open circuit potential (OCP) periods (10 h, 48 h and 350 h).
Results and discussion
Experiments with NiO powder composite electrodes
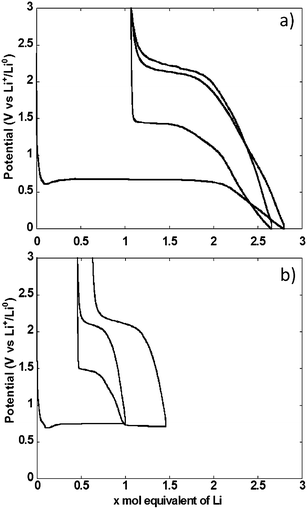
The potential vs. accumulated charge profile of NiO powder composite electrodes in cells using lithium metal counter electrodes exhibited, as expected, all the typical features of materials operating through conversion reaction mechanism (Fig. 3a). The footprint of the reduction process was a representative voltage plateau with an average potential of 0.67 V vs. Li+/Li0 and length roughly equivalent to the amount of electrons required to fully reduce NiO to Ni. The plateau was preceded by a dip in potential, typically associated with the barrier to nucleation of metallic nanoparticles, and followed by a sloping region down to 0 V vs. Li+/Li0. As a result, the total amount of Li equivalents introduced into the electrode was well above the theoretical value for reduction to the metallic state. Upon re-oxidation, the capacity during the sloping region was largely reversible. This region was followed by a single pseudo-plateau at approximately 2.1 V vs. Li+/Li0. A significant hysteresis is revealed by comparison of the profiles upon reduction and oxidation. It is also apparent that a significant portion of the charge invested in the reduction reaction was not recovered upon oxidation, which resulted in an extremely low coulombic efficiency of roughly 60%. The hysteresis decreased in the second reduction–oxidation cycle, mainly driven by the significant increase in potential, to 1.4 V vs. Li+/Li0 of the reduction plateau. This plateau was again followed by a process occurring at broad and sloping potential window, down to 0 V vs. Li+/Li0. The relative length of both reduction processes changed with the sloping region amounting to a significantly higher amount of accumulated charge. The profile during the second oxidation was essentially the same as in the first.Similar galvanostatic experiments were also conducted with the total amount of Li exchange in any given direction (reduction or oxidation) limited to 1 mole (see two cycles in Fig. 3b). During the first cycle, reduction was stopped in the middle of the conversion plateau. Reversing the polarization yielded a profile that preserved the same general features of the oxidation after a full conversion, namely an initial sloping increase in potential followed by a pseudo-plateau at 2.1 V vs. Li+/Li0. When the cell was discharged again to follow the second reduction, two plateaus were observed, at 1.4 and 0.68 V vs. Li+/Li0, linked by a sloping region. The existence of these plateaus is ascribed to the presence of domains in the electrode that were not converted in the first cycle coexisting with those that underwent a full cycle of reduction–oxidation. Thus, some irreversible transformation occurred during the first cycle, most probably associated with microstructural restructuring. A second oxidation under these conditions led to the same general profile as observed above.
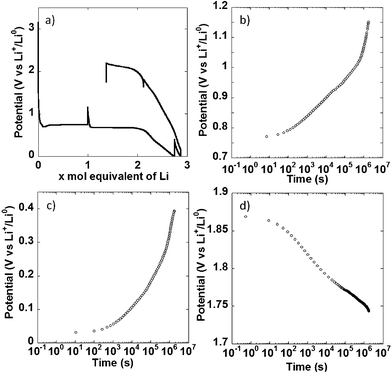
In a different set of experiments, the NiO powder composite electrode was allowed to relax for 500 h at multiple points during the first redox cycle, as indicated by the apparent potential spikes in Fig. 4a, and the potential evolution under open circuit was monitored. When the cell was relaxed halfway through the conversion plateau, a significant increase in potential, from 0.74 to 1.15 V vs. Li+/Li0 took place. No stabilization was observed at the end of the 500 h period (Fig. 4b, note the log scale in the time axis). The same behavior was observed during open circuit periods after a full reduction to 0 V vs. Li+/Li0 (Fig. 4c) and after charging the cell to 1.8 V vs. Li+/Li0 (Fig. 4d), where the potential continuously dropped to reach 1.63 V vs. Li+/Li0 after 500 h. Similar observations have been made by others.21 In cells where the overpotential during closed circuit is dominated by charge transfer kinetics and double layer charging, an open circuit period should result in an initially slow increase (or decrease, if upon oxidation) of potential with log![[thin space (1/6-em)]](https://www.rsc.org/images/entities/char_2009.gif) t, followed by a linear range dominated by Tafel kinetics, before complete stabilization at the equilibrium value.16,17 The situation in the present case is different. While a change in slope following a linear, Tafel-like domain was observed, it was positive, thus leading to an acceleration of the potential increase, as opposed to potential stabilization. This kind of positive change in slope has been observed in alternative electrode materials not operating through conversion reactions, such as Si;18 and was satisfactorily explained by introducing a side reaction into a standard model based on Tafel kinetics. The similarity between the potential vs. log
t, followed by a linear range dominated by Tafel kinetics, before complete stabilization at the equilibrium value.16,17 The situation in the present case is different. While a change in slope following a linear, Tafel-like domain was observed, it was positive, thus leading to an acceleration of the potential increase, as opposed to potential stabilization. This kind of positive change in slope has been observed in alternative electrode materials not operating through conversion reactions, such as Si;18 and was satisfactorily explained by introducing a side reaction into a standard model based on Tafel kinetics. The similarity between the potential vs. log![[thin space (1/6-em)]](https://www.rsc.org/images/entities/char_2009.gif) t curves obtained here and reported for Si points at the same explanation being valid here. This side reaction can obviously be attributed to electrolyte decomposition upon reduction taking place simultaneously to the conversion reaction, but being particularly predominant below 0.5 V vs. Li+/Li0. Under this scenario, the behavior upon oxidation could be considered surprising, as electrolyte decomposition would not necessarily be expected. However, other authors have reported that the products of such decomposition are themselves prone to oxidation.19,20 Therefore, the same explanation can be given for the acceleration of the potential decrease in Fig. 4d. All these observations call for extreme caution and careful inspection of the evolution of potential during relaxation time when using galvanostatic intermittent titration technique (GITT). Without such precautions misleading equilibrium potentials for conversion reactions can be estimated.21,22
t curves obtained here and reported for Si points at the same explanation being valid here. This side reaction can obviously be attributed to electrolyte decomposition upon reduction taking place simultaneously to the conversion reaction, but being particularly predominant below 0.5 V vs. Li+/Li0. Under this scenario, the behavior upon oxidation could be considered surprising, as electrolyte decomposition would not necessarily be expected. However, other authors have reported that the products of such decomposition are themselves prone to oxidation.19,20 Therefore, the same explanation can be given for the acceleration of the potential decrease in Fig. 4d. All these observations call for extreme caution and careful inspection of the evolution of potential during relaxation time when using galvanostatic intermittent titration technique (GITT). Without such precautions misleading equilibrium potentials for conversion reactions can be estimated.21,22
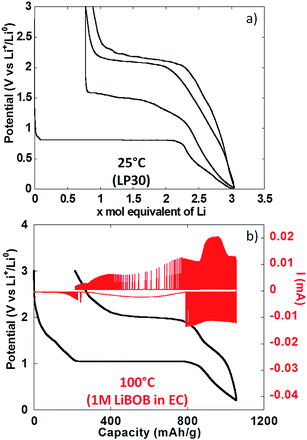
To conclude the study of NiO powder composite electrodes at room temperature, PITT experiments were carried out with the aim of evaluating the intrinsic electrochemical response under conditions close to equilibrium. From Fig. 5a it can be seen that the electrochemical signatures were close to those collected in galvanostatic conditions. The potential value halfway through the conversion plateau (first reduction) was 0.81 V vs. Li+/Li0. It is worthy of notice that this value is only 0.13 V higher than in the galvanostatic experiments above, which rules out the existence of significant polarization. It is also worth pointing out that reported in situ electronic conductivity measurements on the conversion plateau upon oxidation and upon reduction yield similar results23 (close to 1 S cm−1) and thus could not account for the observed behaviour. The thermodynamic potential of the NiO/Ni reaction, calculated from available thermochemical data,24 is 1.794 V vs. Li+/Li0, and thus there is a huge deviation with the observed values even under such quasi equilibrium conditions. Those results are in agreement with recent from Ko et al. on FeF2.25 After a full cycle, the coulombic efficiency, while higher than in the galvanostatic experiments above, was still very low, at ∼70%.
Experiments with NiO thin film electrodes
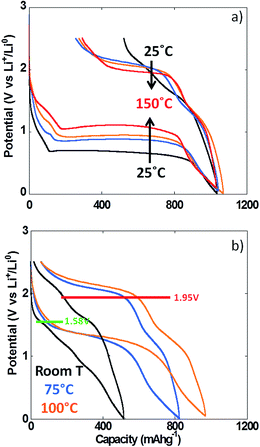
The use of thin film electrodes allowed us to bypass the complexity associated with the presence of support components such as carbon additives, which could, for instance, contribute to side reactions. Further, experiments were possible at high temperature without complications arising from exacerbated reactivity at carbon surfaces and binder degradation. Fig. 5b shows the potential vs. capacity plot for a PITT experiment carried out on a NiO thin film at ca. 100 °C. The main electrochemical signatures matched the data collected on powder electrodes at room temperature, except for new shoulders developing at ∼1.7 V vs. Li+/Li0 both upon reduction and oxidation. The potential value halfway through the conversion plateau (first reduction) was 1.04 V vs. Li+/Li0 (Fig. 5b). Thus, the deviation from the theoretical potential of reaction was still very high even at 100 °C under such quasi equilibrium conditions. The current decay deviated from pure Cottrelian behavior (i.e. mass diffusion controlled) because the conversion reaction involves the co-existence of three different phases in the electrode during the whole redox process. Signatures typical of nucleation, in the form of bell shape current profiles during a potential step, were observed during the first conversion plateau. It is worth mentioning that higher coulombic efficiency was calculated from the film electrode cycled at 100 °C (ca. 80%) than for composite electrode cycled at room T (ca. 70%). The low coulombic efficiency upon the first cycle for materials reacting through conversion reactions is oftentimes attributed to irreversible electrolyte decomposition, which should be enhanced both in the case of porous/composite electrode and at high temperature.Compared to month-long potentiodynamic measurements, galvanostatic experiments at different temperatures provided an effective and rapid means to create a robust dataset with additional insight into the kinetics of the electrochemical processes. The evolution of the potential vs. capacity traces with temperature is shown in Fig. 6a. The same signatures and capacities were observed in all cases, which compared well to the PITT data in Fig. 5b. The potential value halfway through the conversion plateau (first reduction) was raised from 0.68 to 1.11 V vs. Li+/Li0 when the temperature increased from 25 °C to 150 °C (see Table 1). The proximity of the potential values obtained in potentiodynamic and galvanostatic conditions at 100 °C provides additional evidence that the polarization must be small. In contrast, the potential at which the main oxidation process occurred barely changed; a well-defined plateau evolved with temperature, centered at 2.0 V vs. Li+/Li0 (Fig. 6a). As a result, the voltage hysteresis was still very significant at temperature as high as 150 °C. Fig. 6b displays the response collected during the second cycle for the same cells. The results are largely comparable to the data obtained for powder electrodes (Fig. 2), again with an additional shoulder at ∼1.6 V vs. Li+/Li0 observed during re-oxidation of the thin films. It can readily be noticed that the difference in temperature hardly had an impact on the onset potential for the reduction or oxidation processes, at ∼1.5 and 1.95 V vs. Li+/Li0, respectively. Therefore, changes in temperature only affected the potential values of the redox processes upon the first reduction, with no significant effects seen upon further cycling. These results demonstrate that temperature does not influence the hysteresis of the conversion reaction, but plays a role mainly during the first reduction, most probably by pushing over the barrier of nucleation of metallic nanoparticles12,26 or, alternatively, the work required to render the material “amorphous”.27
| Temperature (°C) | GCPL | PITT |
|---|---|---|
| 25 | 0.68 (0.67) | (0.81) |
| 75 | 0.88 | |
| 100 | 0.95 | 1.04 |
| 150 | 1.11 |
The coulombic efficiency increased from ca. 49 to 75% when the temperature was increased from 25 °C to 100 °C, yet the efficiency at 150 °C was similar to 100 °C (ca. 71%). As discussed above, this increase with temperature, where electrolyte side reactions would be exacerbated, indicates that the inefficiency is controlled by the sluggishness of the reaction to re-form NiO. The fact that the capacity recorded upon oxidation at ca. 2 V vs. Li+/Li0 significantly increased with temperature while the potential of the redox process remained unchanged constitutes further proof of severe thermodynamic constraints on the potential of the reconversion reaction.
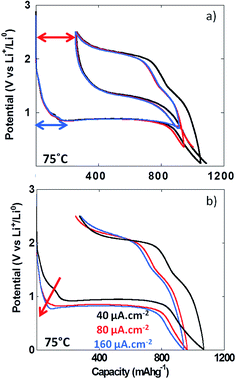
The formation upon reduction of a polymeric gel like film at the surface of materials reacting through conversion reaction at potentials below the conversion plateau has already been demonstrated by TEM analysis.5 With the aim of determining whether the formation of this gel like film could result in an additional overpotential contributing to the total voltage hysteresis recorded upon cycling, experiments with various lower cutoff voltages were performed (i.e. 0.01, 0.35 and 0.7 V vs. Li+/Li). The results in Fig. 7a clearly indicate that the voltage hysteresis was not dependent on the lower cutoff voltage and hence, the formation of the polymeric gel like film does not influence the value of the voltage hysteresis. Above room temperature, the irreversible capacity recorded for the first cycle appeared to have a fairly constant value (ca. 270 mA h g−1, Fig. 6a), and was not dependent on the lower cutoff voltage (see red arrow in Fig. 7a). This first cycle irreversible capacity value bore some apparent correlation with the value accumulated during the first reduction feature starting at ca. 1.7 V vs. Li+/Li (blue arrow in Fig. 7a). This observation was more obvious in the PITT data collected at 100 °C (Fig. 5b). Since no insertion of Li+ can occur in NiO, this first redox process is most probably related to electrolyte decomposition. In order to evaluate its impact on the first cycle coulombic efficiency, cycling at various cycling rates was performed. The increase of the cycling rate from 40 to 160 μA cm−2 resulted in a much stronger increase of the overpotential of this process compared to the conversion plateau (see Fig. 7b, red arrow) and, eventually, at 160 μA cm−2, it was completely suppressed. However, this suppression did not significantly affect the value of the first cycle irreversible capacity, which was found to be ca. 275 mA h g−1 at 160 μA cm−2 (Fig. 7b). These observations further support the conclusion that the first cycle irreversibility is inherent to the conversion reaction.
Impedance spectroscopy measurements were performed during the first reduction of thin film electrodes at both 25 °C (Fig. 8) and 100 °C (Fig. 9). Data were collected during open circuit at various potential values (see point 1, 2 and 3 in Fig. 7a and 8a insets), at three different time intervals: 10 h, 48 h and 350 h. Fig. 8a and 9a display the OCP curves measured at each point. At the beginning of the first reduction conversion plateau (point 1) the potential tended to values above 1.7 V vs. Li+/Li0, but did not stabilize even after 350 h at any of the two temperatures. These observations were consistent with the powder electrode data presented above. At the end and after the conversion plateau (points 2 and 3, respectively), the open circuit potential (OCP) was found to be even less stable, and much lower potential values were reached after 350 h OCP (ca. 1.2 V vs. Li+/Li0) regardless of the temperature. It is interesting to note that the potential value after 350 h OCP is very close to the average potential recorded halfway through the conversion plateau during the first reduction at 150 °C (1.11 V vs. Li+/Li0, see Fig. 6a). These results indicate that once the conversion reaction has started, hysteresis appears, as the OCP does never evolve towards the value deduced from thermodynamics.
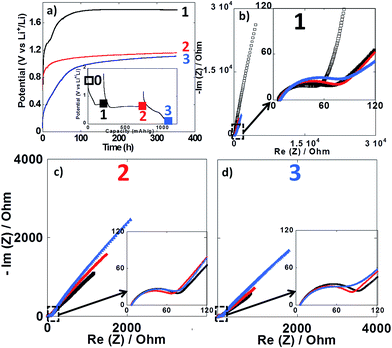 | ||
| Fig. 8 (a) Evolution of the open circuit potential against time recorded at point 1 (black curve), point 2 (red curve) or point 3 (blue curve) upon the first reduction (see inset). (b–d) Nyquist plots of impedance spectroscopy measurements recorded at point 1, 2 and 3, respectively. In all cases, impedance measurements were carried out after 10 h (black squares), 48 h (red circles) and 350 h (blue triangles). For sake of comparison the initial impedance spectroscopy measurements performed before cycling is also presented (black empty squares in Fig. 7b). Cycling was carried out at 25 °C. | ||
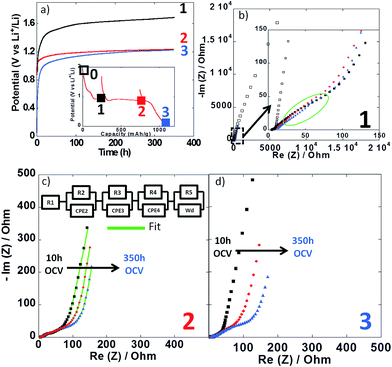 | ||
| Fig. 9 (a) Evolution of the open circuit potential against time recorded at point 1 (black curve), point 2 (red curve) or point 3 (blue curve) upon the first reduction (see inset). (b–d) Nyquist plots of impedance spectroscopy measurements recorded at point 1, 2 and 3, respectively. In all cases, impedance measurements were carried out after 10 h (black squares), 48 h (red circles) and 350 h (blue triangles). For sake of comparison the initial impedance spectroscopy measurements performed before cycling is also presented (black empty squares in Fig. 8b). Cycling was carried out at 100 °C. | ||
In all cases, the impedance spectra can be accurately fitted using a simplistic but meaningful equivalent circuit (see inset in Fig. 8c). This equivalent circuit is quite common for a negative electrode and is composed of several components in series, with a first resistance, R1, attributed to the electrolyte resistivity, several R/CPE components and, finally, a Warburg element accounting for the diffusion of ions to the electrode.28 In this equivalent circuit, R2/CPE2 is related to the charge transfer resistance and R3/CPE3 is often attributed to the impedance related to the formation of a SEI layer. In our two-electrode setup, the measure is the combination of this negative electrode impedance in series with the impedance of the Li electrode. Therefore, an additional R/CPE block in the circuit is necessary to accurately fit the impedance spectra. However, in our case an additional R/CPE component was found necessary to accurately fit the impedance spectra and could be associated with the formation of the polymeric gel like film which is known to be grown on top of the classical SEI layer for conversion type materials.5
For both cycling at 25 and 100 °C the impedance responses before the first reduction (black empty squares in Fig. 8b and 9b, respectively) were very similar; only one semi-circle could be observed before the Warburg tail, which was mainly associated to the R2/CPE2 component (charge transfer resistance). As expected, a much larger R2 value was recorded at 25 °C (ca. 55 Ohm) than at 100 °C (ca. 5 Ohm), and no significant contribution from R3 and R4 could be seen. As soon as the reduction is started (point 1) the contribution of R3 and R4 became visible in the data recorded at 100 °C, with several semi-circles observed (see Fig. 8b–d). The case of cycling performed at 25 °C was different. Only one semi-circle was visible, its impedance slightly increasing from the initial OCP to point 1 (from ca. 55 to 75 Ohm). Thus, it is most likely that the contribution from the charge transfer resistance (R2) was the main component at 25 °C, and the components related to the formation of surface layers were negligible. By contrast, the contributions of R3 and R4 at 100 °C became dominant due to the very low charge transfer resistance at such high temperature. For the rest of the first cycle (point 2 and 3) the impedance spectra did not evolve significantly and fairly stable R1, R2, R3, R4 and R5 values were recorded. The sum of R1 to R5 was less than 300 Ω, which implies an ohmic drop lower than ±10 mV at 40 μA cm−2. It is also worth noting that a small increase of R4 during open circuit was observed for cycling at 100 °C (see Fig. 9b–d), most probably related to the continuous evolution of the polymeric gel like film with time. This evolution of R4/CPE4 was strongly dependent on the history of the electrode. The shift to higher impedance values during open circuit was more significant when going from point 1 to point 3 (see Fig. 9b–d). Overall, it is straightforward to conclude that, in all cases, no significant increase of the impedance components could justify the important voltage hysteresis recorded for NiO conversion reaction.
Conclusions
The fundamentals of electrochemical conversions relevant to energy storage applications were evaluated using a suite of electroanalytical tools, with NiO as a case study in both powder and thin film form. It was determined that measurements during open circuit potential, typical of protocols such as the galvanostatic intermittent titration technique, are compromised by the existence of side reactions concurrent to the conversion, which can be detected by following the OCP vs. time. Measurements in potentiodynamic mode are required to assess the reactions close to equilibrium, while impedance spectra can be used to assess the magnitude of ohmic and diffusion resistance contributions to the observed potential hysteresis.Despite the pervasive existence of concomitant side reactions, the results presented here indicate that coulombic efficiencies are controlled mainly by the reversibility of the main conversion/re-conversion process. Data collected at temperatures up to 150 °C revealed a small reduction in potential hysteresis, driven by the increase in potential of the initial reduction process. The absence of significant changes for processes beyond this first reduction was taken as indication that temperature only activates the process of nucleation of metallic particles. In other words, even for NiO, which constitutes the simplest example of conversion reaction material with a single redox process involved, the hysteresis was found to have a strong thermodynamic character. This work strongly suggests that it is driven by the different chemical pathways upon reduction and oxidation. This conclusion has important implications, as strategies based on the reduction of diffusion lengths or the improvement of charge transfer kinetics, widely reported in the literature for materials operating through a conversion reaction mechanism, are unlikely to produce any gains in this parameter, which is the main bottleneck for practical application. All in all, this work points at the main significant challenge for the practical implementation of conversion-based electrodes. The loss of energy efficiency through potential hysteresis is found to be intrinsic to this kind of reactivity, and, thus, remediation strategies based on electrode engineering will likely be unsuccessful. This conclusion indicates that the viability for commercialization is severely compromised, and leads to the expectation that such reactions will most likely remain a laboratory curiosity. Nonetheless, they constitute a fascinating test bed for theories seeking an advanced explanation to the physical electrochemistry of solids.
Acknowledgements
The work at Lawrence Berkeley National Laboratory was supported by the Assistant Secretary for Energy Efficiency and Renewable Energy, Office of Vehicle Technologies of the U.S. Department of Energy (DOE) under Contract no. DE-AC02-05CH11231, as part of the Batteries for Advanced Transportation Technologies (BATT) Program. Data analysis was carried out by JC at the University of Illinois at Chicago with support from internal start-up funds provided by the College of Liberal Arts and Sciences. ICMAB-CSIC researchers acknowledge funding through Ministerio de Ciencia e Innovación (Spain) MAT2011-24757.Notes and references
- N. A. Godshall, I. D. Raistrick and R. A. Huggins, Mat. Res. Bull., 1980, 15, 561 CrossRef CAS.
- P. Poizot, S. Laruelle, S. Grugeon, L. Dupont and J. Tarascon, Nature, 2000, 407, 493 CrossRef PubMed.
- J. Cabana, L. Monconduit, D. Larcher and M. R. Palacín, Adv. Mater., 2010, 22, E170 CrossRef CAS PubMed.
- M. V. Reddy, G. V. S. Rao and B. V. R. Chowdari, Chem. Rev., 2013, 113, 5364 CrossRef CAS PubMed.
- S. Laruelle, S. Grugeon, P. Poizot, M. Dolle, L. Dupont and J. M. Tarascon, J. Electrochem. Soc., 2002, 149, A627 CrossRef CAS PubMed.
- G. Gachot, S. Grugeon, M. Armand, S. Pilard, P. Guenot, J. M. Tarascon and S. Laruelle, J. Power Sources, 2008, 178, 409 CrossRef CAS PubMed.
- Y.-Y. Hu, Z. Liu, K.-W. Nam, O. J. Borkiewicz, J. Cheng, X. Hua, M. T. Dunstan, X. Yu, K. M. Wiaderek, L.-S. Du, K. W. Chapman, P. J. Chupas, X.-Q. Yang and C. P. Grey, Nat. Mater., 2013, 12, 1130 CrossRef CAS PubMed.
- P. Balaya, H. Li, L. Kienle and J. Maier, Adv. Funct. Mater., 2003, 13, 621 CrossRef CAS PubMed.
- Y. F. Zhukovskii, E. A. Kotomin, P. Balaya and J. Maier, Solid State Sci., 2008, 10, 491 CrossRef CAS PubMed.
- A. Ponrouch, P. L. Taberna, P. Simon and M. R. Palacin, Electrochim. Acta, 2012, 61, 13 CrossRef CAS PubMed.
- A. Ponrouch, A. R. Goñi, M. T. Sougrati, M. Ati, J. M. Tarascon, J. N.- Avendaño and M. R. Palacin, Energy Environ. Sci., 2013, 6, 3363 CAS.
- P. L. Taberna, S. Mitra, P. Poizot, P. Simon and J. Tarascon, Nat. Mater., 2006, 5, 567 CrossRef CAS PubMed.
- R. E. Doe, K. A. Persson, Y. S. Meng and G. Ceder, Chem. Mater., 2008, 20, 5274 CrossRef CAS.
- A. L. Dalverny, J. S. Filhol and M. L. Doublet, J. Mater. Chem., 2011, 21, 10134 RSC.
- R. Khatib, A. L. Dalverny, M. Saubanere, M. Gaberscek and M. L. Doublet, J. Phys. Chem. C, 2013, 117, 837 CAS.
- V. Srinivasan, G. Q. Wang and C. Y. Wang, J. Electrochem. Soc., 2003, 150, A316 CrossRef CAS PubMed.
- S. Davis, E. S. Takeuchi, W. Tiedemann and J. Newman, J. Electrochem. Soc., 2007, 154, A477 CrossRef CAS PubMed.
- V. A. Sethuraman, V. Srinivasan and J. Newman, J. Electrochem. Soc., 2013, 160, A394 CrossRef CAS PubMed.
- A. J. Gmitter, A. Halajko, P. J. Sideris, S. G. Greenbaum and G. G. Amatucci, Electrochim. Acta, 2013, 88, 735 CrossRef CAS PubMed.
- M. A. Lowe, J. Gao and H. D. Abruña, J. Mater. Chem. A, 2013, 1, 2094 CAS.
- Y. J. Mai, D. Zhang, Y. Q. Qiao, C. D. Gu, X. L. Wang and J. P. Tu, J. Power Sources, 2012, 216, 201 CrossRef CAS PubMed.
- P. Liu, J. J. Vajo, J. S. Wang, W. Li and J. Liu, J. Phys. Chem. A, 2012, 116, 6467 CrossRef CAS.
- F. Sauvage, J. M. Tarascon and E. Baudrin, J. Phys. Chem. C, 2007, 111, 9624 CAS.
- P. Poizot, S. Laruelle, S. Grugeon and J.-M. Tarascon, J. Electrochem. Soc., 2002, 149, A1212 CrossRef CAS PubMed.
- J. K. Ko, K. M. Wiaderek, N. Pereira, T. L. Kinnibrugh, J. R. Kim, P. J. Chupas, K. W. Chapman and G. G. Amatucci, ACS Appl. Mater. Interfaces, 2014, 6, 10858 CAS.
- F. Wang, H.-C. Yu, M.-H. Chen, L. Wu, N. Pereira, K. Thornton, A. Van der Ven, Y. Zhu, G. G. Amatucci and J. Graetz, Nat. Comm., 2012, 3, 1201 CrossRef PubMed.
- O. Delmer, P. Balaya, L. Kienle and J. Maier, Adv. Funct. Mater., 2008, 20, 501 CAS.
- E. Peled, D. Golodnitsky and G. Ardel, J. Electrochem. Soc., 1997, 144, L208 CrossRef CAS PubMed.
| This journal is © The Royal Society of Chemistry 2014 |

