
Relevance of the acidic 1-butyl-3-methylimidazolium hydrogen sulphate ionic liquid in the selective catalysis of the biomass hemicellulose fraction†
Ana V. Carvalhoab,
André M. da Costa Lopesab and
Rafał Bogel-Łukasik*a
aLaboratório Nacional de Energia e Geologia, Unidade de Bioenergia, 1649-038 Lisboa, Portugal. E-mail: rafal.lukasik@lneg.pt; Fax: +351 217163636; Tel: +351 210924600 ext. 4224
bLAQV/REQUIMTE, Departamento de Química, Faculdade de Ciências e Tecnologia, Universidade Nova de Lisboa, 2829-516 Caparica, Portugal
First published on 12th May 2015
Abstract
The ability of acidic 1-butyl-3-methylimidazolium hydrogen sulphate ionic liquid (IL) to hydrolyse and convert wheat straw into pivot compounds without additional catalyst was scrutinised. The pre-treatment with this IL allowed to obtain a liquor rich in hemicellulosic sugars, furans and organic acids, and a solid fraction constituted mainly of cellulose and lignin was obtained. Pre-treatment conditions such as temperature and residence time were set to produce xylose or furfural at a fixed 1/10 (w/w) biomass/IL ratio and 1.24% (w/w) water content in the pre-treatment process. Statistical modelling based on Doehlert experimental design was applied to establish optimal conditions to produce xylose and furfural. Temperature demonstrated a greater effect on the production of xylose, rather than the time of pre-treatment, and it was significantly incisive on furfural formation as well. To compare the reaction conditions, the severity factor for the studied IL was proposed and applied in this work. Furthermore, water was verified to have a large influence on the equilibrium of the hemicellulose hydrolysis. The increase of the water content close to 10% (w/w) in the system disfavoured xylose dehydration and thus allows increasing significantly the production of hemicellulose-derived monosaccharides. At last, an important disclosure in the reaction of biomass with [bmim][HSO4] is the formation of humins for high severity pre-treatment.
Introduction
The increasing demand for energy, fuels and chemicals forces the search for alternative sources of these commodities. Accordingly, finding new technologies and developing novel processes to bring this growth in line with the social demand for sustainability are major challenges for current and future generations. A biorefinery might be one of the ways to achieve this goal. A biorefinery aims to use biomass, which is a readily available and low-cost feedstock and is one among a few resources that can facilitate the large-scale and sustainable production of the substantial volumes of energy and materials.1 Normally, biomass refers to lignocellulosic feedstock that is constituted by three major biopolymers: cellulose, hemicellulose and lignin, which have specific and diverse properties. The strong intra- and intermolecular interaction established between these biomacromolecular components make lignocellulosic biomass a recalcitrant material, and thus a pre-treatment process is required.The major purpose of biomass pre-treatment is to process lignocellulosic feedstocks to make it more subjectable for further processing.2,3 The pre-treatment exposes biomass fractions to biological and/or chemical treatments aimed at further valorisation towards particular products or pivot chemicals.4 However, to achieve this goal various challenges must be addressed. Furthermore, depending on the expected results, the most adequate pre-treatment method can be selected. In addition, the choice of pre-treatment should consider the overall compatibility of feedstocks, enzymes and organisms to be applied, overall economic assessment and environmental impact.5 To date, several methodologies have been used to develop low cost pre-treatments to generate cellulose- and hemicellulose-originated sugar-rich liquors.5 One of the approaches is the use of more sustainable solvents such as ionic liquids6–19 and supercritical fluids.20–24
Ionic liquids (IL) are known as organic salts with melting points below 100 °C composed solely of cations and anions. The possible choices of cations and anions allows for the production of numerous ILs with various physicochemical properties.25,26 One of the dominant applications of ILs are separation and extraction processes.27–34 The dissolution of lignocellulosic biomass with ILs has been referred to as an innovative process where the physicochemical properties of the original biomass are altered in a way not observed before by other solvents.35–38 Interactions between lignocellulosic biomass and ILs are intricate due to the presence of lignin and extractives, as well as because of the recalcitrance inherent to these materials.10,39 The efficiency of lignocellulosic biomass pre-treatment in ILs is associated with the hydrogen bond basicity, which is generally governed by the IL anion behaviour. Generally, anions with strong hydrogen bond basicity can effectively weaken the hydrogen bond network of the biomass polymers.17 Thus, the pre-treatment of biomass with ILs offers advantages over conventional methods allowing the alteration of physicochemical properties of the biomass macromolecular components, such as reduction of the cellulose crystallinity, extraction of specific macromolecules such as lignin and hemicellulose and execution of different fractionation approaches after biomass dissolution in ILs.10
However, rather than to dissolve and to pre-treat biomass, some ILs were found to be able to directly catalyse biomass conversion, mainly by hydrolysing and processing of the polysaccharides without the presence of any other catalyst. Acidic ILs can behave as both solvents and catalysts because they combine the advantages of mineral acid and IL.40 Therefore, many types of acidic ionic liquids have been gaining interest as integrated solvents and catalysts for the biomass pre-treatment.40–43 Acidic ILs functionalised with SO3H greatly increase the reaction rate of the cellulose hydrolysis and have a higher catalytic activity for the cleavage of glycosidic bonds.44 Nevertheless, no selectivity between cellulose and hemicellulose hydrolysis is observed and the strong acidic character of these ILs leads to an increase of biomass degradation. In the case of [HSO4]-based ILs, another example of acidic ILs able to catalyse biomass, a selective hemicellulose hydrolysis could be achieved.18,45 Furthermore, [HSO4]-based ILs have been procured increasingly not only because of their acidic properties, but also due to their low cost when compared to other ILs.46 The 1-butyl-3-methylimidazolium hydrogen sulphate ([bmim][HSO4]) IL has been found as an alternative to the more exploited ILs such as 1-butyl-3-methylimidazolium chloride ([bmim][Cl]) and 1-ethyl-3-methylimidazolium acetate [emim][CH3COO], among others.
Materials and methods
Materials and chemicals
Wheat straw was kindly supplied by Estação Nacional de Melhoramento de Plantas (Elvas, Portugal) and was used as the feedstock. The milling of raw material was done using a knife mill IKA® WERKE, MF 10 basic, Germany, to get <0.5 mm particles.The moisture content in the biomass and processed solids was determined at the level of 8.3% (w/w). To perform the water content analysis a nickel plate was placed in an oven at 100 °C for at least 5 h to remove humidity. The known amount of pre-treated sample (0.1 g) was placed in each plate, heated up in an oven for at least 18 h and then dried and weighed.
The chemical analysis of the raw material (dry weight basis) was taken from literature21 and was as follows: 38.8% ± 0.1% glucan, 19.5% ± 0.4% xylan, 2.9% ± 0.01% arabinan, 2.7% ± 0.03% acetyl groups, 17.6% ± 0.1% Klason lignin, 9.7% ± 0.03% protein and 4.5% ± 0.1% ash.
For the pre-treatment experiments, the [bmim][HSO4] IL (99% purity) acquired from Iolitec GmbH, Heilbronn, Germany, was used. The [bmim][HSO4] IL was used as received without further purification. The water content in the examined IL was measured by a volumetric Karl–Fischer titration and was 5385 ppm. For the pre-treatment experiments, 4 M HCl aqueous solution was prepared from fuming 37% (w/w) HCl bought from Merck (Darmstadt, Germany) and ultra-pure water (18.2 MΩ cm−1) produced by Purelab Classic Elga. Nylon filters (Ø = 47 mm, 0.45 μm porosity) from Merck Millipore (Billerica, MA, USA) were also used. The 4 M HCl was later used to prepare the HCl aqueous solution at pH = 2 by diluting the acid with water. Basylone M-350 oil purchased from Bayer (Leverkursen, Germany) was used as the heating medium for pre-treatment experiments. Nylon syringe filters (Ø = 13 mm, 0.22 μm porosity), purchased from Red® analytical (Cambridgeshire, UK), were used to filter all samples before running on the CE (Capillary Electrophoresis) and HPLC instruments. For the solid analysis, H2SO4 96% (w/w) by Panreac Química, (Barcelona, Spain), Nylon syringe filters (Ø = 13 mm, 0.22 μm porosity) and filtering crucibles equipped with a fritted disc, Gooch with porosity grade 4 from SciLabware (Stone, Staffordshire) were used.
Pre-treatment method
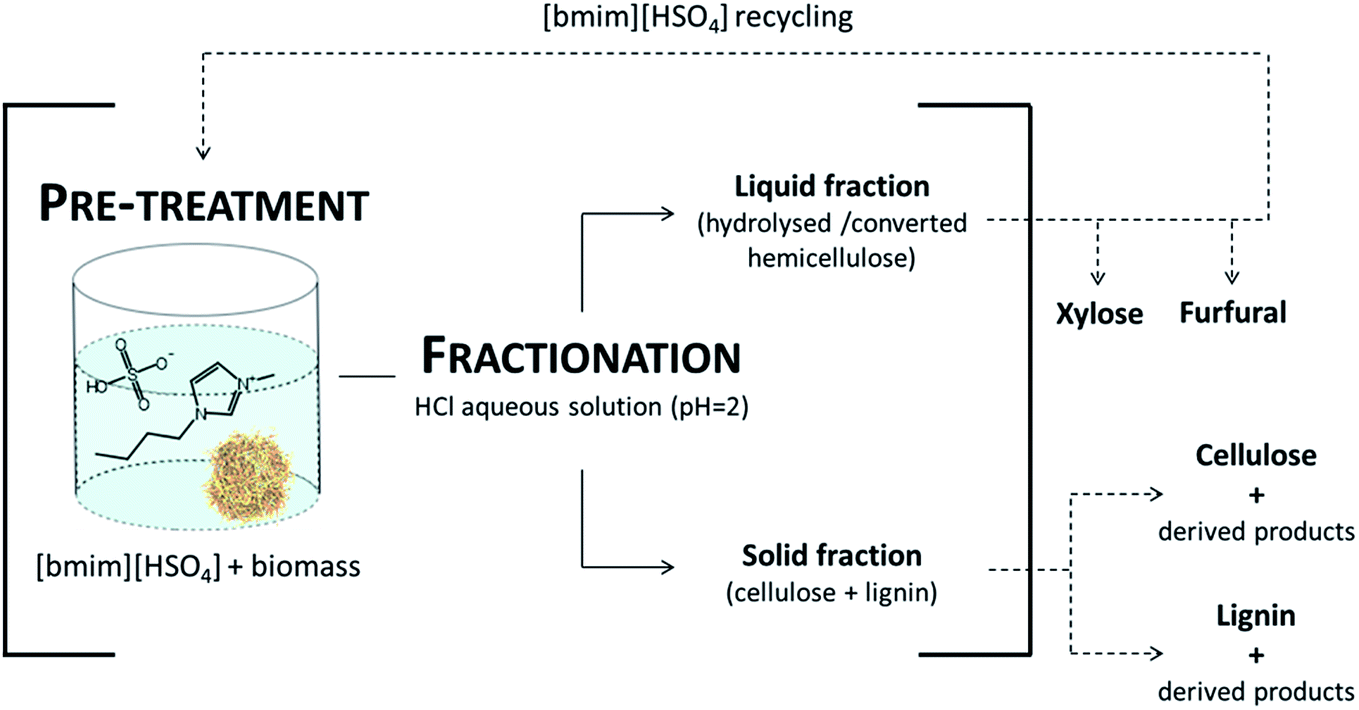
4 g of [bmim][HSO4] was placed into a 15 mL vial and mixed with wheat straw in a 1![[thin space (1/6-em)]](https://www.rsc.org/images/entities/char_2009.gif) :10 (w/w) biomass/IL ratio. The mixture was submitted to continuous magnetic stirring for a defined period of time and temperature. After pre-treatment, 10 mL of ultra-pure water was added to the flask under continuous agitation. The mixture was next filtered under vacuum and 90 mL of HCl aqueous solution (pH = 2) was used to wash the recovered biomass. The use of an acidic HCl solution with pH = 2 allowed us to maintain the lignin in the solid phase as the processed lignin was insoluble in acidic solution at pH = 2.16 Furthermore, at the same time the aqueous solution of HCl allowed for the hydrolysed sugars produced from hemicellulose fraction to be washed out. In other words the HCl aqueous solution (pH = 2.0) was used to achieve high selectivity for hemicellulose-derived products recovery in the liquid stream. The obtained liquor was collected and stored in a freezer. The solid phase was dried in an oven at 50 °C for 24 h. Subsequently, the recovered biomass was left for a minimum of 1 h at room temperature, and then the recovered mass was measured. The liquor obtained from each pre-treatment trial was subjected to CE and HPLC analyses while the recovered biomasses (solid phase) were submitted to chemical characterisation.
:10 (w/w) biomass/IL ratio. The mixture was submitted to continuous magnetic stirring for a defined period of time and temperature. After pre-treatment, 10 mL of ultra-pure water was added to the flask under continuous agitation. The mixture was next filtered under vacuum and 90 mL of HCl aqueous solution (pH = 2) was used to wash the recovered biomass. The use of an acidic HCl solution with pH = 2 allowed us to maintain the lignin in the solid phase as the processed lignin was insoluble in acidic solution at pH = 2.16 Furthermore, at the same time the aqueous solution of HCl allowed for the hydrolysed sugars produced from hemicellulose fraction to be washed out. In other words the HCl aqueous solution (pH = 2.0) was used to achieve high selectivity for hemicellulose-derived products recovery in the liquid stream. The obtained liquor was collected and stored in a freezer. The solid phase was dried in an oven at 50 °C for 24 h. Subsequently, the recovered biomass was left for a minimum of 1 h at room temperature, and then the recovered mass was measured. The liquor obtained from each pre-treatment trial was subjected to CE and HPLC analyses while the recovered biomasses (solid phase) were submitted to chemical characterisation.
Chemical characterisation of the recovered solids
The solid phase resulting from the pre-treatment was washed with ultra-pure water and oven-dried at 50 °C for at least 48 h. Subsequently, the solids were left at room conditions for a minimum of 12 h. After that, the solids were subjected to a quantitative acid hydrolysis to determine the sugar content (both cellulose and hemicellulose) according to the protocol of the National Renewable Energy Laboratory (NREL).47Analytical techniques
The processes examined in this work resulted in the liquid phase containing mainly hemicellulose hydrolysis products and processed solids constituted of cellulose and lignin. After each pre-treatment both liquid and solid fractions were duly processed using CE and HPLC. The analysis was focused on the detection and quantification of compounds that are directly obtained from the hydrolysis and/or conversion of wheat straw. Therefore, CE was employed to analyse monosaccharides (xylose, arabinose and glucose) and furans (furfural and HMF), while HPLC identified the organic acids found in the sample. The reason to use CE is the capacity of this technique to detect and separate analytes in the sample with a higher tolerance for IL concentration than HPLC.48 Unfortunately, CE could not be used for the organic acid analysis, due to the direct interference of the IL with the separation of organic acids.For the preparation of standard sugar samples, D(+)-sucrose, D(+)-xylose, D(+)-cellobiose, D(+)-glucose and D(+)-arabinose were used and were acquired from Merck (Darmstadt, Germany). Furfural and HMF obtained from Sigma-Aldrich (St. Louis, USA) were also used as standards. The standard solutions were prepared using ultra-pure water and contained HMF (0.5–0.03 mM), furfural (3–0.05 mM) and sugars: sucrose, cellobiose, cellulose, arabinose and xylose (4–0.2 mM). The example of electropherogram is shown in Fig. 1 of the ESI.†
Statistical modelling
A methodology based on Doehlert experimental design50 was performed for two different optimisation responses, namely, xylose and furfural production from wheat straw hemicellulose. The experimental distribution was considered for two independent variables: temperature (X1) and residence time (X2). Two different experimental distributions were made. The first for xylose production, where 70 °C < X1 < 160 °C and 20.0 min < X2 < 120.0 min were considered while the second for furfural production by using 115 °C < X1 < 175 °C and 63.3 min < X2 < 163.3 min. The conditions of pre-treatment and respective coded factors, which were used for calculation purposes of two inspected optimisations, are presented in Table 1 of the ESI.†The responses studied were xylan hydrolysis to xylose (Y1) and hemicellulose sugars (sum of xylan and arabinan) conversion to furfural (Y2). The model used to express the responses was a second order polynomial represented by the following equation: Y = β0 + β1X1 + β2X2 + β12X1X2 + β11X12 + β12X22, where X1 and X2 represent the independent variables, Y is the response obtained from experiments and βs are parameters of the polynomial model. The β parameters utilised to estimate the responses have precise meanings: β0 represents the analysed response in the centre of the experimental domain; the magnitude of β1 and β2 indicates the importance of the respective factors (temperature and time, respectively) on the responses; the interaction parameter, β12, indicates how the effect of one factor depends on the level of the other factor. The values of β11 and β12 determine how the response surface folds downward (negative values) or upward (positive values) quadratically, depending on the magnitude of the absolute value. The relationship between the dependent variables and the response variables was demonstrated by the response surfaces and contour plots obtained using SigmaPlot® (Systat Software Inc.). The adequacy of the models to fit the sets of data was performed using the statistical F-test for the effectiveness of the factors, which detects whether the source of variance included in the residuals is due to the inadequacy of the models to reproduce experimental data. The adequacy of the model was predicted through the regression analysis (R2) and the ANOVA analysis (p < 0.05), using Microsoft Office Excel 2010 software.
Experimental errors
Standard deviation error (u) was determined for all the obtained results. All weighing was made considering a u(m) = 0.1 mg. For all wheat straw pre-treatments, the applied temperature demonstrated an error of u(T) = 1 °C. An arbitrary error of 10% of measured value was defined to all the CE measurements and HPLC analyses. All experiments were performed in duplicate.Results
Wheat straw was subjected to processing with acidic [bmim][HSO4] IL in a temperature range from 70 to 175 °C and residence times from 20.0 to 163.3 min at a fixed biomass/IL ratio (10% (w/w)) and water content equal to 1.24% (w/w). Pre-treatments with [bmim][HSO4] were made focusing on the hydrolysis of the hemicellulose fraction from wheat straw to produce xylose as the main product. Based on a literature report16 the experimental conditions were settled using Doehlert experimental design (Table 1 of ESI†).Production of xylose
The conditions of xylose production initially studied were: 85 °C/113.3 min, 100 °C/70.0 min, 115 °C/26.7 min, 115 °C/113.3 min and 130 °C/70.0 min. For the highest pre-treatment temperature (130 °C/70.0 min), among all examined conditions, the highest hydrolysis of xylan to xylose was found. Therefore, following the pattern of Doehlert experimental design, pre-treatments with higher temperatures were studied, namely, at 145 °C/26.7 min and 145 °C/113.3 min. The results obtained for all performed experiments are given in Table 1. The data shows that xylose yield in the liquor increased with temperature and residence time up to 130 °C/70.0 min up to 18.8% (w/w) while for the higher temperature (145 °C) the xylose yield decreased to less than 1/4 of the maximum value. This decrease is counterbalanced by an increase of furfural yield to 26% (w/w). In the case of arabinose, a constant decrease of arabinose yield was found with an increase of reaction time and temperature. Analysing the glucose yield it can be stated that the concentration of glucose remains constant in the range of experimental error for all experiments. A similar conclusion can be drawn for glucose degradation product such as HMF, whose concentration remains constant in the range of studied parameters. Similar to furfural, the yield of acetyl group hydrolysis to acetic acid increased, leading to 83.3% (w/w) of the initial acetyl groups content. Two most common organic acids, formic and levulinic, were not found in the examined samples.| T (°C) | t (min) | Yield (% w/w) of | |||||||
|---|---|---|---|---|---|---|---|---|---|
| Xylosea | Arabinoseb | Furfuralc | Glucosed | HMFe | Acetic acidf | Formic acidg | Levulinic acidh | ||
a 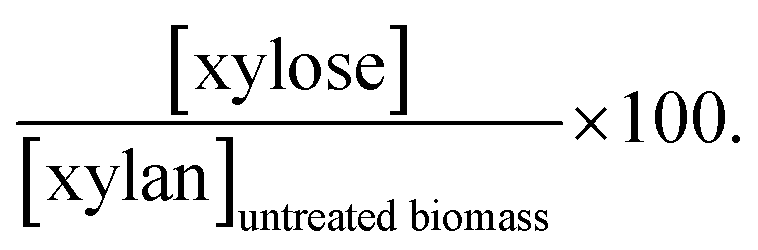 b b 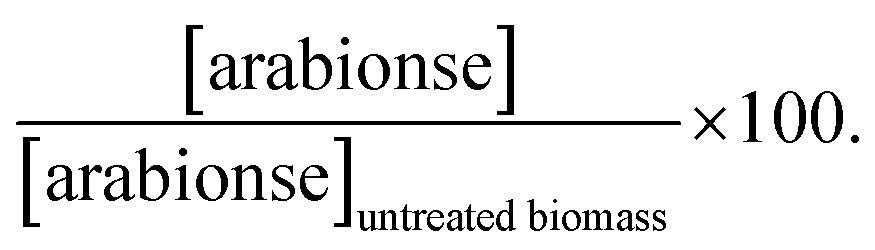 c c 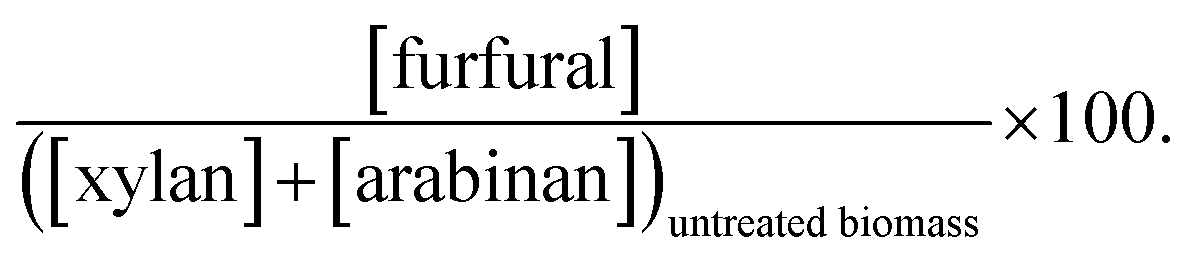 d d 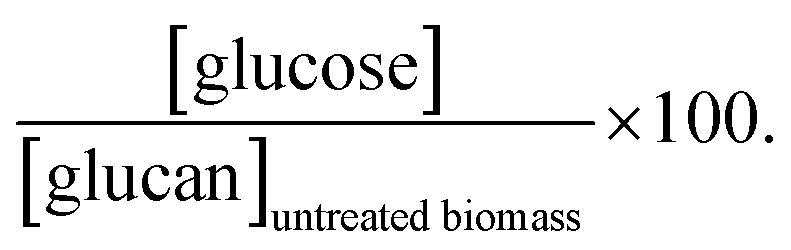 e e  f f  g g  h h  |
|||||||||
| 85 | 113.3 | 0.0 | 20.3 | 0.1 | 1.0 | 0.6 | 9.5 | 0.0 | 0.0 |
| 100 | 70.0 | 2.1 | 20.0 | 0.2 | 0.8 | 0.8 | 12.4 | 0.0 | 0.0 |
| 115 | 26.7 | 4.6 | 15.2 | 0.3 | 0.9 | 0.8 | 17.8 | 0.0 | 0.0 |
| 115 | 113.3 | 15.3 | 11.3 | 3.1 | 1.0 | 0.9 | 38.3 | 0.0 | 0.0 |
| 130 | 70.0 | 18.8 | 10.3 | 14.3 | 0.8 | 0.7 | 57.9 | 0.0 | 0.0 |
| 145 | 26.7 | 12.5 | 4.5 | 10.9 | 0.7 | 0.8 | 56.6 | 0.0 | 0.0 |
| 145 | 113.3 | 4.4 | 4.1 | 26.1 | 1.1 | 1.0 | 83.3 | 0.0 | 0.0 |
| 130 | 156.6 | 16.0 | 7.8 | 23.4 | 1.1 | 1.1 | 69.5 | 0.0 | 0.0 |
| 160 | 70.0 | 1.3 | 0.0 | 30.7 | 1.0 | 1.6 | 89.7 | 0.0 | 0.0 |
| 160 | 156.6 | 0.0 | 0.0 | 36.2 | 0.9 | 2.6 | 106.4 | 0.8 | 1.7 |
| 175 | 63.3 | 0.6 | 0.0 | 30.6 | 0.9 | 1.8 | 95.9 | 1.0 | 1.5 |
| 175 | 113.3 | 0.0 | 0.0 | 34.4 | 0.9 | 3.0 | 95.1 | 0.3 | 2.0 |
| 175 | 163.3 | 0.0 | 0.0 | 15.6 | 0.0 | 1.6 | 108.8 | 2.1 | 2.1 |
The results of solid produced during the wheat straw processing with [bmim][HSO4] are summarised in Table 2. The solid yield varied from 89.4% to 58.8% for 85 °C/113.3 min and 145 °C/113.3 min, respectively. The characterisation of the obtained solids was necessary to determine the amount of each fraction that was not hydrolysed by [bmim][HSO4]. The obtained data shows that xylan is still present in the recovered solids and its content decreased from 24.3% (w/w) of produced solid to 5.6% (w/w) for the lowest and the most severe conditions, respectively. Similar behaviour was observed for arabinan and acetyl groups found in the processed solids. The decrease of xylan, arabinan and acetyl group content in the produced solids is counterbalanced by a significant increase of glucan and lignin content. For the highest temperature examined, the glucan content was above 50% (w/w) and lignin reached a maximum of 32.6% (w/w) of the produced solid sample.
| T (°C) | t (min) | Solid phase composition (% w/w) | SY% | |||||
|---|---|---|---|---|---|---|---|---|
| Xylan | Arabinan | Acetyl groups | Glucan | Lignin | Ash | |||
| Untreated biomass | 19.1 | 3.0 | 2.7 | 38.5 | 17.7 | 10.7 | ||
| a The oven-dried solid phase composition; SY = solid yield. | ||||||||
| 85 | 113.3 | 24.3 | 2.6 | 2.4 | 40.7 | 18.6 | 2.8 | 89.4 |
| 100 | 70.0 | 23.3 | 2.1 | 2.1 | 43.1 | 20.8 | 3.5 | 82.8 |
| 115 | 26.7 | 21.4 | 2.0 | 2.3 | 44.9 | 20.0 | 3.6 | 78.2 |
| 115 | 113.3 | 14.5 | 0.9 | 2.3 | 50.3 | 18.7 | 4.3 | 66.1 |
| 130 | 70.0 | 10.5 | 1.1 | 1.1 | 58.2 | 20.6 | 5.8 | 58.8 |
| 145 | 26.7 | 9.6 | 0.8 | 1.0 | 54.6 | 22.1 | 5.5 | 58.7 |
| 145 | 113.3 | 5.6 | 1.4 | 1.0 | 50.9 | 32.6 | 5.4 | 58.1 |
| 130 | 156.6 | 6.8 | 0.0 | 0.0 | 56.7 | 26.0 | 6.2 | 59.7 |
| 160 | 70.0 | 0.0 | 0.0 | 0.0 | 52.4 | 36.7 | 6.2 | 61.5 |
| 160 | 156.6 | 0.0 | 0.0 | 0.0 | 48.6 | 46.0 | 4.9 | 63.3 |
| 175 | 63.3 | 0.0 | 0.0 | 0.0 | 45.5 | 43.7 | 7.4 | 63.2 |
| 175 | 113.3 | 0.0 | 0.0 | 0.0 | 45.5 | 47.8 | 5.7 | 65.5 |
| 175 | 163.3 | 0.0 | 0.0 | 0.0 | 38.6 | 52.6 | 6.6 | 68.6 |
The partition of cellulose and hemicellulose fraction between liquid and solid phases is depicted in Fig. 1. The analysis of this figure reveals that hemicellulose recovery for the lowest temperature was quantitative, whereas for more severe conditions the recovery of the hemicellulose fraction decreased significantly reaching only a 49.4% (w/w) for the most severe conditions. Furthermore, most of the hemicellulose can be found in the liquor as hydrolysis and degradation products. In the case of cellulose recovery, an analogous decrease was obtained; however, the decline was considerably less pronounced than that of hemicellulose.
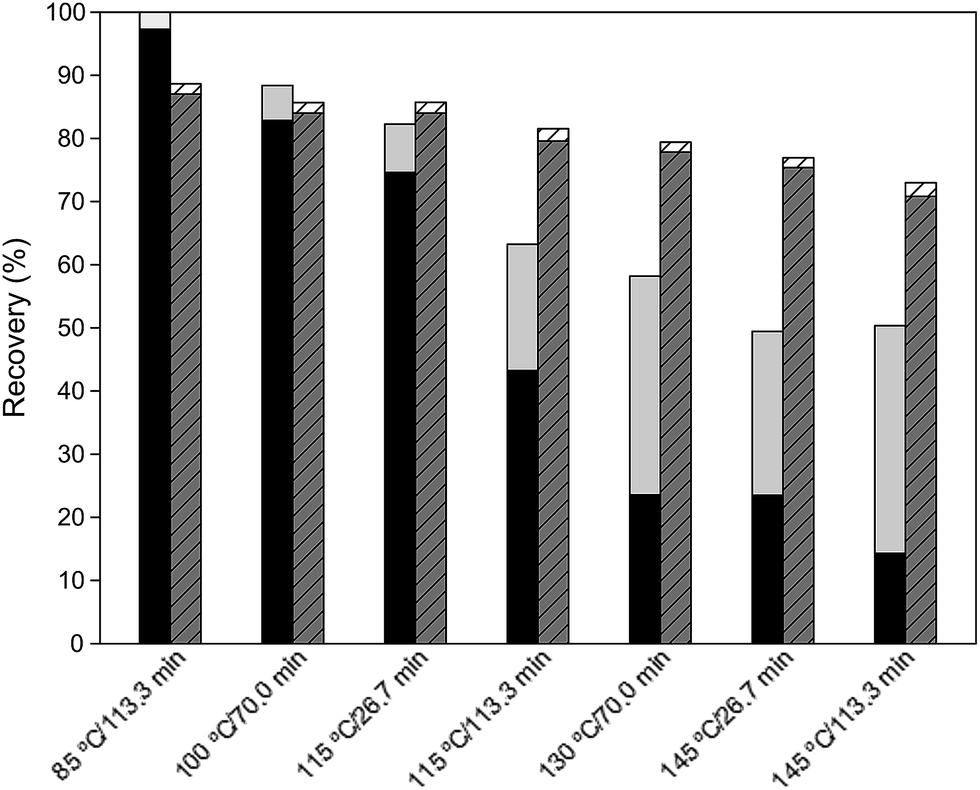 | ||
| Fig. 1 Total recovery of hemicellulose (black – in solid, gray – in liquor) and cellulose (dashed dark gray – in solid, dashed white – in liquor) in the pre-treatment of wheat straw with [bmim][HSO4] for xylose production. | ||
Furfural production
The previously performed pre-treatments demonstrated that xylose is rapidly converted into furfural mostly at higher temperatures. Therefore, the extent of wheat straw pre-treatment and hydrolysis with the aim of hemicellulose conversion to furfural was also studied under more severe conditions. The conditions chosen by Doehlert experimental design (Table 1 of ESI†) to study and to optimise the production of furfural with [bmim][HSO4] were as follows: 130 °C/70.0 min, 130 °C/156.6 min, 145 °C/113.3 min, 160 °C/70.0 min, 160 °C/156.6 min and 175 °C/113.3 min. Furthermore, two additional sets of conditions, namely, 175 °C/163.3 min and 175 °C/63.3 min were also taken into account for the optimisation of furfural production.Table 1 presents the data obtained from the liquor analysis for new conditions regarding furfural production. The hemicellulose-originated monosaccharides present in the liquor clearly disappeared under more severe conditions. Xylose and arabinose were observed only for the less severe conditions (130 °C/156.6 min, 160 °C/70.0 min and 175 °C/63.3 min), and arabinose was only detected in the liquor obtained from the process at 130 °C/156.6 min, but even so in a negligible concentration. The xylose and arabinose disappearance was counterbalanced by the increase of furfural yield, in which a maximum yield of 36.2% (w/w) for pre-treatment at 160 °C/156.6 min was reached. However, for higher temperature and longer pre-treatment time, its yield decreased significantly. It is worth mentioning that the increase of reaction time from 113.3 to 163.3 min at 175 °C leads to a significant decrease in furfural content compensated by a significant rise of formic acid production. Another product obtained from hemicellulose was acetic acid. The acetyl group hydrolysis was quantitative in all the reactions showing that conditions more severe than 160 °C/70 min are harsh enough to convert acetyl groups present in the hemicellulose into acetic acid. Glucose, HMF and levulinic acid show similar trends to those observed for xylose and its degradation products. Although the yields are considerably lower than in the case of hemicellulose-based products, it can be found that the glucose and HMF yields are virtually constant irrespective of the examined reaction conditions.
As presented in Table 2, the solid yield obtained from the pre-treatments was in the range of 59.7% to 68.6% (w/w). Arabinan and acetyl groups were not found in the solid residue. In addition, xylan was found only in samples produced under the less severe reaction conditions. The major fractions of the produced solid are glucan and lignin. Along with the increase of reaction severity, the glucan content decreased by 1/3 to 38.6% (w/w). At the same time, an increase of lignin content was doubled and at the most severe conditions lignin constituted more than an half of the produced solids.
Analysing the recovery of polysaccharide fractions it can be stated that in case of hemicellulose a continuous decrease of recovery yield with an increase of temperature was observed. Hence, the cellulose recovery yield is less susceptible under the examined reaction conditions and thus, the recovery yield decreased considerably more slowly than that for hemicellulose, as observed in Fig. 2.
 | ||
| Fig. 2 Total recovery of hemicellulose (black – in solid, gray – in liquor) and cellulose (dashed dark gray – in solid, dashed white – in liquor) in pre-treatment of wheat straw with [bmim][HSO4] for furfural production conditions. | ||
Optimisation of xylose and furfural production
The pre-treatment reaction conditions for production of xylose and furfural were determined based on the Doehlert experimental designs according to data shown in Tables 1–4 in the ESI.† The 3D response surfaces based on the statistical modelling are depicted in Fig. 3. | ||
| Fig. 3 Response surface and contour plot of modelled xylan hydrolysis into xylose (bottom figure), and hemicellulose conversion to furfural (upper figure) as a function of reaction time (min) and temperature (°C). | ||
The optimum condition set obtained after the statistical modelling analysis for Y1 was 125 °C/82.1 min with a statistical response estimated at the level of 17.1% (w/w) of xylose. The optimum conditions for the response Y2 was 161 °C/104.5 min with 33.3% of conversion to furfural. The model was validated by performing the pre-treatment at the optimised conditions and results are presented in the ESI (Tables 5 and 6).† The experimental value for the xylose production obtained was 16.7% (w/w), whereas in the case of xylan to furfural conversion the experimental validations obtained 32.2% of conversion to furfural.
Discussion
In the last few years, various studies about the pre-treatment and fractionation of biomass using ILs have been reported.6–19,40 Recently, the ILs containing [HSO4] anion became an appealing option to be used in the biomass pre-treatment, and the acidic properties of this IL allows for the catalytic conversion of biomass.6,45,51–53 In fact, the acidity of this IL not only allows the hydrolysis of hemicellulose into monosaccharides such as xylose and arabinose, but also converts those monosaccharides into further degradation products such as furfural.18 In this work, this approach was deeply scrutinised by the wheat straw pre-treatment with [bmim][HSO4] focusing the selective catalysis of the hemicellulosic fraction for the production of xylose and furfural.Combined severity factor (CSF) as the comparison parameter
The analysis of the obtained results based on two independent parameters (temperature and time of the pre-treatment) does not allow for direct analysis of the influence of these parameters on the reaction results. Thus, for comparison purposes a severity factor (logR0) defined by Overend and Chornet54,55 was applied. A severity factor is described by the following equation  , where t is time expressed in minutes, T relates to temperature in °C, 100 is the reference temperature (100 °C) and 14.75 is an empirical constant. Furthermore, considering a strongly acidic character of some pre-treatments the combined severity factor described by the following equation CSF = log(R0) − pH should be considered. A close inspection of the equation depicting the severity factor reveals that the reference temperature and empirical factors are related to temperature at which water starts to act as a catalyst. This approach is valid for classical pre-treatment processes (e.g. autohydrolysis or acid catalysis);56 however, this is not the case for pre-treatments occurring in non-aqueous media such as ILs. Thus, new parameters are needed to be established following the methodology presented by Chum et al.57 Hence, the severity factor, R0, expressed by the aforementioned equation can be also presented in a more general form such as
  , where, Tr and Tb are absolute reaction temperature and reference temperature when hydrolysis initiates, respectively, and are expressed in °C, and ω is a dimensional constant that translates the effect of the temperature in the conversion. Yields of hemicellulose hydrolysis with [bmim][HSO4] obtained in this work were used to estimate the values of Tb and ω. The value of Tb was obtained by applying the Doehlert design for all the hemicellulose hydrolysis experiments examined. The point (x,0,0) represents the value of Tb and as such, by resolving the equation obtained from experimental design in the form of Y = 64.0048 + 74.5027X1 + 19.4424X2 − 19.9022X1X2 − 36.3594X12, where, Y is the percentage of hemicellulose hydrolysis, and X1, X2 are the temperature (°C) and pre-treatment time (min), respectively, gave Tb = 88.28 °C. The value of ω was obtained by the representation of the equation Y = mX + B, where Y = ln(−ln(1 − α)), and α is the hydrolysis of hemicellulose, X is the combined severity factor calculated in the following manner: X = CSF = log10(R0heating − R0isothermal) − pH, where R0heating is the severity factor for heating and R0isothermal is the severity factor for the isothermal condition process, and pH is the pH of the [bmim][HSO4] and is equal to 1.0. Hence the value of ω was obtained by the maximisation of R2 and for R2 = 0.99 ω is equal to 6.47. Finally, the CSF used in this work has the following formula
 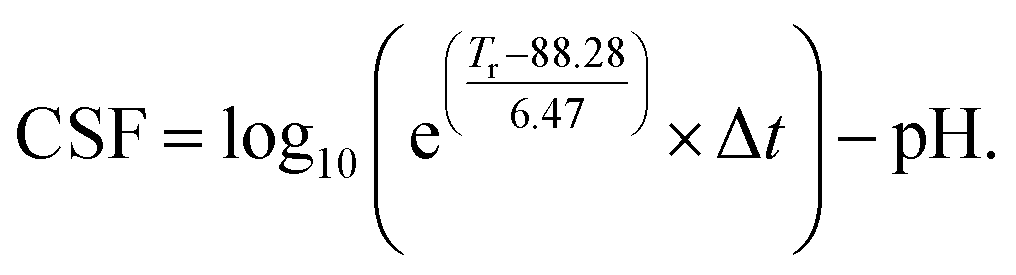 All CSF for examined conditions are depicted in Table 3.
| T (°C) | 85 | 100 | 115 | 115 | 145 | 130 | 130 | 145 | 160 | 160 | 175 | 175 | 175 |
| t (min) | 113.3 | 70.0 | 26.7 | 113.1 | 26.7 | 70.0 | 156.6 | 113.3 | 70 | 156.6 | 63.3 | 113.3 | 163.3 |
| CSF | 0.80 | 1.56 | 1.89 | 2.79 | 3.52 | 3.52 | 3.94 | 4.77 | 5.46 | 5.93 | 6.34 | 6.74 | 6.95 |
Catalysis performance of [bmim][HSO4]
Among all examined pre-treatment conditions, the hydrolysis of hemicellulose occurred, even at the lowest temperature examined. At CSF = 0.80 (85 °C/113.3 min), the presence of arabinose in the liquid phase (20.3% (w/w)) without xylose indicates that arabinan is the first and the most susceptible fraction for hydrolysis. Similar behaviour was found in the literature for other types of pre-treatments. For instance, Carvalheiro et al. studied the kinetics of breweries spent grain autohydrolysis and verified that the highest concentrations of arabinose oligomers were obtained first and for shorter reaction times than xylose oligomers.58 This phenomenon finds also an explanation in the chemical structure of hemicellulose, which consists of arabinan branches in xylopyranosyl backbone that makes arabinan more susceptible to the hydrolysis than xylan polymer. Furthermore, it is important to notice that arabinose content in the liquid phase decreases with an increase of pre-treatment severity. On the contrary, the yield of xylose increases and reaches a maximum value at CSF = 3.52 (130 °C/70 min). Further increase of the severity (CSF > 3.94) causes the complete disappearance of xylose observed in case of pre-treatments performed at CSF = 5.46, or in other words for temperatures equal or higher than 160 °C. As expected, the discussed decrease of monosaccharide yields is accompanied by the increase of furfural content in the liquid phase. The achieved results permit the conclusion that temperature seems to be a key parameter in favouring the hydrolysis of hemicellulose,20,56 which for more severe conditions (CSF > 3.52) guides the conversion of monosaccharides into furfural. These results are coherent with literature data for the pre-treatment of Miscanthus biomass by the same IL.45As mentioned before arabinose is first formed, but next is rapidly converted into furfural. Xylose follows this pathway and undergoes a quick conversion to furfural too. Nonetheless, for CSF = 6.34, the degradation of furfural was observed, suggesting that the employed conditions were considerably severe and furfural may suffer further degradation.59,60 Similar to both hemicellulosic saccharides, the increase of acetic acid production was observed in the liquid phase meaning a continuous hydrolysis of acetyl groups attached to the hemicellulose structure. With respect to cellulose hydrolysis and conversion with [bmim][HSO4], the results show that glucose is barely produced and at the same time causes its conversion into HMF. This is an unique characteristic of [bmim][HSO4], which demonstrates the selective hydrolysis of hemicellulose and obtains its derivative products, as depicted in Fig. 4.
 | ||
| Fig. 4 Glucose (■), arabinose and xylose (□), furfural (●) (left scale) and acetyl groups (○) (right scale) found in the liquors after pre-treatment carried out with [bmim][HSO4]. Solid/dashed/dashed-dot-dot and short-long-short dashed lines are designed by polynomial adjustment to the experimental points and serve as a guide for the eye. | ||
The chemical characterisation of the pre-treated solids (Table 2) shows an enrichment of glucan and lignin contents along with the increase of severity of the performed reactions caused by the extensive hydrolysis of hemicellulose. Actually, total hemicellulose hydrolysis was achieved for pre-treatments with CSF > 4.77 (temperature above 145 °C). The main fractions constituting the processed solids are cellulose and lignin. The maximum cellulose content (58.2% (w/w)) in the solid was reached at CSF = 3.52 (130 °C/70.0 min), but for more severe conditions, the cellulose content decreased and the lowest (38.6% (w/w)) was found after the reaction at the most severe conditions (CSF = 6.95). Surprisingly, this decrease was not reflected in the liquid phase, where glucose, HMF and levulinic acid contents are very low (4.9% (w/w) on the glucan basis). Actually, analysing the mass balance of the process, close to 34.0% (w/w) cellulose was lost for the most severe reaction conditions (Fig. 2). Despite the high cellulose that was lost, the hemicellulose mass loss was even higher. Hemicellulose had the lowest recovery of 29.3% at CSF = 6.95. Equal to cellulose, the total mass of hemicellulose quantified in the liquid phase did not correspond to the mass removed from the solid. The explanation of the cellulose and hemicellulose disappearance is the possibility to form humins (pseudo-lignin).59,60 The literature reports state that released sugars and produced furans may react in the liquid phase and form polymeric insoluble carbon-enriched compounds called chars or pseudo-lignin (humins). The method for the compositional analysis of lignocellulosic biomass, developed by the NREL and presented above, does not distinguish between Klason lignin, which is naturally present in the biomass, and pseudo-lignin resulting from sugar degradation.60 Therefore, the disappearance of saccharide fractions and lignin recovery higher than 180% obtained in this work, shown in Fig. 5, may justify cellulose and hemicellulose mass losses. The creation of humins normally occurs for temperatures above 160 °C (ref. 60) and following the literature reports at more severe pre-treatment temperatures (180 °C) carbohydrate-derived pseudo-lignin can achieve even 94.4% (w/w).60 In addition, the phenomenon of humin formation can be confirmed looking at the solid yield presented in Table 2. For less severe reaction conditions, particularly those performed at lower temperature, the solid yield decreased with an increase of reaction severity, which is normal behaviour as a great part of the hemicellulosic fraction became hydrolysed.20,21,56 However, processes carried out at high temperatures showed an increase of solid yield with the increase of reaction temperature, which might be explained by the aforementioned formation of pseudo-lignin.
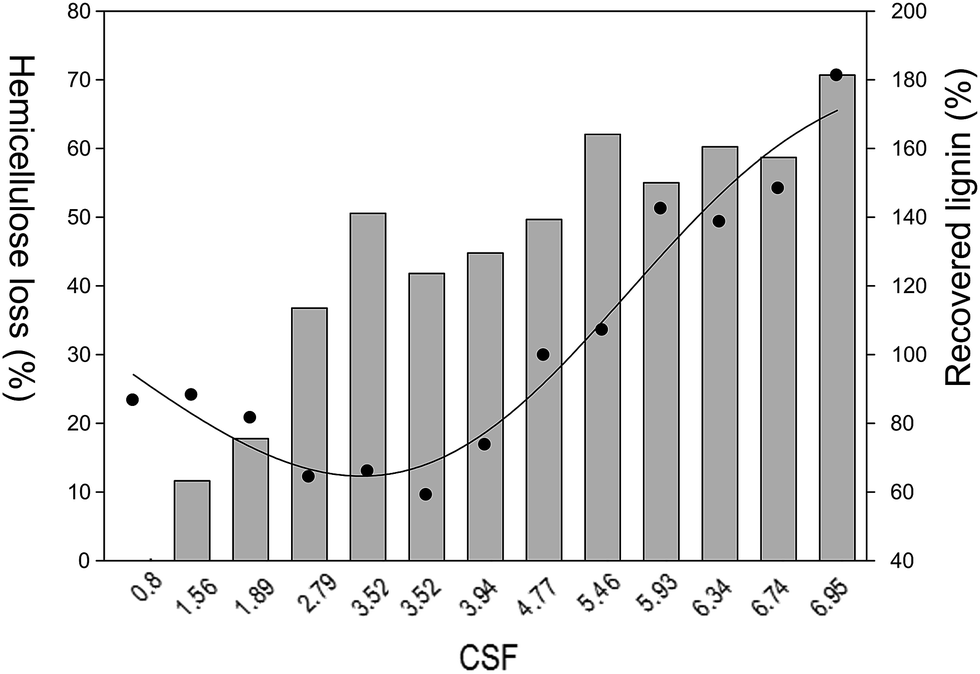 | ||
| Fig. 5 Total hemicellulose loss (bars) and recovered lignin (●) in the course of the pre-treatments executed. Solid line is designed by polynomial adjustment to the experimental data and does not have any physical meaning and serves as guide for the eye. | ||
Optimisation of xylose and furfural production
The optimisation of hemicellulose hydrolysis to sugars, in particular to xylose, was one of the goals of this work. The collected data for xylose production was submitted to statistical modelling (data in ESI†) and using the statistically significant regression coefficients (p < 0.05) the following model equation was found: Y1 = 13.82 + 19.77X1 + 7.04X2 − 18.29X1X2 − 32.00X12. According to the positive linear coefficient for X1 and X2, it can be concluded that the amount of xylose obtained increases with an increase of temperature and reaction time. The absolute values of the coefficients β1 and β2 show that the temperature (X1) has stronger influence (almost 3-fold) on xylose production than time (X2). On the other hand, the negative value for β11 indicates that the quadratic interaction of X1 effects negatively the production of xylose. The negative value of β12 coefficient indicates that the interaction of X1 and X2 is not proportional and the increase of temperature and subsequent reaction time has a negative effect on xylose yield.The optimum condition to attain the maximal xylose yield was identified to be at 125 °C/82.1 min. The xylose yield obtained was 16.7% (w/w) and 7.6% (w/w) conversion to furfural. The TRS (total reducing sugar) yield, for this condition was 12.5% (w/w). Li et al., also explored the use of [HSO4] based ILs on the pre-treatment of corn stalk.53 They obtained a maximum 23% and 15% TRS yields at 5 and 2 min using [bmim][HSO4] and [C4SO3Hmim][HSO4], correspondingly for 100 °C. Nevertheless, longer reaction times produced an even lower TRS yield.53
The chemical analysis of the solid fraction obtained with the optimum conditions, demonstrated that xylan was still present in the recovered biomass (Table 2). In other words, under these conditions an incomplete hydrolysis of hemicellulose was obtained. However, as it was found for other conditions, more severe conditions favour furfural production, and thus it can be stated that [bmim][HSO4] converts xylan to xylose and next a sudden conversion to furfural occurs. Therefore, the production of furfural with [bmim][HSO4] was also studied considering a higher biomass conversion provoked by this IL. The experimental data submitted to the Doehlert model design presented a low statistical significance after evaluating statistically significant regression coefficients (p < 0.05). The following equation was obtained: Y2 = 30.16 + 12.89X1 − 13.70X12. This equation shows that only the variation of temperature has statistical significance (linear and quadratic) and as such, it can be concluded that the variation of time is statistically insignificant for furfural production. Nevertheless, the negative value of the β11 coefficient translates into a decrease of furfural for more severe processes. This can be observed at CSF = 6.95 (175 °C/163.3 min) where a pronounced decrease of furfural concentration was observed. The optimum conditions for furfural formation was found to be at 161 °C/104.5 min. Under these conditions, the conversion of hemicellulose to furfural was 30.7% (w/w) and xylose was not present in the pre-treatment liquor. Brandt et al., verified that at 120 °C, using 80 vol% of the IL [bmim][HSO4] and 20 vol% water in the pre-treatment of Miscanthus for 22 h, the resulting liquor contained approximately 33% of furfural.45 They also reported that using [bmim][MeSO3] under the same conditions obtained a 14.8% furfural yield. Thus, comparing the obtained results to these presented in this work, it can be stated that similar conversion to furfural 30.7% vs. 33% was achieved for a shorter pre-treatment processes without excessive amounts of water within the system.
Effect of water content on the biomass pre-treatment
As it has been reported, water has a great influence on the efficiency of the biomass pre-treatments by ILs.36,37,61–63 Generally, water acting as an anti-solvent negatively affects cellulose and lignocellulose dissolution in ILs.35,36 Furthermore, considering the discussed above selectivity aspect, it is important to understand the mechanism driving the xylose conversion to furfural.64–66 The mechanism proposed in the literature assumes the formation of furfural by the dehydration of xylose. Therefore, it can be assumed that equilibrium of this reaction should be sensitive towards the water content in the reaction mixture. Considering that in the examined system only 1.24% (w/w) (5385 ppm of water in IL and 8.3% (w/w) humidity of biomass) was present, it can be understood why in the presence of a hydrophilic ionic liquid such as [bmim][HSO4] the hemicellulose undergoes hydrolysis to xylose and arabinose and later both rapidly and kinetically favoured are converted to furfural liberating water. Following this hypothesis and analysing the hemicellulose hydrolysis reaction chain shown in Fig. 6, it can be expected that the addition of water should have a positive “protecting” effect on the inhibition of xylose and arabinose dehydration to furfural. Moreover, the additional amount of water could enhance the hydrolysis of hemicellulose to monosugars according to Fig. 7.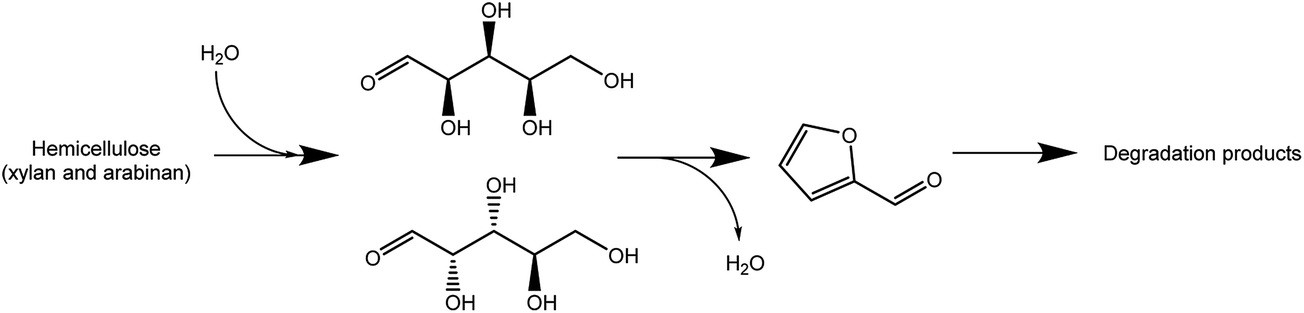 | ||
| Fig. 6 Schematic hemicellulose hydrolysis reaction chain. | ||
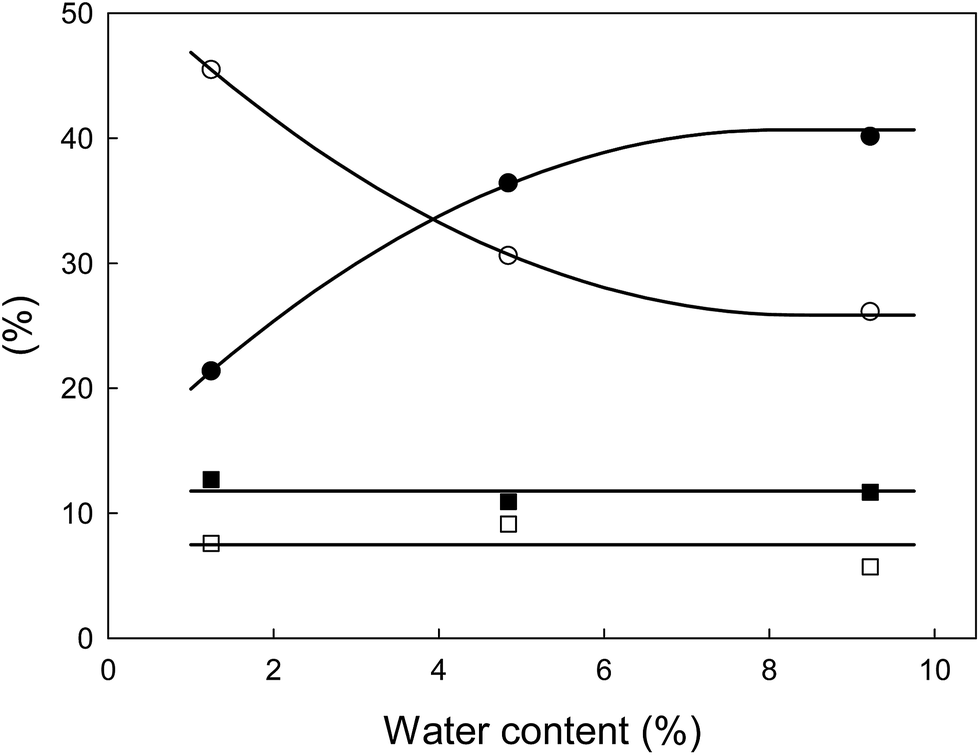 | ||
| Fig. 7 Effect of water content in hemicellulose hydrolysis (sum of arabinose and xylose (●), hemicellulose content (sum of arabinan and xylan) in solid (■), hemicellulose conversion to furfural (□), and hemicellulose loss (degradation product) (○) at 120 °C/82.1 min; solid lines are designed by polynomial adjustment to the experimental points. | ||
To validate the veracity of this hypothesis, additional experiments were performed. Two additional pre-treatments at the optimum conditions achieved for xylose production (125 °C/82.1 min) were performed using 4.84% and 9.22% (w/w) water content in the pre-treatment system. Liquid phase analysis demonstrated that by increasing the water content from 1.24% to 4.84% (w/w) the sum of xylose and arabinose concentrations increase by 70%. In the initial pre-treatment at 1.24% (w/w) the sum of concentrations of both monosaccharides was 21.4% (w/w), and at 4.84% (w/w) water content the value increased to 36.4% (w/w) (Fig. 8). For 9.22% (w/w) water content in the pre-treatment system another increase of sum of xylose and arabinose concentrations (Fig. 8) to 40.1% (w/w) was observed. It is also important to underpin that the amount of water does not alter significantly the furfural presence in the liquor, and thus the furfural yield was observed to be constant. On the other hand, the amount of degradation products, as shown on Fig. 7, as hemicellulose loss is significantly reduced and is well correlated with the abovementioned increase of arabinose and xylose concentrations especially because there is no increase of xylan and arabinan disappearance in the solid.
 | ||
| Fig. 8 The schematic representation of the potential processes of biomass valorisation with [bmim][HSO4]. The bracket depicts the study being the focus of the work presented in this study. | ||
Conclusions and final remarks
The exploitation of lignocellulosic residue potential is an important issue in the context of green chemistry and biorefinery concepts. In this work a method of wheat straw pre-treatment using the acidic [bmim][HSO4] IL was employed. Two independent parameters were optimised using the Doehlert statistical model design determining the maximal xylose and furfural productions. For comparison of the set of experimental data, the severity factor for pre-treatment with [bmim][HSO4] was proposed. Less severe reaction conditions favoured xylose formation and the maximum yield of xylose of 16.7% (w/w) was obtained at 125 °C/82.1 min. Furfural was mostly formed with more severe conditions and 30.7% (w/w) was obtained at 161 °C/104.5 min. Variation of water content was studied and an increase of water content to 4.84% (w/w) led to hemicellulose sugar yields of 36.4% (w/w). A pre-treatment process using a 9.22% (w/w) content resulted in hemicellulose-originated sugars in a yield of 40.1% (w/w). At the same time, conversion to furfural was maintained. The performed experiments allowed for the selective removal of hemicellulose from processed biomass confirming that the acidic IL is capable to selectively catalyse hemicellulose with a green and sustainable approach.To accomplish the comprehensive engineering approach of the presented process, the product recovery as well as recycling and reuse of IL should be considered, as shown in Fig. 8.
The efficiency of the process is also connected with further valorisation of biomass in addition to the production of xylose and furfural. After pre-treatment, the obtained solid can be further fractionated into cellulose and lignin. An effective separation process of the main fractions of lignocellulosic biomass was already presented elsewhere.18 Furthermore, the formation of humins is an interesting phenomenon and could be examined as the opportunity for the process with [bmim][HSO4].
Acknowledgements
This work was supported by the Fundação para a Ciência e a Tecnologia (FCT, Portugal) through the Bilateral Cooperation project FCT/CAPES 2014/2015 (FCT/1909/27/2/2014/S) and grants SFRH/BD/90282/2012 (AMdCL), IF/00424/2013 (RBL) and by CAPES (Brazil) supporting the project Pesquisador Visitante Especial 155/2012.References
- M. Foston and A. J. Ragauskas, Ind. Biotechnol., 2012, 8, 191–208 CrossRef CAS.
- F. M. Girio, C. Fonseca, F. Carvalheiro, L. C. Duarte, S. Marques and R. Bogel-Lukasik, Bioresour. Technol., 2010, 101, 4775–4800 CrossRef CAS PubMed.
- M. FitzPatrick, P. Champagne, M. F. Cunningham and R. A. Whitney, Bioresour. Technol., 2010, 101, 8915–8922 CrossRef CAS PubMed.
- J. J. Bozell and G. R. Petersen, Green Chem., 2010, 12, 539–554 RSC.
- V. Menon and M. Rao, Prog. Energy Combust. Sci., 2012, 38, 522–550 CrossRef CAS PubMed.
- A. M. da Costa Lopes, K. G. Joao, D. F. Rubik, E. Bogel-Lukasik, L. C. Duarte, J. Andreaus and R. Bogel-Lukasik, Bioresour. Technol., 2013, 142, 198–208 CrossRef CAS PubMed.
- I. Anugwom, V. Eta, P. Virtanen, P. Maki-Arvela, M. Hedenstrom, M. Hummel, H. Sixta and J. P. Mikkola, ChemSusChem, 2014, 7, 1170–1176 CrossRef CAS PubMed.
- A. Brandt, J. Grasvik, J. P. Hallett and T. Welton, Green Chem., 2013, 15, 550–583 RSC.
- I. Anugwom, V. Eta, P. Virtanen, P. Mäki-Arvela, M. Hedenström, M. Yibo, M. Hummel, H. Sixta and J.-P. Mikkola, Biomass Bioenergy, 2014, 70, 373–381 CrossRef CAS PubMed.
- A. M. da Costa Lopes, K. G. João, A. R. C. Morais, E. Bogel-Lukasik and R. Bogel-Lukasik, Sustainable Chem. Processes, 2013, 1, 3 CrossRef.
- I. Anugwom, J. P. Mikkola, P. Mäki-Arvela and A. Virtanen, WO2012/059643, 2012.
- T. Leskinen, A. W. King, I. Kilpeläinen and D. S. Argyropoulos, Ind. Eng. Chem. Res., 2013, 52, 3958–3966 CrossRef CAS.
- A. S. da Silva, R. S. S. Teixeira, T. Endo, E. P. S. Bon and S. H. Lee, Green Chem., 2013, 15, 1991–2001 RSC.
- T. Leskinen, A. W. King, I. Kilpeläinen and D. S. Argyropoulos, Ind. Eng. Chem. Res., 2011, 50, 12349–12357 CrossRef CAS.
- S. Hyvärinen, P. Virtanen, D. Y. Murzin and J.-P. Mikkola, Cellul. Chem. Technol., 2010, 44, 187 Search PubMed.
- S. P. M. da Silva, A. M. da Costa Lopes, L. B. Roseiro and R. Bogel-Lukasik, RSC Adv., 2013, 3, 16040–16050 RSC.
- A. Brandt, J. P. Hallett, D. J. Leak, R. J. Murphy and T. Welton, Green Chem., 2010, 12, 672–679 RSC.
- A. M. da Costa Lopes, K. G. João, E. Bogel-Lukasik, L. B. Roseiro and R. Bogel-Lukasik, J. Agric. Food Chem., 2013, 61, 7874–7882 CrossRef CAS PubMed.
- A. M. da Costa Lopes and R. Bogel-Lukasik, ChemSusChem, 2015, 8, 947–965 CrossRef CAS PubMed.
- A. R. C. Morais, A. C. Mata and R. Bogel-Lukasik, Green Chem., 2014, 16, 4312–4322 RSC.
- S. P. M. da Silva, A. R. C. Morais and R. Bogel-Lukasik, Green Chem., 2014, 16, 238–246 RSC.
- A. R. C. Morais, A. M. da Costa Lopes and R. Bogel-Lukasik, Chem. Rev., 2015, 115, 3–27 CrossRef CAS PubMed.
- C. Zetzl, K. Gairola, C. Kirsch, L. Perez-Cantu and I. Smirnova, Chem. Ing. Tech., 2011, 83, 1016–1025 CrossRef CAS PubMed.
- F. W. Lichtenthaler and S. Peters, C. R. Chim., 2004, 7, 65–90 CrossRef CAS PubMed.
- Y. U. Paulechka, G. J. Kabo, A. V. Blokhin, O. A. Vydrov, J. W. Magee and M. Frenkel, J. Chem. Eng. Data, 2003, 48, 457–462 CrossRef CAS.
- U. Domanska and R. Bogel-Lukasik, J. Phys. Chem. B, 2005, 109, 12124–12132 CrossRef CAS PubMed.
- R. Bogel-Lukasik, L. M. N. Goncalves and E. Bogel-Lukasik, Green Chem., 2010, 12, 1947–1953 RSC.
- J. F. B. Pereira, F. Vicente, V. C. Santos-Ebinuma, J. M. Araujo, A. Pessoa, M. G. Freire and J. A. P. Coutinho, Process Biochem., 2013, 48, 716–722 CrossRef CAS PubMed.
- R. Bogel-Lukasik, D. Matkowska, M. E. Zakrzewska, E. Bogel-Lukasik and T. Hofman, Fluid Phase Equilib., 2010, 295, 177–185 CrossRef CAS PubMed.
- M. G. Freire, A. R. R. Teles, M. A. A. Rocha, B. Schroder, C. M. S. S. Neves, P. J. Carvalho, D. V. Evtuguin, L. M. N. B. F. Santos and J. A. P. Coutinho, J. Chem. Eng. Data, 2011, 56, 4813–4822 CrossRef CAS.
- A. Forte, E. Bogel-Lukasik and R. Bogel-Lukasik, J. Chem. Eng. Data, 2011, 56, 2273–2279 CrossRef CAS.
- K. Paduszynski, M. Okuniewski and U. Domanska, J. Phys. Chem. B, 2013, 117, 7034–7046 CrossRef CAS PubMed.
- U. Domanska, A. Pobudkowska and P. Bochenska, J. Chem. Eng. Data, 2012, 57, 1894–1898 CrossRef CAS.
- U. Domanska and R. Bogel-Lukasik, Fluid Phase Equilib., 2005, 233, 220–227 CrossRef CAS PubMed.
- M. E. Zakrzewska, E. Bogel-Lukasik and R. Bogel-Lukasik, Energy Fuels, 2010, 24, 737–745 CrossRef CAS.
- R. P. Swatloski, S. K. Spear, J. D. Holbrey and R. D. Rogers, J. Am. Chem. Soc., 2002, 124, 4974–4975 CrossRef CAS PubMed.
- I. A. Kilpeläinen, H. Xie, A. King, M. Granstrom, S. Heikkinen and D. S. Argyropoulos, J. Agric. Food Chem., 2007, 55, 9142–9148 CrossRef PubMed.
- A. A. Rosatella, R. F. M. Frade and C. A. M. Afonso, Curr. Org. Synth., 2011, 8, 840–860 CAS.
- O. A. El Seoud, A. Koschella, L. C. Fidale, S. Dorn and T. Heinze, Biomacromolecules, 2007, 8, 2629–2647 CrossRef CAS PubMed.
- Y. Y. Liu, W. W. Xiao, S. Q. Xia and P. S. Ma, Carbohydr. Polym., 2013, 92, 218–222 CrossRef CAS PubMed.
- A. S. Amarasekara and B. Wiredu, Int. J. Carbohydr. Chem., 2012, 2012, 1–6 CrossRef PubMed.
- Y. L. Gu, F. Shi and Y. Q. Deng, Catal. Commun., 2003, 4, 597–601 CrossRef CAS PubMed.
- A. S. Amarasekara and O. S. Owereh, Ind. Eng. Chem. Res., 2009, 48, 10152–10155 CrossRef CAS.
- M. E. Zakrzewska, E. Bogel-Lukasik and R. Bogel-Lukasik, Chem. Rev., 2011, 111, 397–417 CrossRef CAS PubMed.
- A. Brandt, M. J. Ray, T. Q. To, D. J. Leak, R. J. Murphy and T. Welton, Green Chem., 2011, 13, 2489–2499 RSC.
- L. Chen, M. Sharifzadeh, N. Mac Dowell, T. Welton, N. Shah and J. P. Hallett, Green Chem., 2014, 16, 3098–3106 RSC.
- A. Sluiter, B. Hames, R. Ruiz, C. Scarlata, J. Sluiter and D. Templeton, Determination of Sugars, Byproducts, and Degradation Products in Liquid Fraction Process Samples - Laboratory Analytical Procedure (LAP), National Renewable Energy Laboratory – NREL, http://www.nrel.gov/biomass/analytical_procedures.html, Colorado 80401–3393, 2006.
- S. Hyvarinen, J. P. Mikkola, D. Y. Murzin, M. Vaher, M. Kaljurand and M. Koel, Catal. Today, 2014, 223, 18–24 CrossRef CAS PubMed.
- S. Rovio, J. Yli-Kauhaluoma and H. Siren, Electrophoresis, 2007, 28, 3129–3135 CrossRef CAS PubMed.
- D. H. Doehlert, J. Roy. Stat. Soc. C Appl. Stat., 1970, 19, 231–239 Search PubMed.
- Z.-D. Ding, J.-C. Shi, J.-J. Xiao, W.-X. Gu, C.-G. Zheng and H.-J. Wang, Carbohydr. Polym., 2012, 90, 792–798 CrossRef CAS PubMed.
- X. M. Hu, Y. B. Xiao, K. Niu, Y. Zhao, B. X. Zhang and B. Z. Hu, Carbohydr. Polym., 2013, 97, 172–176 CrossRef CAS PubMed.
- C. Z. Li, Q. Wang and Z. K. Zhao, Green Chem., 2008, 10, 177–182 RSC.
- N. Abatzoglou, E. Chornet, K. Belkacemi and R. P. Overend, Chem. Eng. Sci., 1992, 47, 1109–1122 CrossRef CAS.
- Y. Kim, T. Kreke, N. S. Mosier and M. R. Ladisch, Biotechnol. Bioeng., 2014, 111, 254–263 CrossRef CAS PubMed.
- F. Carvalheiro, T. Silva-Fernandes, L. C. Duarte and F. M. Gírio, Appl. Biochem. Biotechnol., 2009, 153, 84–93 CrossRef CAS PubMed.
- H. L. Chum, D. K. Johnson, S. K. Black and R. P. Overend, Appl. Biochem. Biotechnol., 1990, 24–25, 1–14 CrossRef CAS.
- F. Carvalheiro, G. Garrote, J. C. Parajo, H. Pereira and F. M. Girio, Biotechnol. Prog., 2005, 21, 233–243 CrossRef CAS PubMed.
- H. Rasmussen, H. R. Sorensen and A. S. Meyer, Carbohydr. Res., 2014, 385, 45–57 CrossRef CAS PubMed.
- R. Kumar, F. Hu, P. Sannigrahi, S. Jung, A. J. Ragauskas and C. E. Wyman, Biotechnol. Bioeng., 2013, 110, 737–753 CrossRef CAS PubMed.
- N. Sun, M. Rahman, Y. Qin, M. L. Maxim, H. Rodriguez and R. D. Rogers, Green Chem., 2009, 11, 646–655 RSC.
- W. H. Hsu, Y. Y. Lee, W. H. Peng and K. C. W. Wu, Catal. Today, 2011, 174, 65–69 CrossRef CAS PubMed.
- L. J. A. Conceiçao, E. Bogel-Lukasik and R. Bogel-Lukasik, RSC Adv., 2012, 2, 1846–1855 RSC.
- T. Ahmad, L. Kenne, K. Olsson and O. Theander, Carbohydr. Res., 1995, 276, 309–320 CrossRef CAS.
- J. B. Binder, J. J. Blank, A. V. Cefali and R. T. Raines, ChemSusChem, 2010, 3, 1268–1272 CrossRef CAS PubMed.
- V. Choudhary, A. B. Pinar, S. I. Sandler, D. G. Vlachos and R. F. Lobo, ACS Catal., 2011, 1, 1724–1728 CrossRef CAS.
Footnote |
| † Electronic supplementary information (ESI) available: Details of statistical modelling and CE and HPLC spectra are presented. See DOI: 10.1039/c5ra07159c |
| This journal is © The Royal Society of Chemistry 2015 |