DOI:
10.1039/C5RA05801E
(Paper)
RSC Adv., 2015,
5, 47140-47152
Biodiesel synthesis from photoautotrophic cultivated oleoginous microalgae using a sand dollar catalyst
Received
1st April 2015
, Accepted 14th May 2015
First published on 14th May 2015
Abstract
The aim of this study was to synthesize a calcined sand dollar (CSD), Clypeaster reticulatus as a green mixed oxide CaO–MgO solid catalyst through a thermal degradation method for transesterification of Nannochloropsis oculata (N. oculata) microalgae derived crude oil. The catalysts characterizations were carried out by TG/DTA, XRD, FTIR, TPD-CO2, SEM and ICP–AES analysis, respectively. Formation of binary phase solid oxides i.e. CaO and MgO were confirmed at a calcination temperature of 800 °C. The effect of the reaction parameters i.e. catalyst amount, methanol/oil molar ratio, reaction temperature and time were evaluated for the transesterification reaction. The photoautotrophic microalgae propagation produced lipids with 25.8 ± 4.5% of total lipids, 18.5 ± 1.8% of crude lipids and 12.8 ± 2.6% of neutral lipids, respectively. Interestingly, the produced N. oculata biodiesel using this process revealed an insignificant change in FAME composition, which comprised mostly C16:0 and C16:1, similar to conventional biodiesel. Under the conditions tested, the catalyst showed a 90% yield of fatty acid methyl ester (FAME) at ideal reaction variables of 3 wt% of catalyst loading, 60 °C, 30![[thin space (1/6-em)]](https://www.rsc.org/images/entities/char_2009.gif) :1 of methanol/oil, and 3 h reaction time.
:1 of methanol/oil, and 3 h reaction time.
1. Introduction
Fossil fuels are not renewable and the depletion of fossil fuels is foreseen in the next several decades. Thus, researchers have been directed towards the development of alternative sustainable fuels. The renewable, biodegradable, and non-toxic properties of biodiesel make it to become a more promising alternative fuel for the future.1–3 The sustainability issue of biodiesel could be directly related to the world market price of feedstocks. The major bottleneck is known as the cost (75% of the total biodiesel production cost) related to the limited availability of fat or oil resources and also the catalyst choice.4 Therefore, the replacement of food based feedstocks with inexpensive sources of feedstocks for biodiesel production is more economical than traditional fossil based fuel.5,6 Simultaneously, finding a profit from the catalytic process is also expected.7
Microalgae have been considered as prospective source of fuel due to its biomass productivity and photosynthesis efficiency.5,8,9 A conclusion has been reached by several authors10,11 who reported that the average lipid content in microalgae varied from 1–85% by total dry cell weight. Hence, to deal with the cost issue of biodiesel production, utilizing the oil extracted from the microalgae as the feedstock has been recognized as one of the best solution.
Conventional alkali, acid, solid or enzyme catalyzed process could drive up the cost of processing (30–40%).2,3,5,7,12,13 The major problems for utilization of these catalysts are expensive and complicated to synthesis in large scale production. Moreover, purification step in homogeneous catalyzed (e.g. H2SO4, HCl, NaOH, KOH and other similar alkoxides) process generate huge amount of wastewater, which result in high energy consumption.3,7
Sand dollar or sea biscuit is a mixture of calcium carbonate (CaCO3) and magnesium carbonate (MgCO3). The skeleton of this dead marine organism scientifically known as Clypeaster reticulates, abundantly available in nature at temperate and tropical zones of Sabah, Malaysia. Sand dollar is a rigid test commonly used in craft and home decor. This species has a worldwide distribution. It can be found from Indian Ocean, Mozambique, Red Sea, Seychelles, Eastern Africa and Madagascar. The calcium based waste shell catalysts i.e. mollusk shells,14 chicken egg shell15 and mud crab shell16 are highly active in methanolysis reaction to converting triglycerides from edible oil to methyl ester. There are only a few literatures that reported on heterogeneous base catalyst for transesterification of microalgae oil to biodiesel such as SrO,17 Mg–Zr12 and Ca(OCH3)2.18 Nevertheless, it should be noted that the used non-naturally derived metal oxides in a relatively high concentration, which leads to increased the biodiesel production cost.
Boro et al.19 investigated combusted Turbonilla striatula shell at 900 °C for methanolysis of mustard oil with MeOH to oil molar ratio of 9:1, 3 wt% catalyst for 6 h and yielded 93.3% of biodiesel. Next, under the optimum condition of 6:1 methanol/oil molar ratio, 5 wt% catalyst loading for 120 min, Sirisomboonchai et al.20 reported that 85% of FAME yield production using scallop shell catalyst after undergo calcination at 1000 °C. To the present, this is the first study on sand dollar which containing binary system metal oxides used as a green heterogeneous base catalyst in biodiesel production from microalgae.
In this study, the bimetallic CaO–MgO as the catalyst was prepared via a simple thermal decomposition method of natural sand dollar tends to increase the interaction between the Ca and Mg due to the vacancies created by the substitution of Ca ions by Mg ions. The strong interaction of binary active phases in the composition of sand dollar skeletons (CaO and MgO) with the aim of improves the stability and durability of catalytic activity in order to make it suitable for biodiesel production. Biodiesel was produced from microalgae oil derived from N. oculata. The oil was extracted from the dry microalgae biomass using a mixture of solvent (chloroform–methanol) after being cell wall breaking with ultrasonic wave. Then, the extracted oil was used for transesterification with a function of reaction variables such as catalyst dosage, methanol to microalgae lipid molar ratio, reaction temperature and time. The deactivation of the catalyst from the reusability test will also be discussed.
2. Experimental section
2.1. Materials
Dead skeletons of Clypeaster reticulatus (aka Sand Dollar) were collected from long stretch of beach from Mataking Besar Island to Mataking Kecil Island during low tide on 9th July 2011. Meanwhile, high density culture of N. oculata was purchased from the AlgaeTech Sdn. Bhd., Klang in Malaysia. Microalgae was cultivated using f/2 medium containing the following components (mg l−1): CuSO4·5H2O (0.006), CoCl2·6H2O (0.006), FeCl3·6H2O (1.8), MnCl2·4H2O (0.013), Na2–EDTA (2.38), NaH2PO4·H2O (5.65), NaNO3 (225), Na2MoO4·2H2O (0.003) and ZnSO4·7H2O (0.013). All the chemicals used were analytical grade (purity >99%). The dry biomass was prepared for oil-lipid extraction using a mixture solvent of chloroform (99%) and methanol (99.8%) (2:1 v/v). Pure methyl ester standard mixture (Sigma-Aldrich 37 components FAME Mix) and internal standard (methyl heptadecanoate, ≥99%, Fluka Analytical) were purchased from Sigma-Aldrich Co. for quantification of FAME yield. n-Hexane (GC grade, 99.8%) were purchased from Merck Pte. Ltd.
2.2. Photoautotrophic cultivation
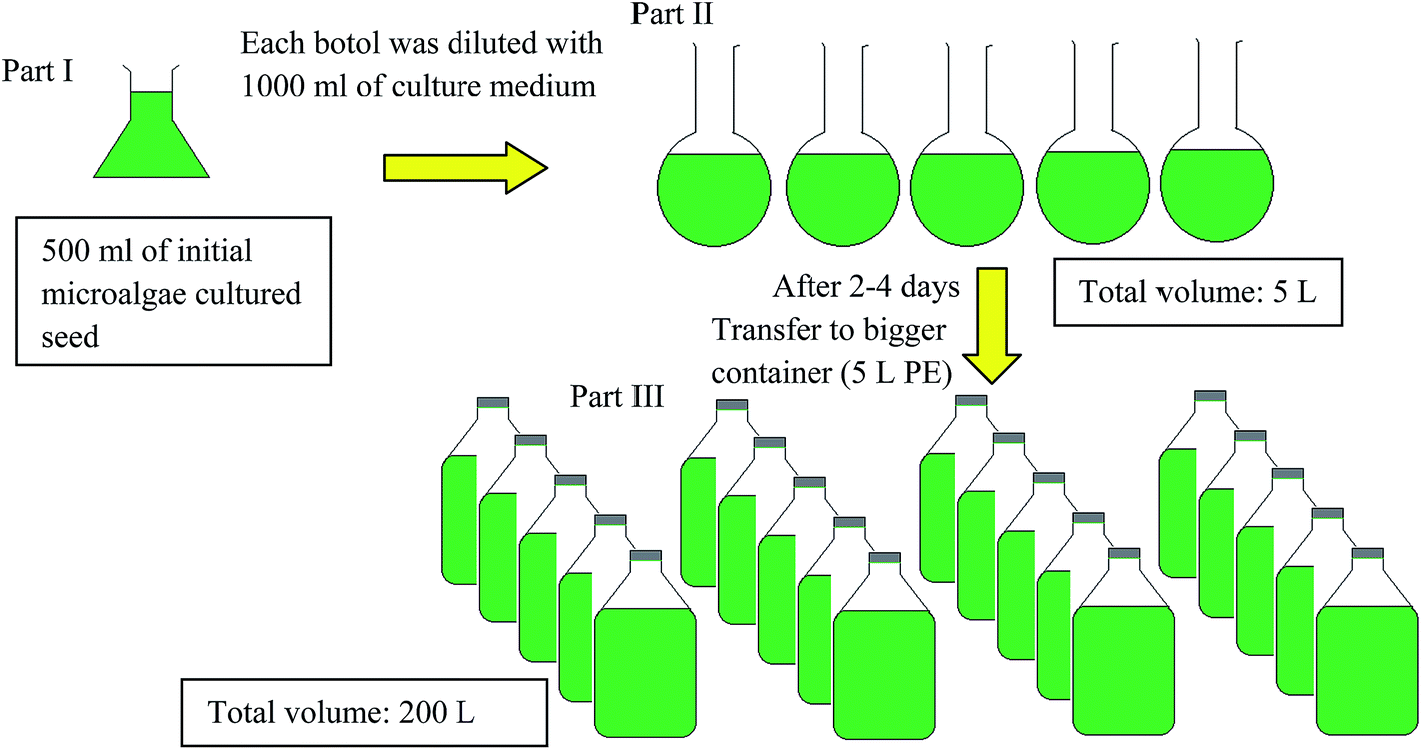
The marine microalgae N. oculata was grown under an artificial light at 60 W m−2, over a 16:8 h light/dark period at 24–28 °C. The complete cultivation procedure was stated as representation in Scheme 1. The initial 500 ml of microalgae strain (part I) was diluted with 1 L culture medium in well washed transparent glass containers and covered with aluminium foil to avoid contact from insert or any external items. Distilled water was used as solvent to dilute the chemicals needed. The culture was initially grown under laboratory conditions with culturing medium in 1 L culture medium (part II), and the dissolved carbon dioxide (CO2) concentration was controlled by increasing agitation speed and airflow. CO2, obtained directly from the environment, was used as carbon source for microalgal growth. The dense culture was further diluted with its culture medium until the volume has reached 5 L PE containers (total volume of 200 L) in enriched f/2 medium (part III) after 3–4 days. The strain must constantly agitate for 14 days (one cycle) because of the ease of sediment build-up which hinders growth. On the 14th day of culture, the remaining solution from the cultivation was discarded and harvested.
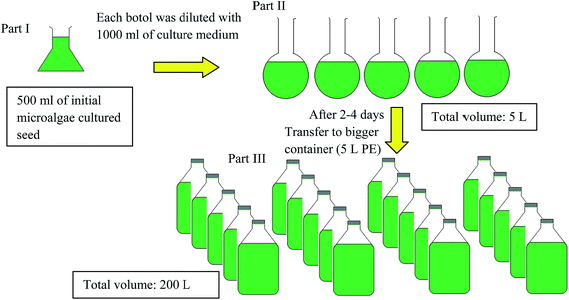 |
| | Scheme 1 Schematic diagram of photoautotrophic cultivation of Nannochloropsis. | |
2.3. Harvesting
Microalgae biomass was harvested by using cell flocculation. The partial dry matter was washed thoroughly with distilled water to reduce the salt content and dewatered via vacuum filtration. Consequently, the paste (about 80% of moisture content) was dried and triturated for overnight. The dried microalgae were kept in the desiccator to avoid contamination.
2.4. Lipid extraction
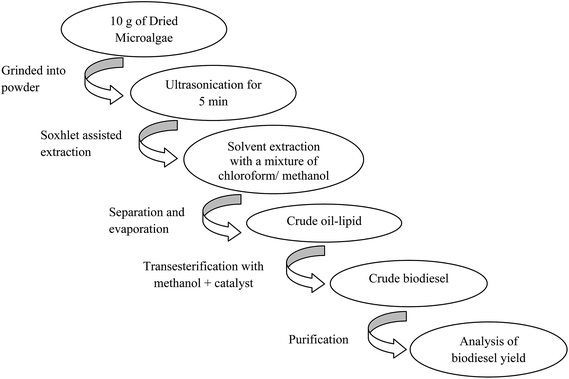
Crude oil was extracted from dried microalgae powder using a mixed chloroform–methanol (2:1 v/v) in a soxhlet extractor system. Prior to the extraction, dried microalgae powder was sonicated in a sonicator (S60h Elmasonic) for 5 min. Then, the microalgae paste was extracted thoroughly in soxhlet extractor. The extracted lipid was separated from the microalgae powder by filtration and solvent was removed using rotary vacuum evaporator at 40 °C. The black color lipid was labelled “crude oil” and then stored in the freezer.
2.5. Characterization of dried microalgae and crude lipid
2.5.1. Gravimetric analysis. Lipid content of N. oculata was evaluated using a modified Bligh and Dyer method.21 10 g of dried microalgae stirred homogenise in a mixture solvent (deionized water:chloroform:methanol = 0.5:1:2 v:v:v) for 2 h. The mixture was added with chloroform to produce mixture volume ratio of 0.5:1:1 (H2O:CHCl3:MeOH) and then stirred for 30 min. Moreover, addition of deionized water (1:1:1 = H2O:MeOH:CHCl3) was putted in the mixture and another 1 h stirring to homogenize the mixture solution. The extracted mixture was leaved for overnight and filtered through vacuum filter. Then, the residue was extracted several times with 15 ml of CHCl3:MeOH (2:1 v:v) until colour being removed from the algae paste. MeOH:H2O was added again to the extract to return the volume ratio to 1:1:1 (v:v:v) and separated in a separating funnel. Next, 0.5 g of NaCl was added to break the emulsion. The aqueous phase was washed 3 times with 10 ml aliquots of chloroform. The organic layer and aliquots were combined and then, the solvents were evaporated using rotary evaporator. Lipid fraction was weighted and assigned as the total lipid content. Then, crude lipid fraction was obtained with hexane extraction from total lipid fraction. Lastly, the crude lipid was filtered via activated carbon to acquiesce the neutral lipid fraction. All extraction was carried out in triplicate and the percentage of mass was calculated. Finally, the percentage of FFA and TGA were evaluated using conventional method.22
2.5.2. Elementally analysis. The total carbon, hydrogen and nitrogen in dried microalgae and biodiesel were determined using CHNS Analyzer model LECO TruSpec. For this analysis, 2 mg of dried microalgae were weighed and placed into a tin capsule. The combustion temperature in oven was 1100 °C.
2.5.3. Gas chromatography-mass spectrometric analysis. According to a typical sample preparation method,23 about 0.05 g crude lipid was initially converted into FAME form by refluxing with 10 ml methanolic sodium hydroxide in round bottom flask for 4 h. The reaction mixture was then shaken vigorously with 2 ml of hexane in a vortex mixer. The clear, separated methyl ester layer was injected into Shimadzu GCMS-QP2010 Plus (GC-MS). Fatty acid profile was analysed with a GC-2010 series gas chromatograph equipped with flame ionization detector and coupled to a mass spectrometer. A HP-5 column was used with He as a carrier gas. The oven temperature is isothermal at 320 °C and the injector and detector temperature was set to 280 °C. Molecular weight (MWoil) of microalgae oil was calculated using the following correlation (eqn (1)):| | |
MWoil = [(3 × MWfatty acid) + MWglycerol] − 3 × MWwater
| (1) |
2.6. Natural sand dollar catalyst preparation
Waste sand dollars (WSD) were soaked several times in warm chlorine bleach solution and water in order to obliterate any germs and other undesirable material. Then, it was brushed to remove the attached impurities and sands. Subsequently, the clean sand dollars were dried under sunlight for 2 days. The dried sand dollars were grounded with mortar into fine powder and sieved through a 0.8 mm sieve mesh. The material, referred to as WSD was calcined furnace at 800 °C for 6 h (based on the TGA result) with the ramp at 5 °C min−1 under open air. The catalyst were kept in sample bottle and stored in desiccators for future use. The obtained calcined solid product denoted as CSD.
2.7. Catalyst characterization
In order to assess the calcination temperature on waste sand dollar, thermogravimetric analysis (TGA) was performed using a Mettler Toledo thermogravimetric analyzer under nitrogen atmosphere (50 ml min−1), from 30 °C to 1000 °C with an increasing temperature rate of 10 °C min−1. X-ray diffraction analysis (XRD) was employed to identify the crystallography of the catalysts. The analysis was performed with Shimadzu diffractometer model XRD6000, and CuKa radiation (2.7 kW and 30 mA) with wavelength (λ) of 1.54 Å. The analysis was performed at 2θ ranging from 10°to 80°at a scanning speed of 0.02° and count time 1 s. Likewise, the average crystallite sizes were calculated from the peaks of the diffraction peaks employing Debye–Scherer's equation (eqn (2)).24| | |
t = (0.89λ)/βhklcosθhkl
| (2) |
Functional groups were determined using attenuated total reflection-Fourier transform-infrared (ATR-FTIR) on a PerkinElmer (PC) Spectrum 100 FTIR spectrometer in a wavelength of 400–4000 cm−1 at a resolution of 4 cm−1. Inductively coupled plasma-atomic emission spectrometer model Perkin-Elmer Optima 2000 DV was used to determine the concentration of trace metals in the solution.
The total basic site of the catalysts was determined using temperature programmed desorption of CO2 using Thermo Finnigan TPDRO 1100. This was carried out in a quartz tube packed with 50 mg of the sample. Pretreatment was done in nitrogen gas flow (20 ml min−1) at 250 °C for 10 min (10 °C min−1). The initial treatment was carried out with flow of CO2 (flow rate of 30 ml min−1) for 1.5 h and cooled down to 50 °C. The nitrogen gas flow (20 ml min−1) was again introduced for 30 min in order remove excess CO2 which presents in the system. Then, desorption of the chemisorbed CO2 was performed by flushing with helium gas flow (30 ml min−1) which acts as carrier gas over a temperature range of 50–900 °C (10 °C min−1).
The surface morphology of the developed catalyst was determined using variable pressure scanning electron microscopy (VPSEM) at 15 kV (model JEOL JSM-6400 SEM). The catalysts powder were dispersed well on the sticky carbon tape, then were coated with Au (gold) for protecting the induction of electric current using a BIO-RAS Sputter Coater.
2.8. Optimization and product analysis
The crude algae lipid as extracted from dried algae powder using soxhlet assisted solvent extraction method as shown in (Scheme 2). The transesterification reaction was performed in a micro batch reactor. A mixture of methanol and catalyst at a designated amount in a 10 ml round bottom flask equipped with a reflux condenser was preheated at 65 °C, and then 1 g crude lipid extracted from N. oculata was added. Variables optimization was performed such as methanol to lipid molar ratio (15–90 molar ratios), different reaction time (1 h and 6 h), reaction temperature (40 °C and 100 °C) and varied concentration of powder catalysts (0–20 wt%). The reaction mixture was filtered to remove the catalyst and solid particles. Then, biodiesel yield was analysed with GC after removal of excessive amount of methanol.
 |
| | Scheme 2 Transesterification schemes for N. oculata derived biodiesel. | |
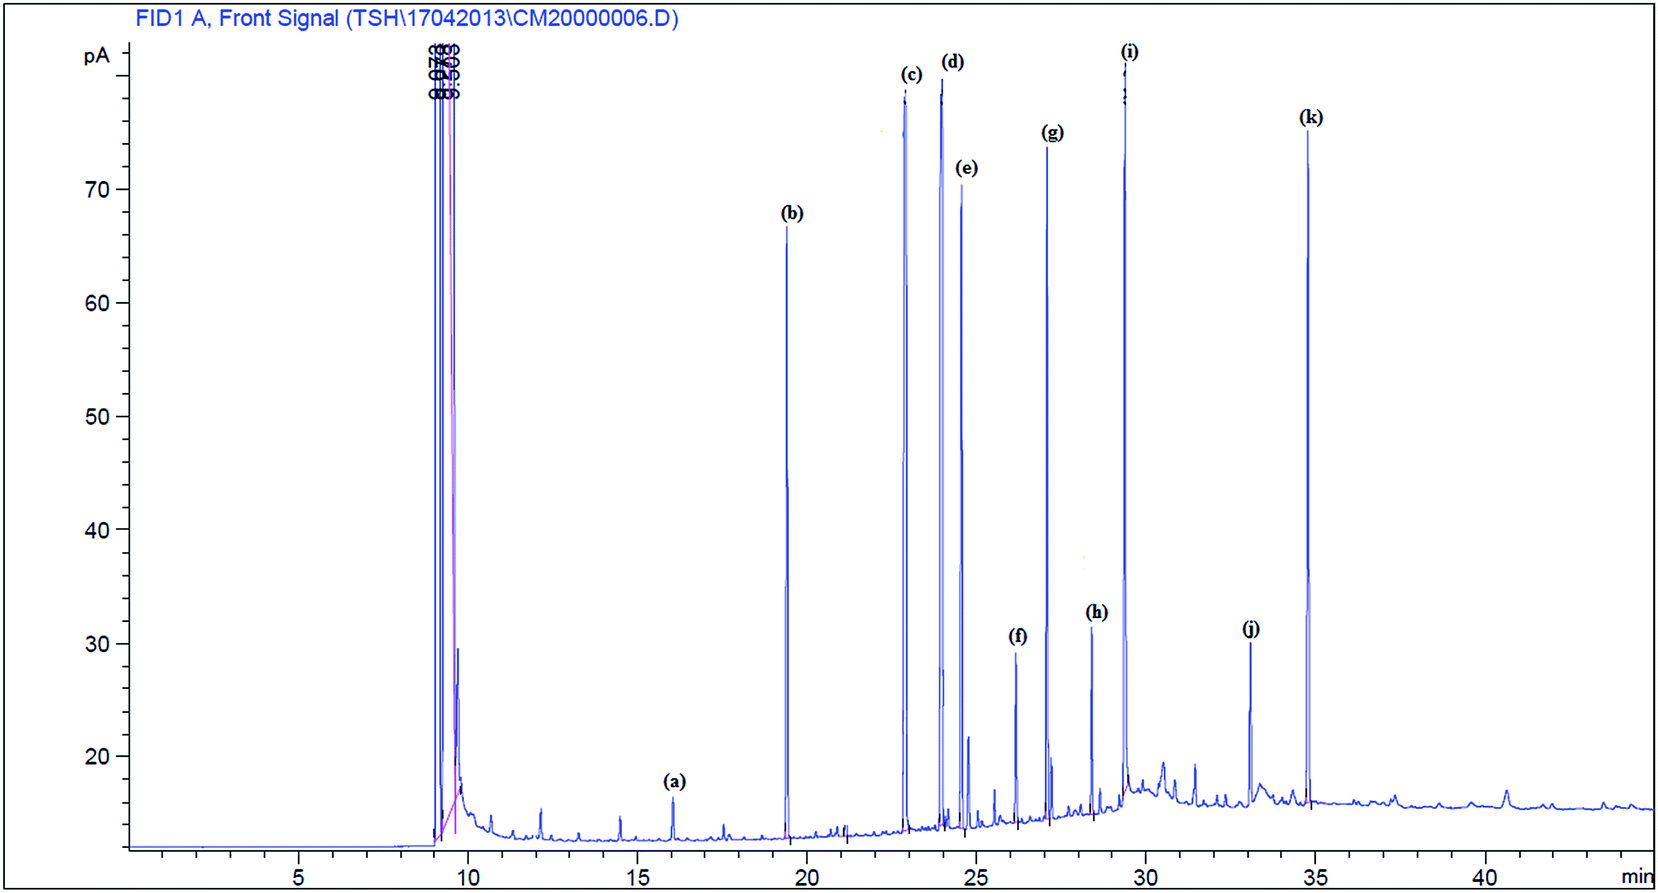
The methyl ester yield was calculated from its content in biodiesel as analysed by gas chromatography (GC) (Agilent technologies 7890A) with flame ionization detector (FID) and a fused silica capillary HP-88 column (300 m × 0.25 mm i.d., 0.20 μm film thickness) from Agilent (USA). The oven temperature was set at 140 °C and held for 5 min, raised to the final temperature at 240 °C at rate of 4 °C min−1 and held for 15 min. The sample size injected was 1 μl; with helium as the carrier gas, flew at rate of 1 ml min−1. The methyl esters in the sample were identified by comparing their retention times with the reference standard components of FAME mixture. Methyl heptadecanoate was used as an internal standard and hexane was used as a solvent. The gas chromatogram of the biodiesel product was shown in Fig. 2. The FAME content was determined in agreement with European regulated procedure EN 14103 (ref. 25) using the equation below (eqn (3)). All values reported were the average of three measurements, and the errors of % FAME contents were typically within ±2.0 wt%.
| |
 | (3) |
 |
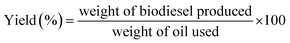
| | Fig. 1 Gravimetric analysis and lipid fraction diagram of the lipid content of N. oculata showing total lipid, crude lipid, and neutral lipid composition. | |
2.9. Reusability test
Reusability of catalyst was studied by collecting the remaining solid after each reaction. The mixture solvents were discarded without removing the catalyst from the microreactor, the amount of crude lipid and required volume of methanol were added to the microreactor. Then, the reaction was carried out under optimized conditions.
3. Results and discussion
3.1. Characterization of dried biomass and lipids from of N. oculata
3.1.1. Lipid content measurement. The total lipids fraction comprised phospholipids, glycolipids, pigments and neutral lipids. Meanwhile, crude lipids fraction included pigments and neutral lipids (free alcohols, triarylglycerides, sterol esters, hydrocarbons, wax, sterols and free fatty acids).25 The lipid compositions from N. oculata is revealed in (Fig. 1) with 25.8 ± 4.5% of total lipids, 18.5 ± 1.8% of crude lipids and 12.8 ± 2.6% of neutral lipids. Neutral lipids comprised approximately 48% from the cultivated microalgae. 50% of neutral lipids presences in N. oculata have been reported by Krohn et al.26 A small fraction of free fatty acid (FFA) and triglyceride (TAG) presence in neutral lipid suitable for biodiesel production as shown in Fig. 1. Therefore, TAG and FFA should be taken into account rather than total lipid content for producing EN 14103 and ASTM grade biodiesel.
3.1.2. Elemental analysis of dried microalgae and biodiesel. Table 1 shows the elemental analysis results of microalgae. The nitrogen content (0.6%) in dried N. oculata was correlated to its protein content.27 Then, carbon content was suggested due to carbon storage products such as carbohydrates, fatty acids and lipids. Meanwhile, the high content of carbon also suggested that N. oculata having high capacity of carbon setting, which could suggest that the biodiesel derived from microalgae will be an eco-friendly biofuel. However, hydrogen content was low compared to carbon content which suggested the presence of eicosapentaenoic acid (EPA).28
Table 1 Content of dried N. oculata microalgae, biodiesel products (a), fatty acid compositions of crude lipid based methyl esters (b), FFA and TAG (c)
| (a) |
| Material |
Elemental composition (%) |
| C |
H |
N |
Oa |
| Calculated by difference. |
| Dried microalgae biomass |
41.4 ± 0.11 |
7.8 ± 0.05 |
1.8 ± 1.02 |
49.0 ± 0.33 |
| Biodiesel obtained |
65.5 ± 0.25 |
7.1 ± 0.25 |
0.9 ± 0.42 |
25.5 ± 0.36 |
| (b) |
| Substituent |
Content (%) |
Fatty acid in lipid |
C |
Content (%) |
| Saturated lipid |
50.52 ± 0.17 |
Myristic acid |
14:0 |
7.69 ± 0.52 |
| Palmitic acid |
16:0 |
35.43 ± 0.06 |
| Stearic acid |
18:0 |
2.50 ± 0.26 |
| Monounsaturated lipid |
Palmitoleic acid |
16:1 |
27.54 ± 0.15 |
| Oleic acid |
18:1 |
8.62 ± 0.02 |
| Polyunsaturated lipid |
Linoleic acid |
18:2 |
5.22 ± 0.23 |
| Arachidonic acid |
20:4 |
2.47 ± 0.05 |
| EPA |
20:5 |
8.29 ± 0.08 |
| DHA |
22:6 |
2.24 ± 0.16 |
| Moisture |
5.47 ± 0.04 |
— |
— |
— |
| Dried ash |
10.68 ± 0.32 |
— |
— |
— |
| Others |
33.33 ± 0.05 |
— |
— |
— |
| (c) |
| Substituent |
Content (%) |
| FFA |
8.03 ± 0.31 |
| TAG |
95.12 ± 0.19 |
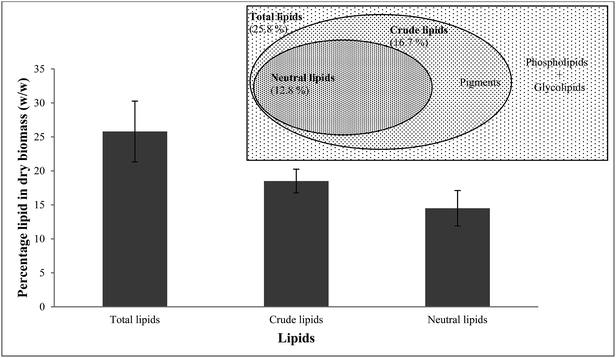
3.1.3. Lipid extraction and fatty acid composition. In this current work, Bligh and Dyer method with slightly modification was use to extract the highest lipid amount. In this case, mixture of CHCl3 and CH3OH (2:1, v:v) is suitable to extract lipid from N. oculata microalgae. This is because these combinations of chemical solvents provide high selectivity and solubility towards lipid, especially for microalgae lipid containing mainly polar unsaturated fatty acid compounds.23 The content of fatty acid compositions from N. oculata was given in Table 1. The unsaturated fatty acids components, namely palmitoleic acid (C16:1), oleic acid (C18:1), and EPA (C20:5), were the main components in the N. oculata. The high concentration of triglycerides, as evident from molecular weight (831.62 g mol−1) measurement, indicating a suitable feedstock for the production of FAME (biodiesel) (Fig. 2).
Table 2 Metal content and crystallinity of catalysts
| Catalysts |
Crystallize sizea (nm) |
Ca/Mg ratio |
| CaO |
MgO |
| Calculated by Debye–Scherer's equation. |
| CSD |
64.3 ± 3.55 |
54.4 ± 3.18 |
9.91 |
| CaO |
66.3 ± 3.12 |
— |
— |
| MgO |
— |
15.9 ± 4.16 |
— |
 |
| | Fig. 2 A typical GC chromatogram of N. oculata derived biodiesel. (a) Methyl laurate, (b) methyl myristate, (c) methyl palmitate, (d) methyl palmitoleate, (e) internal standard, (f) methyl stearate, (g) methyl oleate, (h) methyl linoleate, (i) methyl arachidate, (j) methyl behenate, (k) methyl eicosapentaenoate. | |
3.2. Catalyst characterization
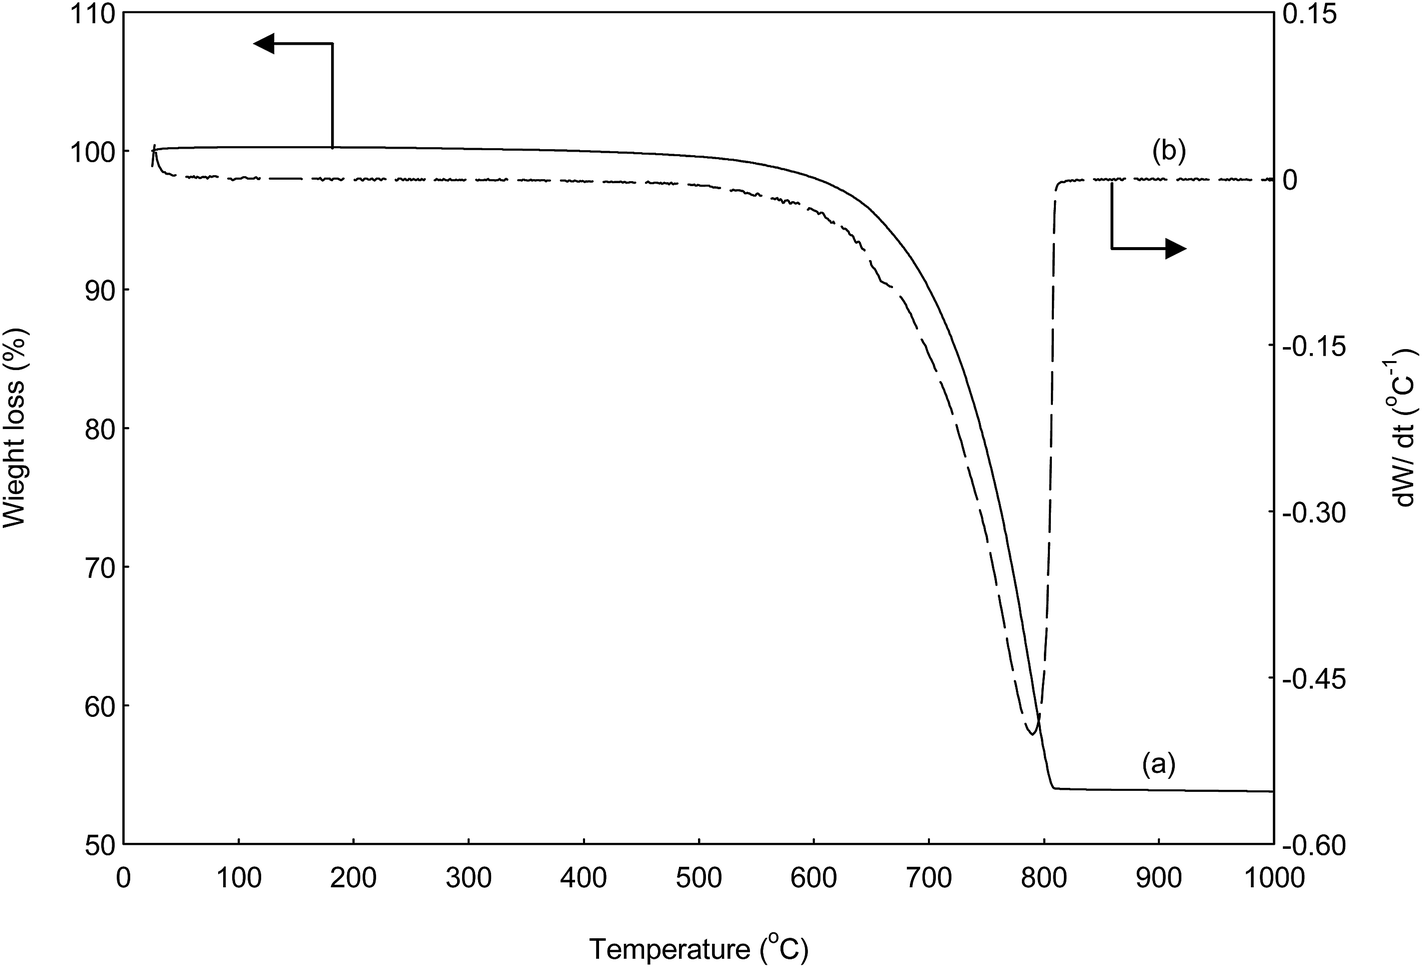
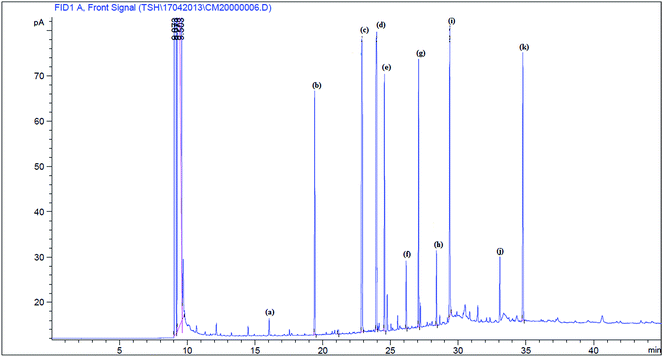
3.2.1. Thermal decomposition. The thermal decomposition of WSD shown in Fig. 3. The first state can be attributed to an insignificant of weight loss over 220 °C to 250 °C because of small amount of chemisorbed water or crystal water molecules. For second state, the DTA curve shows two peaks (Fig. 3b). The small DTA peak at 650 °C was due to release of partially CO2 form dolomite. The weight loss of 45.6 wt% at 788 °C could be attributed to the evolution of CO2 from CaCO3, as evident from XRD and the FTIR results (Fig. 4 and 5). The results were consistent with work reported by Hashimoto et al.29 The resulting products during thermal decomposition of sand dollar could be as following (eqn (4) and (5)).| | |
2CaMg(CO3)2 → 2MgO–CaCO3 + 2CO2
| (4) |
| | |
MgO–CaCO3 → MgO–CaO + CO2
| (5) |
 |
| | Fig. 3 TGA (a) and DTA (b) curves for the dried WSD catalyst. | |
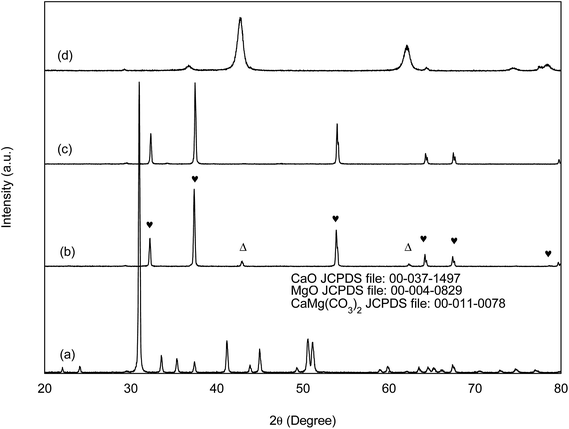 |
| | Fig. 4 XRD characteritize patterns of WSD and CSD (a and b), CaO (c) and MgO (d) catalysts. ♥, Characteristic peak of CaO; Δ, characteristic peak of MgO. | |
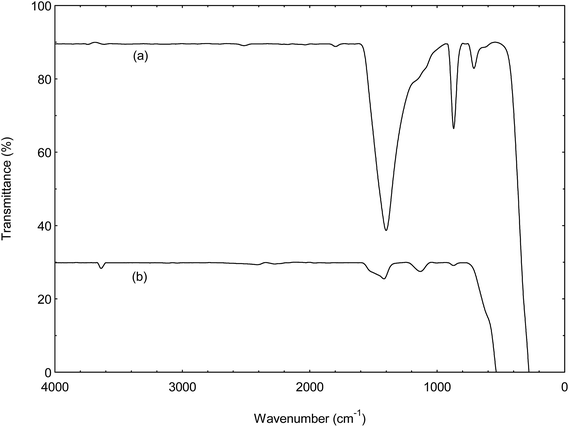 |
| | Fig. 5 FTIR spectra of WSD and CSD (a and b) catalysts. | |
3.2.2. Structure of catalyst. The catalysts were further probed by X-ray diffraction analysis (Fig. 4). The structure of the catalyst was compared with the commercial CaO and MgO. At first, the composition of WSD is crystalline CaMg(CO3)2 phase (JCPDS File no. 00-011-0078) (Fig. 4a). The new crystalline phases (Fig. 4b) appeared at 800 °C can be assigned to highly crystalline CaO phase (JCPDS file no. 00-037-1497) 2θ at 32.2°, 37.3°, 53.8°, 64.1°, 67.3°, and periclase structure MgO phase JCPDS file no. 00-004-0829: 2θ at 42.8° and 62.3° appeared, respectively. No detection of carbonate matter in the diffraction pattern at 800 °C is well agreement with TGA results (Fig. 4b). Simultaneously, this finding was suggested that waste sand dollar is a naturally occurring mixed metal oxide of calcium and magnesium which is different from other shell such as mollusc shell and eggshell which only consist of CaCO3 phase.29,30The crystallite sizes of the catalysts were calculated and summarized in Table 2. The average crystallite sizes of CaO phase from CSD and CaO catalysts were 64.3 and 66.3 nm, respectively. Whereas, the average crystallite size of MgO phase in CSD catalyst was significantly increased to 54.4 nm as compared to only 15.9 nm for pure MgO, which may due to the compact agglomeration as in agreement with the results shown un SEM micrograph (Fig. 7a).
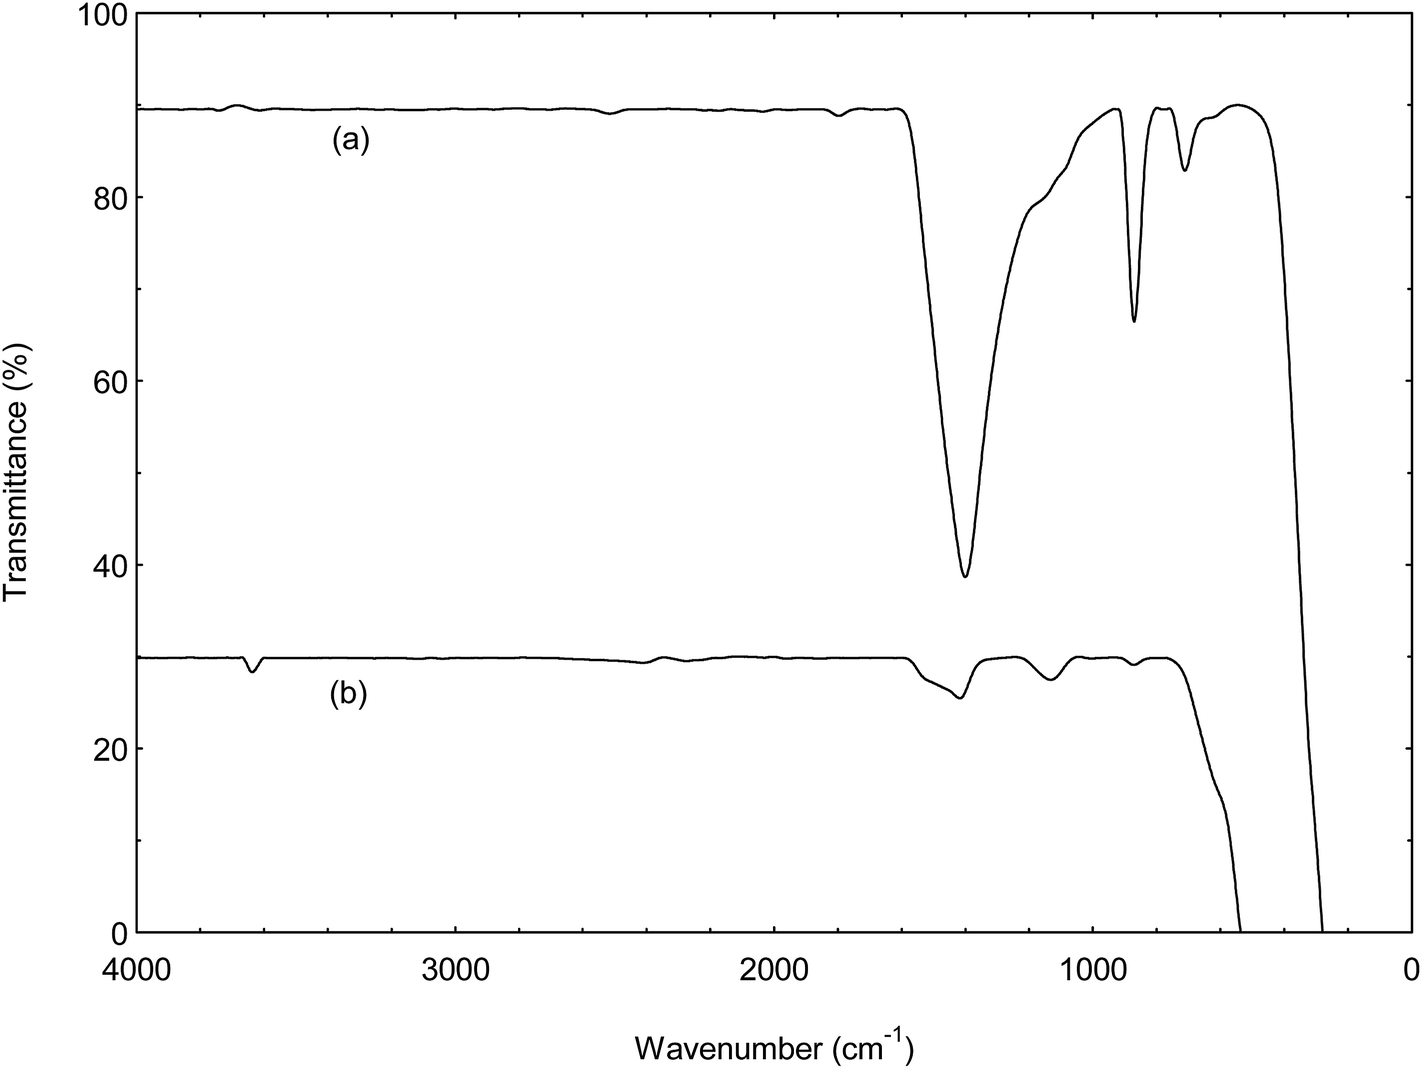
3.2.3. Functional group of catalyst. Fig. 5a showed the IR spectra of WSD and CSD. The insignificant transmission band at approximately 3500 cm−1 can be attributed to OH streaching vibration from physisorbed moisture. This was in agreement with the result from TGA analysis (Fig. 3). The C–O stretching vibration gave sharp peak at 1400 cm−1 and peak at 871 cm−1 corresponding to C–O out of plane bending shown the presence of carbonate functional groups. This indicated the WSD was Ca(CO3)2 and MgCO3 which was in agreement with the TGA result (Fig. 3). Upon calcinations (Fig. 5b), loss of C–O stretching vibration peak at CSD suggesting that the conversion of CaMg(CO3)2 to oxide of Ca and Mg, respectively.
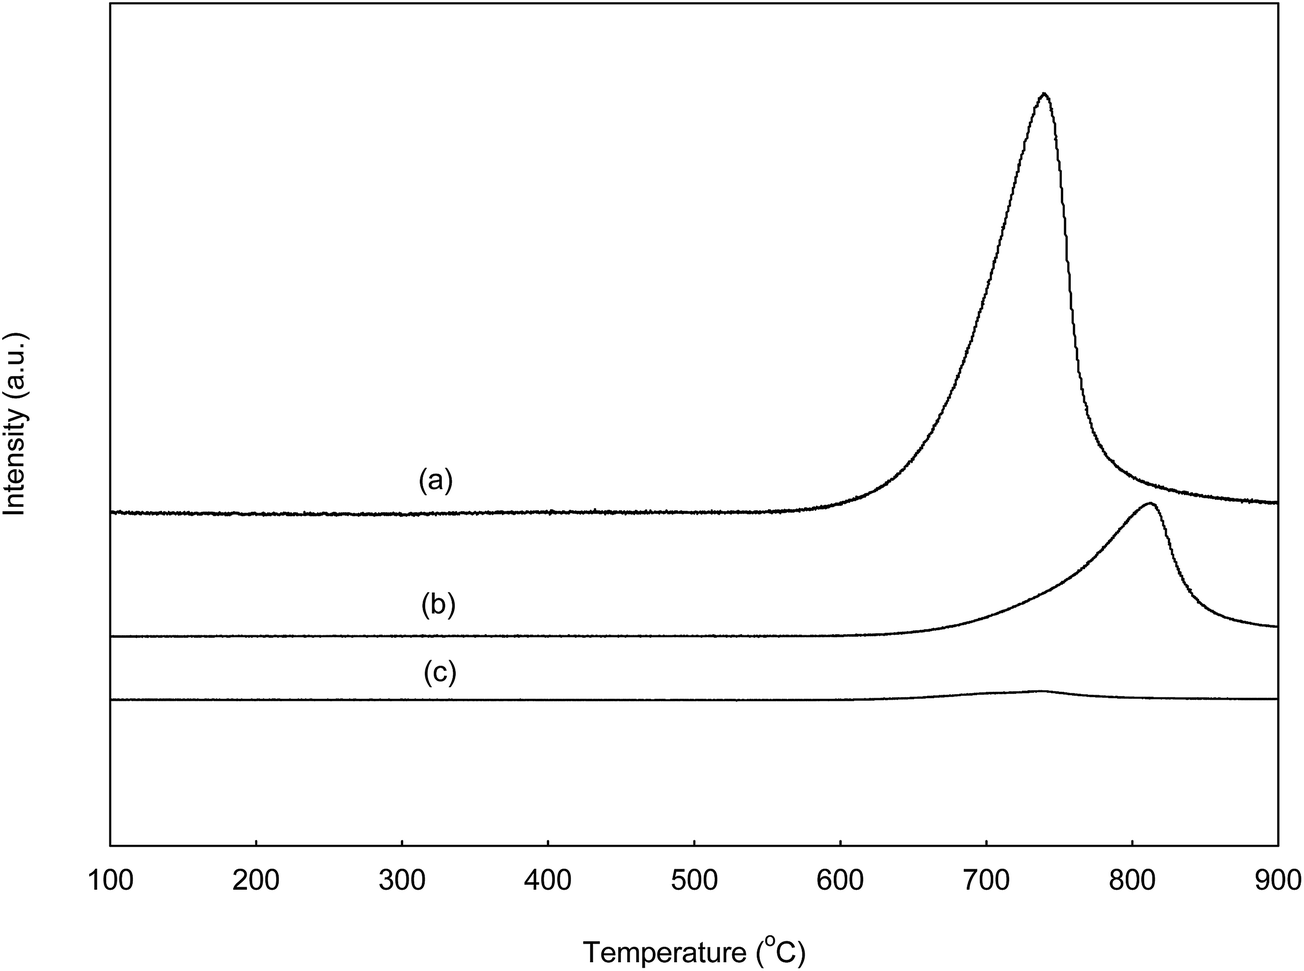
3.2.4. Basicity. The basic site distributions and amount of basicity for catalysts were showed in Fig. 6 and Table 3, respectively. The desorption peak at 788 °C assigned to the strong basic site, whereas the MgO showed only a small weak desorption peak with strong basic site at 723 °C.
 |
| | Fig. 6 TPD-CO2 profiles of CSD (a), CaO (b) and MgO (c) catalysts. | |
Table 3 Total basicity of CSD, CaO and MgO catalysts
| Catalysts |
CO2 desorbed (μmol g−1) |
Temperature range (°C) |
Peak temperature (°C) |
| CSD |
3492.7 ± 0.11 |
590–860 |
739 |
| CaO |
166.7 ± 0.16 |
650–830 |
788 |
| MgO |
20.5 ± 0.13 |
625–780 |
723 |
The narrower band at high temperature between 620 °C to 830 °C corresponds to the stronger basic site presence in the CSD catalyst reported by Serio et al.31 The basic strength distribution on CSD, CaO and MgO are single-modal which is uniform and maximised at 739, 788 and 723 °C, respectively. The results revealed that the CaO possessed higher base strength compared to CSD and MgO catalyst. Nevertheless, CSD catalyst gave highest basic site density with desorption peak at 739 °C and desorption volume of CO2 equal to 3492.7 μmol g−1 as compared to the two commercial catalysts as illustrated in Fig. 6b and c. The electrons transfer during the strong interaction MgO and CaO suggesting the presence of super basic site in the catalyst.32
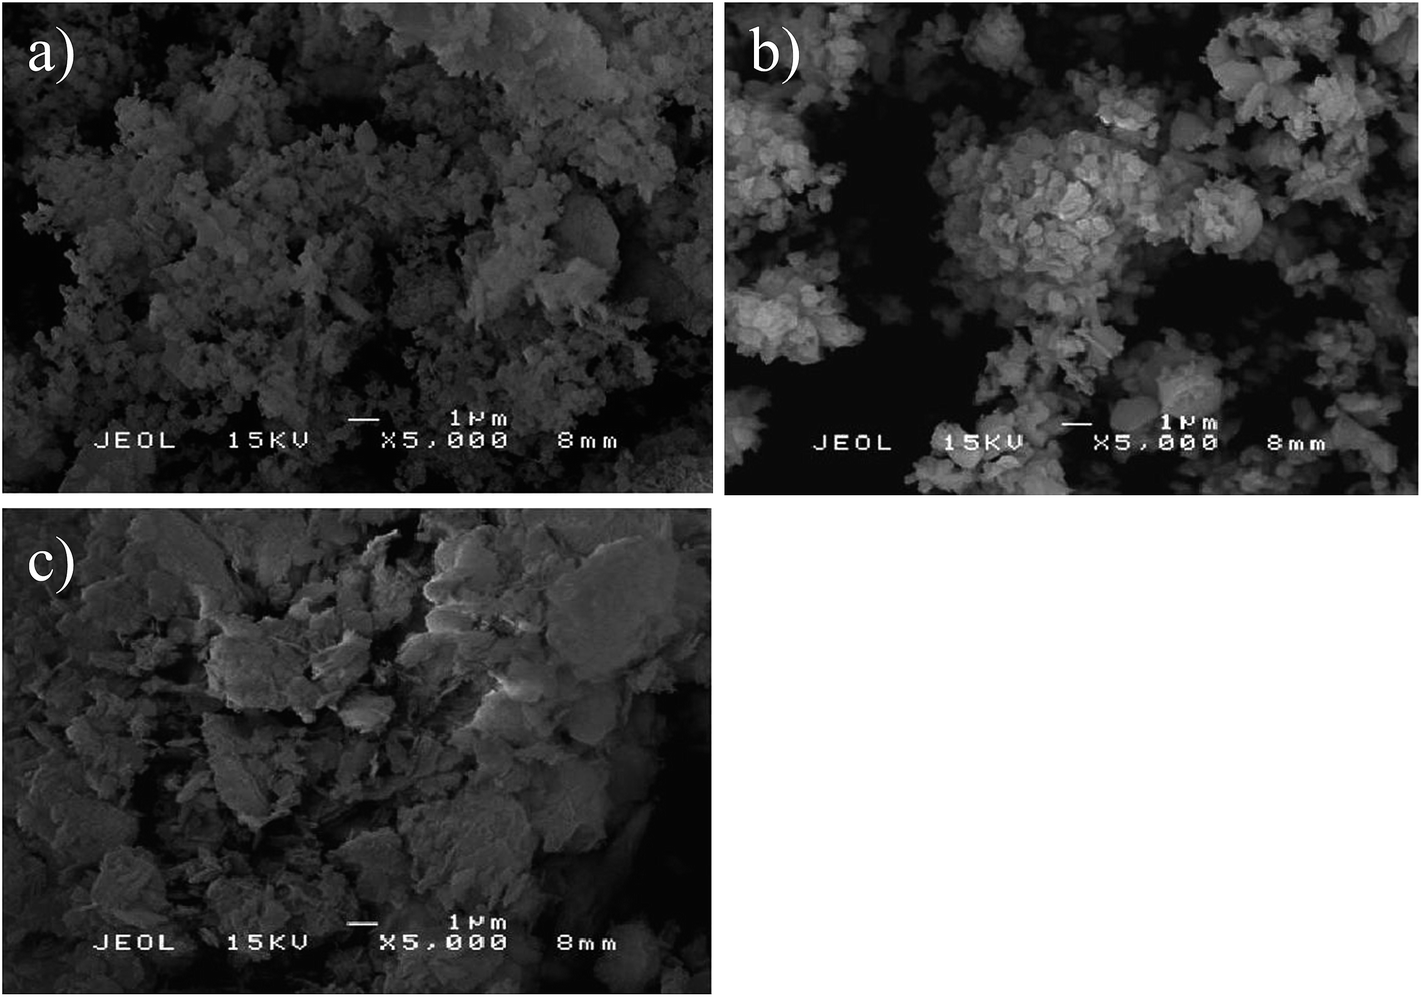
3.2.5. Morphology. Fig. 7 shows the SEM micrograph for CSD, CaO and MgO catalysts. The particle of CaO and MgO catalysts (Fig. 7b and c) were build of aggregates of cubic crystal and hexagonal shaped flakes, respectively. However, for CSD (Fig. 7a), the image illustrated mixture of CaO–MgO appeared as dense particles with compact agglomeration form of particles. The high content CaO presence in the agglomerated CSD catalyst was confirmed by XRD and ICP-AES analyses (Fig. 4b and Table 2).
 |
| | Fig. 7 SEM micrographs of CSD (a), CaO (b) and MgO (c) catalysts. | |
3.2.6. Bulk chemical composition of catalyst. The bulk compositions of the catalysts were calculated using the data obtained from the ICP-AES analysis. Interestingly, the experimental Ca/Mg ratio for CSD catalyst is 9.91. Therefore, Ca-rich phases of CaO–MgO containing catalyst that makes it possible to be use as an excellent catalyst for transesterification process.
3.3. Effect of transesterification parameters on N. oculata biodiesel yield
3.3.1. Methanol to oil molar ratio. The methanol/lipid molar ratio was varied in this study higher than the stoichiometric ratio according to the work reported by Islam et al.24 The effect of methanol/lipid molar ratios on the FAME yield was shown in Fig. 8. FAME yield was found to increase from 13.4 to 89.2% with increasing methanol/lipid from 15:1 to 60:1. Additional increase methanol/lipid ratio up to 90:1 did not increase the FAME yield but descended at higher weight ratio. The presence of excess methanol in transesterification was essential to homogenize the high viscosity of the microalgae crude lipids. A similar conclusion has been reached by Ramadhas et al.33 and Akoh et al.34 who reported that the methanol volume should be limited to approximately 45 ml to promote high conversion efficiency.
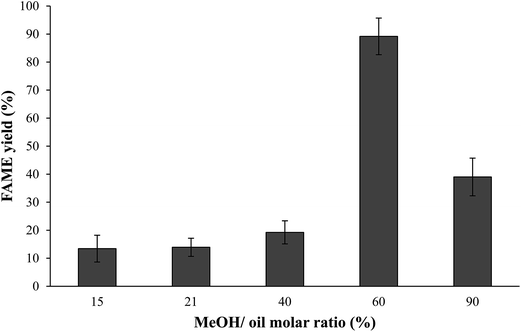 |
| | Fig. 8 Effect of methanol/oil molar ratio on the % FAME: catalyst (3 wt%); reaction time (3 h); reaction temperature (60 °C). | |
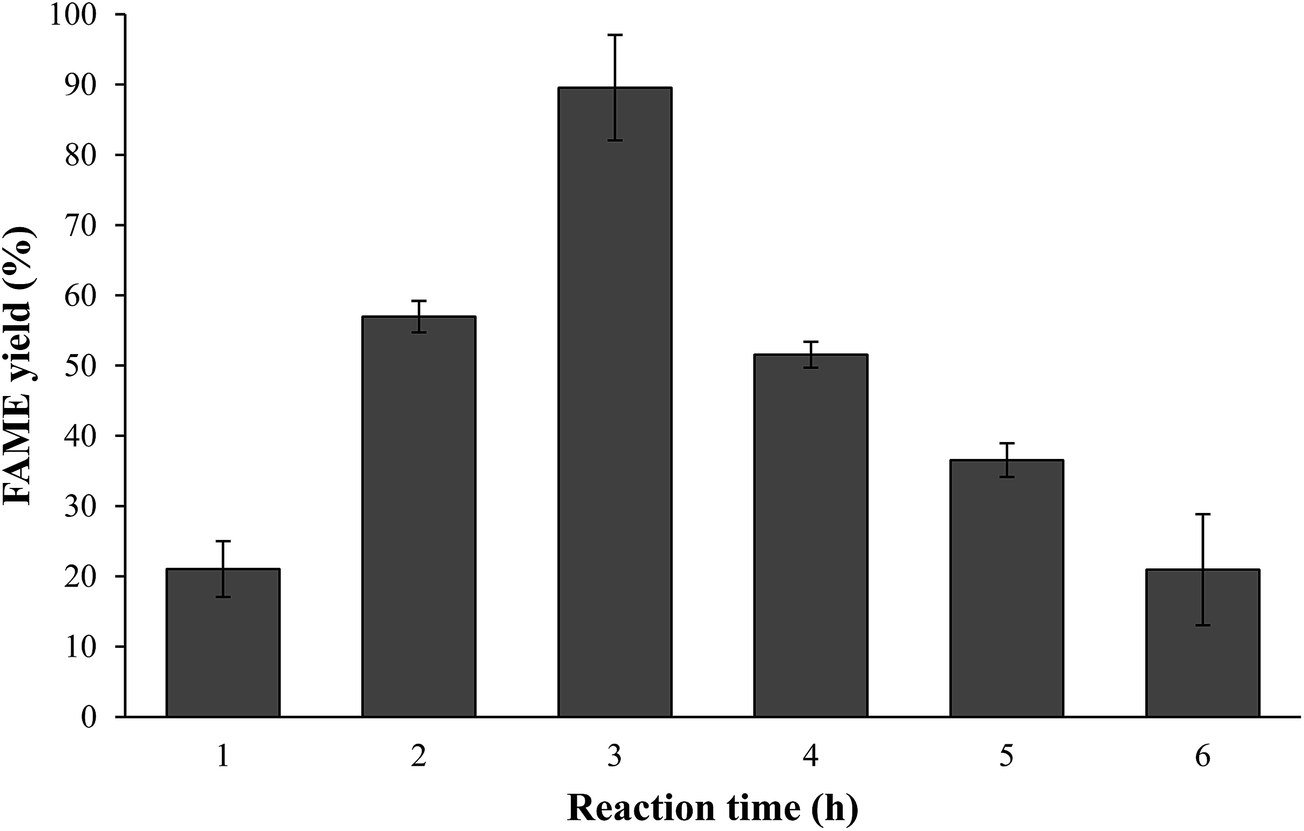
3.3.2. Reaction time. Reaction time was the significant factor that affects the heterogeneously catalyzed transesterification reaction rate due the presence of three immiscible phases (oil–alcohol–solid catalyst) at the initial stage of reaction.7 As shown in Fig. 9, FAME was reach maximum about 89.5% with 3 h of reaction time. FAME yield was reached at equilibrium with further increasing the reaction time. This observation was in agreement with the results on the biodiesel from N. oculata microalgae using calcium methoxide catalyst.18 CSD catalyst was showed to be more effective compared to Mg–Zr and sulfonated carbon catalysts which longer reaction time (4–12 h) needed to reach the maximum conversion of algae oil.12,35
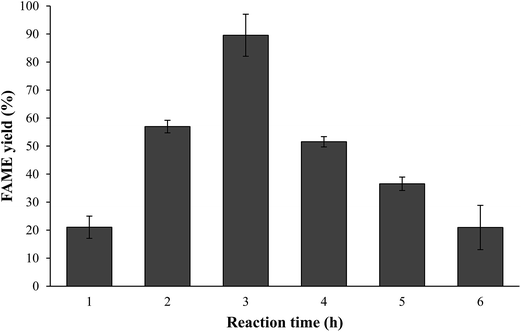 |
| | Fig. 9 Effect of reaction time on the % FAME: catalyst (3 wt%); methanol/oil molar ratio (60:1); reaction temperature (60 °C). | |
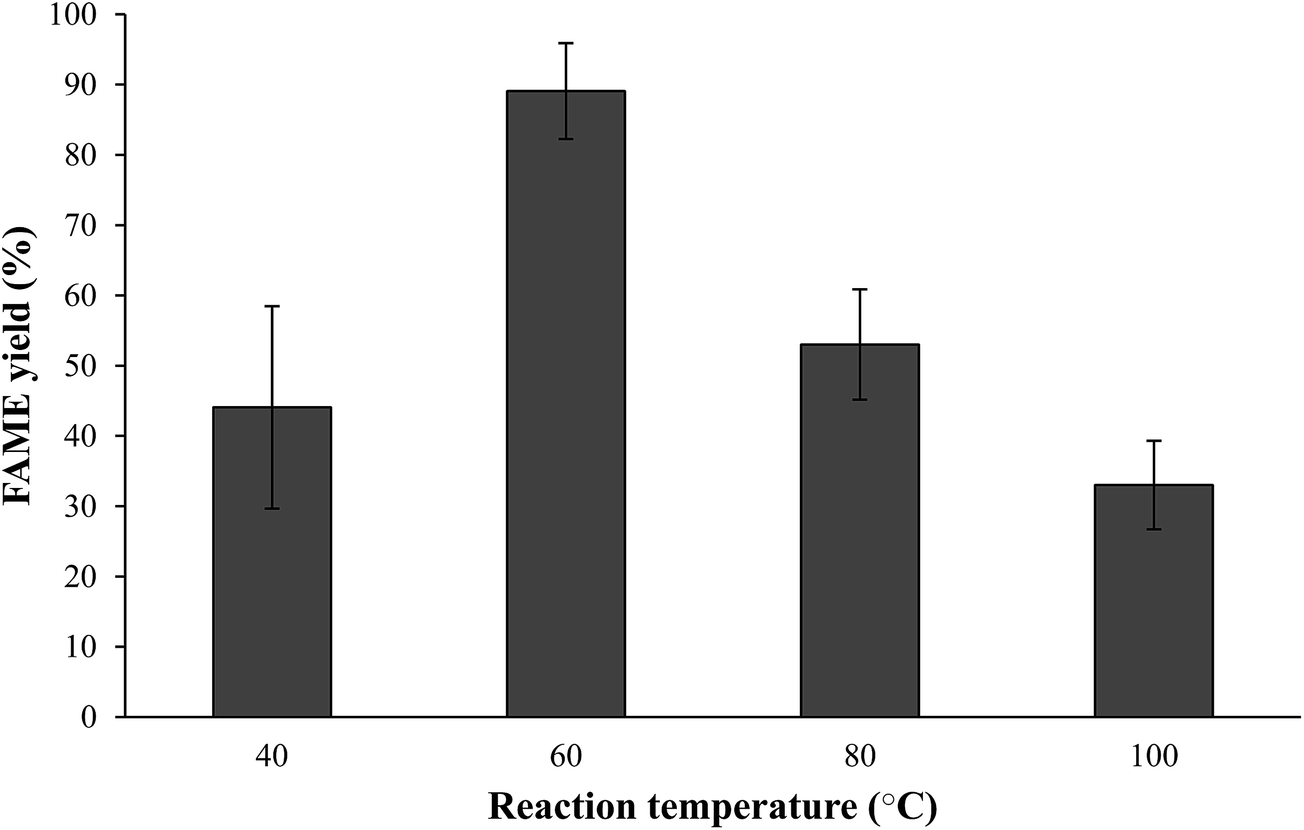
3.3.3. Reaction temperature. As shown in Fig. 10, the biodiesel yield and production rate achieved the highest value of 89.1% at 60 °C, and decreased inappreciable to 24.0% at 100 °C. This fact emphasized that the higher reaction temperature could accelerates the saponification, resulting the lower FAME yield.2,6,24
 |
| | Fig. 10 Effect of reaction temperature on the % FAME: catalyst dosage (3%); methanol/oil molar ratio (60:1); reaction time (3 h). | |
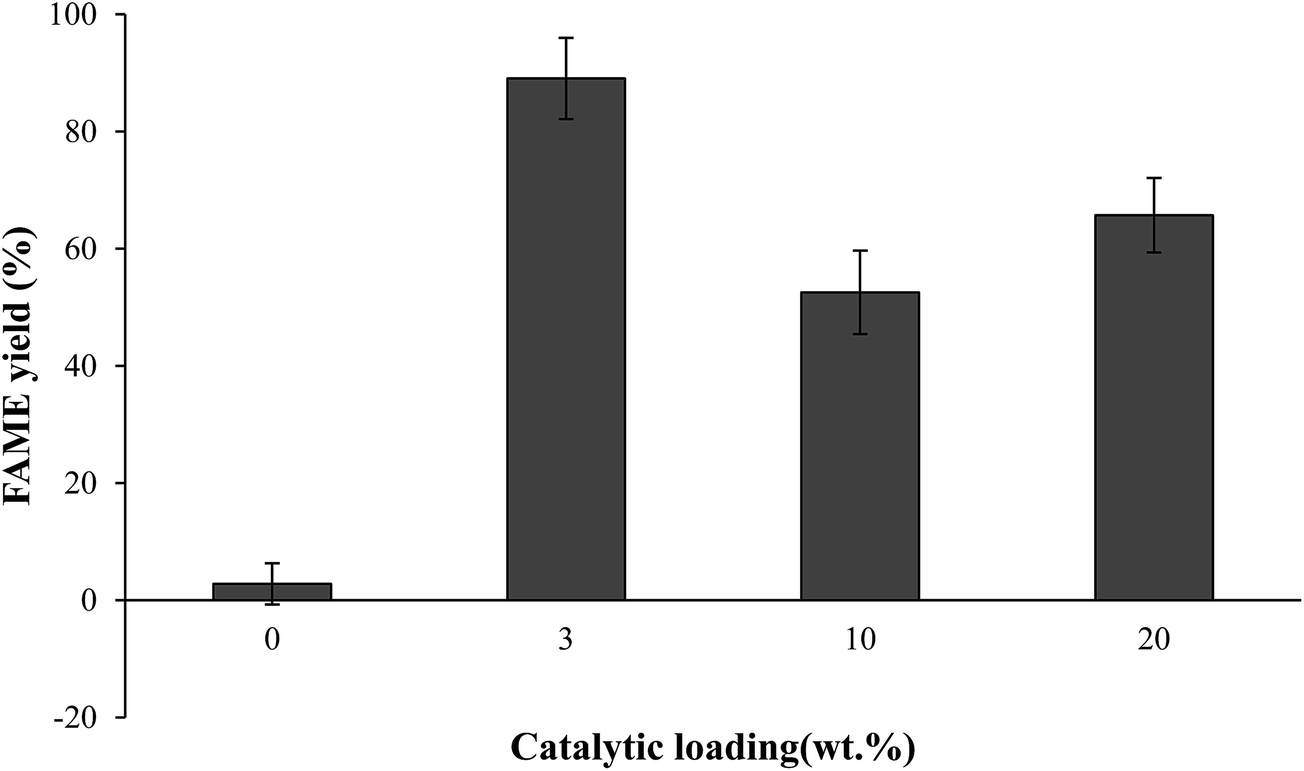
3.4. Catalyst stability and reusability
The reusability of catalysts on transesterification high level contains moisture of microalgae oil was investigated in optimum MeOH:oil:catalyst wt% (60:1:3) at 60 °C for 3 h. The spent catalysts were reused at the end of the reaction without undergone washing treatment or re-calcination as described by Umdu et al.5 Fig. 12 indicates that the catalyst can be reuse with slightly decrement in the FAME yield (74–89%), and then catalytic activity decreased through consecutive reaction cycles. This phenomenon was presumably be assigned to the block of active sites by the phospholipids come from microalgae.5,12,25,26 This deactivation of catalyst was in agreement with result from FTIR spectra of spent catalysts shown in Fig. 13. A sharp absorption band at 3639 cm−1 due to the surface of spent catalyst was covered by hydrate. The C–O stretching vibration at 1424 cm−1 became more intense for the spent catalyst. It might due to the phase transformation that reduced the active species of the catalyst. Another possible reason for declining FAME content is due to the leaching of CaO from CSD catalyst resulting the loss of the active sites from the surface of catalyst.2,6,24
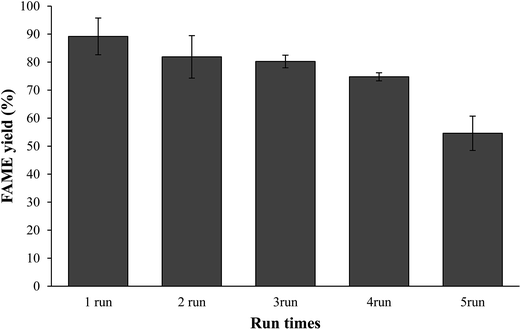 |
| | Fig. 12 Reuse and recycle test: methanol/oil molar ratio (60:1); catalyst dosage (3%); reaction time (3 h); reaction temperature (60 °C). | |
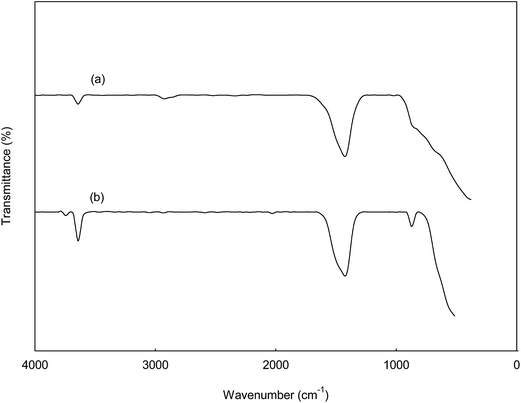 |
| | Fig. 13 FTIR spectrum of CSD (a) and spent CSD (b). | |
4. Conclusions
A solid base catalyst has been successfully developed via thermal decomposition of Clypeaster reticulatus to convert microalgae oil to biodiesel. CSD catalyst showed better catalytic performance compared to previous reported Mg–Zr (22%) and sulfonated carbon (24%) catalysts.12,35 The synthesized catalyst was able to be reused and thus creating another high efficient and fully eco-friendly catalyst source for biodiesel production from microalgae oil. The effect of catalyst properties was found greater influence on transesterification reaction. Therefore, this result indicates that the new route of synthesis has provided a sustainable way for using N. oculata microalgae derived oil for producing high quality biodiesel fuel.
References
- A. E. Atabani, A. S. Silitonga, I. A. Badruddin, T. M. I. Mahlia, H. H. Masjuki and S. Mekhilef, Renewable Sustainable Energy Rev., 2012, 16, 2070–2093 CrossRef PubMed.
- S. H. Teo, Y. H. Taufiq-Yap, U. Rashid and A. Islam, RSC Adv., 2015, 5, 4266–4276 RSC.
- U. Rashid, M. Ibrahim, S. Yasin, Y. H. Taufiq-Yap and G. Knothe, Ind. Crops Prod., 2013, 45, 355–359 CrossRef CAS PubMed.
- N. de Lima da Silva, C. Santander, C. Batistella, R. Filho and M. Maciel, Appl. Biochem. Biotechnol., 2010, 161, 245–254 CrossRef CAS PubMed.
- E. S. Umdu, M. Tuncer and E. Seker, Bioresour. Technol., 2009, 100, 2828–2831 CrossRef CAS PubMed.
- F. H. Elhassan, R. Yunus, U. Rashid, A. Islam, H. V. Lee and Y. H. Taufiq-Yap, Appl. Catal., A, 2013, 456, 182–187 CrossRef PubMed.
- M. K. Lam and K. T. Lee, Biotechnol. Adv., 2012, 30, 673–690 CrossRef CAS PubMed.
- T. M. Mata, A. A. Martins and N. S. Caetano, Renewable Sustainable Energy Rev., 2010, 14, 217–232 CrossRef CAS PubMed.
- M. Koberg, M. Cohen, A. B. Amotz and A. Gedanken, Bioresour. Technol., 2001, 102, 4265–4269 CrossRef PubMed.
- A. Richmond and W. Z. Chen, J. Biotechnol., 2001, 85, 259–269 CrossRef CAS.
- Y. Liang, N. Sarkany and Y. Cui, Biotechnol. Lett., 2009, 31, 1043–1049 CrossRef CAS PubMed.
- Y. S. Li, S. Lian, D. Tong, R. L. Song, W. Y. Yang, Y. Fan and R. W. Qing, Appl. Energy, 2011, 88, 3313–3317 CrossRef CAS PubMed.
- D. T. Tran, K. L. Yeh, C. L. Chen and J. S. Chang, Bioresour. Technol., 2012, 108, 119–127 CrossRef CAS PubMed.
- J. Boro, D. Deka and A. J. Thakur, Renewable Sustainable Energy Rev., 2012, 16(1), 904–910 CrossRef CAS PubMed.
- Z. Wei, C. Xu and B. Li, Bioresour. Technol., 2009, 100, 2883–2885 CrossRef CAS PubMed.
- P. L. Boey, G. P. Maniam and S. A. Hamid, Bioresour. Technol., 2009, 100, 6362–6368 CrossRef CAS PubMed.
- M. Koberg, M. Cohen, A. Ben-amotz and A. Gedanken, Bioresour. Technol., 2011, 102, 4265–4269 CrossRef CAS PubMed.
- S. H. Teo, A. Islam, T. Yusaf and Y. H. Taufiq-Yap, Energy, 2014, 78, 63–71 CrossRef CAS PubMed.
- J. Boro, A. J. Thakur and D. Deka, Fuel Process. Technol., 2011, 92, 2061–2067 CrossRef CAS PubMed.
- S. Sirisomboonchai, M. Abuduwayiti, G. Guan, C. Samart, S. Abliz, X. Hao, K. Kusakabe and A. Abudula, Energy Convers. Manage., 2015, 95, 242–247 CrossRef CAS PubMed.
- H. Fukuda, A. Kondo and H. Noda, J. Biosci. Bioeng., 2001, 92, 405–416 CrossRef CAS.
- N. K. Andrikopoulas, I. G. Giannakis and V. Tzamtzis, J. Chromatogr. Sci., 2001, 39, 137–145 Search PubMed.
- A. A. Arifin, J. Bakar, C. P. Tan, R. A. Rahman, R. Krim and C. C. Loi, Food Chem., 2009, 114, 561–564 CrossRef PubMed.
- A. Islam A, Y. H. Taufiq-Yap, C. H. Chu, P. Ravindra and E. S. Chan, Renewable Energy, 2013, 59, 23–29 CrossRef PubMed.
- Q. Hu, M. Sommerfeld, M. Ghirardi, M. Posewitz, M. Seibert and A. Darzins, Plant J., 2008, 54, 621–639 CrossRef CAS PubMed.
- B. J. Krohn, C. V. McNeff, B. W. Yan and D. Nowlan, Bioresour. Technol., 2011, 102, 94–100 CrossRef CAS PubMed.
- C. V. González-López, M. C. Cerón-Garcíaa, F. G. Acién-Fernández, C. S. Bustos, Y. Chisti and J. M. Fernández-Sevillaa, Bioresour. Technol., 2010, 101, 7587–7591 CrossRef PubMed.
- S. Pieber, S. Schober and M. Mittelbach, Biomass Bioenergy, 2012, 47, 474–482 CrossRef CAS PubMed.
- H. Hashimoto, E. Komaki, F. Hayashi and T. Uematsu, J. Solid State Chem., 1980, 33, 181–188 CrossRef CAS.
- N. Viriya-empikul, P. Krasae, B. Puttasawat, B. Yoosuk, N. Chollacoop and K. Faungnawakij, Bioresour. Technol., 2010, 101, 3765–7376 CrossRef CAS PubMed.
- M. Di Serio, M. Ledda, M. Cozzolino, G. Minutillo, R. Tesser and E. Santacesaria, Ind. Eng. Chem. Res., 2006, 45, 3009–3014 CrossRef CAS.
- J. I. Take, N. Kikuchi and Y. Yoneda, J. Catal., 1971, 21, 164–170 CrossRef CAS.
- A. S. Ramadhas, S. Jayaraj and C. Muraleedharan, Fuel, 2005, 84, 335–340 CrossRef CAS PubMed.
- C. C. Akoh, S. W. Chang, G. C. Lee and J. F. Shaw, J. Agric. Food Chem., 2007, 22, 8995–9005 CrossRef PubMed.
- X. B. Fu, D. H. Li, J. Chen, Y. M. Zhang, W. Y. Huang, Y. Zhu, J. Yang and C. W. Zhang, Bioresour. Technol., 2013, 146, 767–770 CrossRef CAS PubMed.
|
| This journal is © The Royal Society of Chemistry 2015 |
Click here to see how this site uses Cookies. View our privacy policy here.