A monolithic nano-scale sensor architecture with tuneable gas diffusion for molecular fingerprinting†
Alishba T.
John
 a,
Mahdiar
Taheri
 b,
Jodie A.
Yuwono
c,
Priyank
Kumar
 d,
David R.
Nisbet
efgh,
Krishnan
Murugappan
 *ai and
Antonio
Tricoli
 *aj
*aj
aNanotechnology Research Laboratory, Research School of Chemistry, College of Science, The Australian National University, Canberra 2601, Australia
bSchool of Engineering, The Australian National University, Canberra 2601, Australia
cSchool of Chemical Engineering, The University of Adelaide, SA 5005, Australia
dSchool of Chemical Engineering, University of New South Wales, NSW 2052, Australia
eLaboratory of Advanced Biomaterials, Research School of Chemistry and the John Curtin School of Medical Research, The Australian National University, Canberra 2601, Australia
fThe Graeme Clark Institute, The University of Melbourne, Melbourne, Australia
gDepartment of Biomedical Engineering, Faculty of Engineering and Information Technology, The University of Melbourne, Melbourne, Australia
hMelbourne Medical School, Faculty of Medicine, Dentistry and Health Science, The University of Melbourne, Melbourne, Australia
iCommonwealth Scientific and Industrial Research Organization (CSIRO), Mineral Resources, Private Bag 10, Clayton South, Victoria 3169, Australia. E-mail: krishnan.murugappan@csiro.au
jNanotechnology Research Laboratory, School of Biomedical Engineering, Faculty of Engineering, The University of Sydney, Camperdown 2006, Australia. E-mail: antonio.tricli@sydney.edu.au
First published on 21st February 2024
Abstract
Semiconducting metal oxide (SMO) gas sensors have emerged as an invaluable technology due to their high sensitivity and ease of fabrication. However, they have limited selectivity and require relatively high operational temperatures. Here, we present a monolithic membrane-chemoresistive sensor consisting of a hierarchical metal oxide (MO) and a metal–organic framework (MOF) layer. Both layers were made by sequential aerosol deposition of SnO2 and ZnO nanoparticles, with the latter being thereafter converted to zeolitic imidazolate framework (ZIF-8) by chemical vapour conversion. The SnO2 fractal network provides a high surface area for chemical sensing, while the multi-scale porous ZIF-8 membrane offers a controlled gateway for gas molecule diffusion. Notably, our hierarchical dual-layer architecture can tune the analyte sensor response time, allowing discrimination of a variety of gases, including NO2, ethanol, acetone, methanol, propane, and ethyl benzene. Density Functional Theory (DFT) calculations were implemented to gain further insights into the selectivity mechanism revealing the key role of surface adsorption sites. This approach enables us to develop unique response profiles, fingerprinting the presence of specific gas molecules, with application ranging from industrial safety to environmental monitoring and medical diagnostics.
Introduction
Semiconducting metal oxides (SMOs) have been considered one of the most promising materials for small footprint gas detection systems due to their ease of miniaturization, high sensitivity, long operational life, and rapid response times. However, accurate detection of various gas molecules is hindered by their high operational temperature and low selectivity. Researchers have examined the effect of doping materials with catalysts such as Pt, Si, Rh, and Pd on the performance of sensors.1,2 Additionally, various carbon-based materials and polymers have been utilized to functionalize SMOs in order to induce specific gas dissociation and improve selectivity.3,4 Furthermore, reports indicate that forming heterojunctions or using multiple sensors simultaneously has improved sensor response.5 Although sensor response can be significantly improved, overcoming the limited selectivity which arises from the intrinsic SMOs sensing mechanism, (i.e. reactive desorption of surface oxygen species), is an ongoing challenge.Materials such as graphene, zeolites, and silica are promising candidates for integration with gas sensors or as standalone membranes for separation of gas molecules.6–8 These materials allow separation of target molecules from gas mixtures based on the size-exclusion principle and/or chemical adsorption.9–11 Due to their structural diversity, tuneable and flexible pore sizes, and large surface areas, metal–organic frameworks (MOFs) have gained considerable attention for gas sensing. In addition to their high porosity and structural flexibility, zeolitic imidazolate frameworks (ZIFs) have been extensively investigated.12 Khudiar et al. reported the growth of ZIF-8 using hydrothermal synthesis over ZnO nanorods through chemical bath deposition.13 They observed that their ZIF-8 coated ZnO nanorod sensors effectively sensed H2, while preventing the larger benzene molecules from reaching the ZnO surface. Jang et al. investigated the sensing performance of multidimensional hybrid MOFs.14 They created a structure consisting of 1D rod-like ZIF-67 anchored on a 2D ZIF-8 film and found that this architecture provides hetero p–n junction sites resulting in enhanced selectivity for acetone sensing. Despite these promising results, generalising the use of ZIF-8 or other MOFs for the identification of a panel of gas molecules has not been reported.
We present a monolithic dual-layer architecture for selective chemoresistive gas sensing, which combines a SnO2 fractal network as a detection layer and a ZIF-8 membrane as a diffusion barrier modulating transport time for gas molecule separation. We explore the impact of the ZIF-8 layer thickness and extrinsic porosity on molecular diffusion time to the sensing layer, demonstrating control of sensor response time. The multi-scale porous filtering capabilities of the ZIF-8 membrane allows the response time of the sensor to be spaced as a function of the target analyte, allowing discrimination against a panel of gas molecules, including ethanol, acetone, methanol, propane, and ethyl benzene. These promising findings have the potential to enable the fabrication of miniaturised and integrated gas chromatograph-like detectors for a broad range of portable and distributed gas analysis applications.
Experimental
Sensor fabrication
SnO2 films were deposited using the flame spray pyrolysis (FSP) technique as follows: A solution containing a total Sn-metal atom concentration of 0.1 mol L−1 was prepared by diluting tin(II)-ethyl hexanoate (Sigma-Aldrich, purity 95%) in xylene (Sigma-Aldrich). The precursor solution was delivered through a syringe pump of 5 mL min−1 and dispersed into a fine spray using 7 L min−1 of O2 at a constant pressure drop of 2 bars. The spray was ignited using a premixed CH4/O2 flame (CH4 = 1.8 L min−1, O2 = 2 L min−1). To maintain the substrate temperature below 150 °C, a water-cooled substrate holder was positioned 20 cm above the burner. The sensor substrates – Platinum Inter-digitated Electrode (Pt-IDEs) – composed of glass with Pt fingers having dimensions of 5 μm width and spacing, creating a total electrode area of 10 × 6 × 0.75 mm (Micrux Technologoes, Spain), were used. The SnO2 fractal films were subsequently annealed at 500 °C for 5 hours to ensure thermal stability and prevent additional nanoparticle sintering during sensing applications. Employing the same FSP technique, ZnO was deposited over the annealed SnO2 films using a precursor solution of zinc-naphthenate in xylene. To convert ZnO to ZIF-8, a glass vial containing 410 mg of solid 2-methylimidazole (2-MIM) crystals (Sigma-Aldrich) was positioned within a Teflon-lined stainless-steel autoclave, with the sensor substrates also placed on a sample holder inside the same autoclave. The sealed autoclave was gradually heated to 120 °C at a rate of 10 °C min−1 using a gravity convection oven and maintained at this temperature for 18 hours.Material characterization
Cross-sectional Scanning Electron Microscopy (SEM) images of the developed sensing platforms were acquired using a Zeiss Ultraplus (FESEM) at 2 kV. X-Ray diffraction (XRD) patterns were acquired utilizing the Bruker D2 Phaser, operated at 40 kV and 40 mA, with a 2θ (Cu Kα) range of 5°–80°, a scanning speed of 11 s−1, and a step size of 0.014°. Fourier Transform Infrared (FTIR) spectrum was captured using the Bruker ALPHA II FTIR Spectrometer with the PLATINUM ATR module, spanning from 4000 to 400 cm−1. High-resolution transmission electron microscope (HR-TEM) analyses carried out on a FEI TECNAI G2 F20 instrument, operating at an accelerating voltage of 200 kV and equipped with an S-Twin lens that gives a point resolution of 0.24 nm. The TEM grids were prepared by dropping the dispersed suspension of nanoparticles in ethanol onto a holey-carbon supported copper grid and drying it in air at room temperature.Chemoresistive gas sensing
NO2, ethanol, acetone, methanol, propane, and ethyl benzene, each at a concentration of 10 ppm in N2 (Coregas), were diluted in simulated air (0.1 L min−1 O2 + 0.4 L min−1 N2 (BOC Ltd)) using a mass flow controller (Bronkhorst). This manipulation ensured the desired concentration range of 0.1–1 ppm while maintaining a constant total gas flow rate of 0.5 L min−1. The gas sensing chamber's hotplate (Linkam) was consistently held at 150 °C using a temperature controller. For 5 hours, the sensors were allowed to stabilize at 150 °C within simulated air conditions, establishing a steady baseline resistance and preventing sensor drift during the sensing experiments. The dynamic responses were concurrently recorded using the Keithley Multimeter 2700. The sensor responses were subsequently calculated as: | (1) |
 | (2) |
Density functional theory (DFT) calculations
DFT calculations were performed using the Projector Augmented Wave (PAW) method15,16 as implemented in the Vienna Ab initio Simulation Package (VASP).17,18 The calculations were completed with a plane-wave cut-off energy of 500 eV. Gamma k-points meshes of 5 × 5 × 5 and 3 × 3 × 1 were used for sampling the Brillouin zone of ZIF-8 and SnO2, respectively. The electronic self-consistent calculation was converged to 1 × 10⁻⁵ eV and ionic relaxation steps were performed using the conjugate-gradient method of IBRION = 2 and continued until the total force on each atom dropped below a tolerance of 2 × 10⁻² eV Å−1. The generalized gradient approximation (GGA) was used for the exchange correlation functional as parameterized by Perdew–Burke–Ernzerhof (PBE).19 A slab method was employed to model SnO2 surface and a vacuum of 20 Å in z-direction was introduced to remove the effect of periodic boundary condition. Bulk-surface interaction in SnO2 slab was modelled by relaxing only atoms in the three uppermost layers and fixing atoms in other layers to their bulk coordinates. The dispersion correction was performed in this study using the DFT-D3 method. The adsorptions of different gases were then investigated with the adsorption energy was calculated using the following:| Eads = Esubstrate+gas – Esubstrate – Egas | (3) |
Molecular dynamic simulations
Ab initio molecular dynamic simulation was performed using a plane-wave DFT approach as implemented in VASP. The kinetic energy cutoff of 400 eV and a single Gamma k-point were used. The diffusion of gases in bulk ZIF-8 structures were computed at a temperature of 300 K for 5 ps. It is worth noting that the mean squared displacements (to show the diffusivity profile) of gas molecules were considered right before they breakdown into smaller molecules.Results and discussion
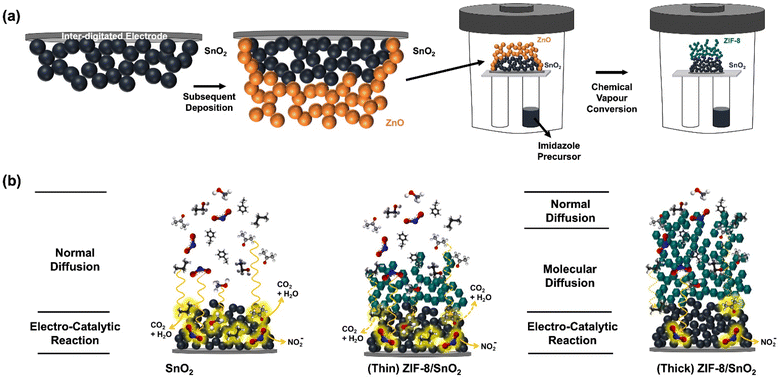
Fig. 1a illustrate the fabrication of the integrated sensor architecture using flame spray pyrolysis (FSP)20 and chemical vapour conversion (CVC).21 Combining these techniques facilitates the creation of integrated dual-layer hierarchical structures for gas detection. The deposition of the SnO2 fractal film onto the Platinum Inter-digitated Electrodes (Pt-IDEs) substrate is accomplished through a single step flame-made aerosol synthesis process. Typically, tin(II)-ethyl hexanoate dissolved in a highly combustible solvent is introduced into a custom-designed FSP reactor at a constant rate to the atomization of the Sn precursor into micro-droplets. Subsequent combustion of these droplets induces the formation of a super-saturated vapour. Upon nucleation, diffusion-limited cluster–cluster aggregation, and condensation results in the growth of larger SnO2 nanoparticles, resulting in a fractal network over the Pt-IDEs. The porosity and thickness of this self-organized fractal network is controlled by adjusting the height above the burner (HAB) and deposition times. For gas sensing applications, optimization was conducted based on prior studies.22–24 FSP offers several advantages over conventional sensor fabrication methods as drop-casting and spin-coating, including direct deposition, uniform nanoparticle coverage, and high surface areas.Following the same principle, a ZnO layer was deposited onto the SnO2 fractal network by deposition of a flame-made ZnO nanoparticle aerosol. The ZnO fractal films was subsequently converted to ZIF-8 by exposure to a 2-methylimidazole linker via the CVC technique.25 By implementing the CVC technique, the extrinsic porosity of the ZIF-8 layer can be controlled from 4 to 66%,25 allowing control of gas molecule diffusion time through the ZIF-8 membrane. The ZIF-8 layer thickness was regulated by controlling the ZnO aerosol deposition time, resulting in the fabrication of a range of dual-layer hierarchical architectures.
Fig. 1b illustrates the controlled gas diffusion concept within our hierarchical structure. Diverse gas molecules diffuse and interact with the SnO2 fractal network. These interactions trigger adsorption and desorption reactions resulting in modulation of the electrons present in the conduction band of the semiconductor in response to gases introduced into the system. However, in the presence of the hierarchical ZIF-8 membrane the gas molecule transport to the SnO2 layer depends also on the membrane thickness and porosity. This allows to increase the transport time as a function of the molecule property. The sensor's responsivity can also be influenced by other factors such as chemical affinity through the ZIF-8 membrane, making it a versatile approach to tune the selectivity of the resulting sensor.21
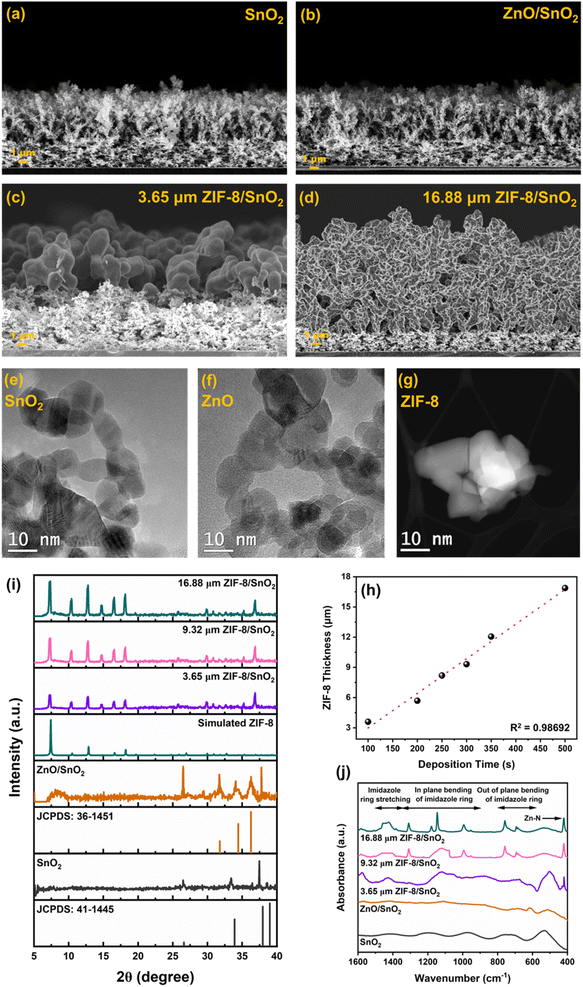
Fig. 2 represents morphological characterization of the fabricated sensing layers, pursued by Scanning Electron Microscopy (SEM). Fig. 2a and b shows a highly porous fractal networks of SnO2 and ZnO/SnO2 deposited at a height of 20 cm above the burner. While Fig. 2c and d shows the SEM images of the converted ZIF-8/SnO2 layers with tuneable ZIF-8 thickness as a function of the ZnO deposition times (100–500 s). Fig. 2e illustrates the high-resolution transmission electron microscopy (HR-TEM) images of SnO2 nanoparticles collected from the deposited films. The micrographs show highly crystalline and non-porous spheroidal particles characterized with a similar size distribution as previously reported for flame synthesis of SnO2.22Fig. 2f shows the HR-TEM images of the ZnO nanoparticles, revealing similar size distribution and shape as previously reported for the flame-based fabrication of dye-sensitised solar cells.26 Both SnO2 and ZnO nanoparticles exhibit a high level of crystallinity. Fig. 2g shows HR-TEM images of ZIF-8, highlighting a well-defined and uniform morphology characterized by high crystallinity.
It can be observed from Fig. 2h that the thickness of the ZIF-8 layer is linearly dependent on the deposition time of ZnO. To understand the impact of the ZIF-8 membrane thickness on the sensing performance, different ZIF-8 thickness of 3.65 μm (thin), 9.32 μm (medium) and 16.88 μm (thick) were selected for further characterization.
To confirm the conversion of the ZnO fractal network to ZIF-8 X-ray diffraction (XRD) and Fourier transform infra-red (FTIR) spectroscopy were performed. Characteristic XRD peaks (Fig. 2i) obtained at 2θ = 26.485°, 33.414° and 37.473° corresponds to the tetragonal cassiterite phases (110), (101) and (200) respectively.27 The diffractions peaks 31.692°, 34.48° and 36.284° corresponds to the hexagonal wurtzite structural planes (100), (002) and (101) phases of ZnO respectively.28 Appearance of diffraction peaks at 7.338°, 10.413°, 12.791°, 14.667°, 16.563° and 18.162° corresponds to (110), (200), (211), (220), (310) and (222) planes of crystalline sodalite ZIF-8 phases, indicating the conversion of ZnO.25,29 FTIR spectral analysis (Fig. 2j) of SnO2 and ZnO shows the characteristic stretching bonds of Sn–O and Zn–O at 520 cm−1 and 440 cm−1, respectively. The replacement of Zn–O stretching with Zn–N stretching at 423 cm−1 and appearance of characteristic imidazole ring stretching (1500–1350 cm−1), in-plane bending of imidazole ring (1350–900 cm−1) and out of plane bending of imidazole ring (800–660 cm−1) further confirms the reaction between ZnO and 2-MIM and resultant formation of ZIF-8.25
To determine the optimal operating temperature, the sensors were subjected to ethanol at varying concentrations ranging from 0.1–1 ppm across different operating temperature ranges spanning from 25 °C to 150 °C. As depicted in Fig. S1,† the sensing response was observed to increase and attain a maximum value at 150 °C. This is attributed to the fact that at lower temperature, the catalytic activity is low. Operating the fabricated sensors at temperatures exceeding 150 °C could potentially lead to the degradation of the organic linkers within the ZIF-8 layer30 hence, the optimal operating temperature of 150 °C was employed for all subsequent experiments.
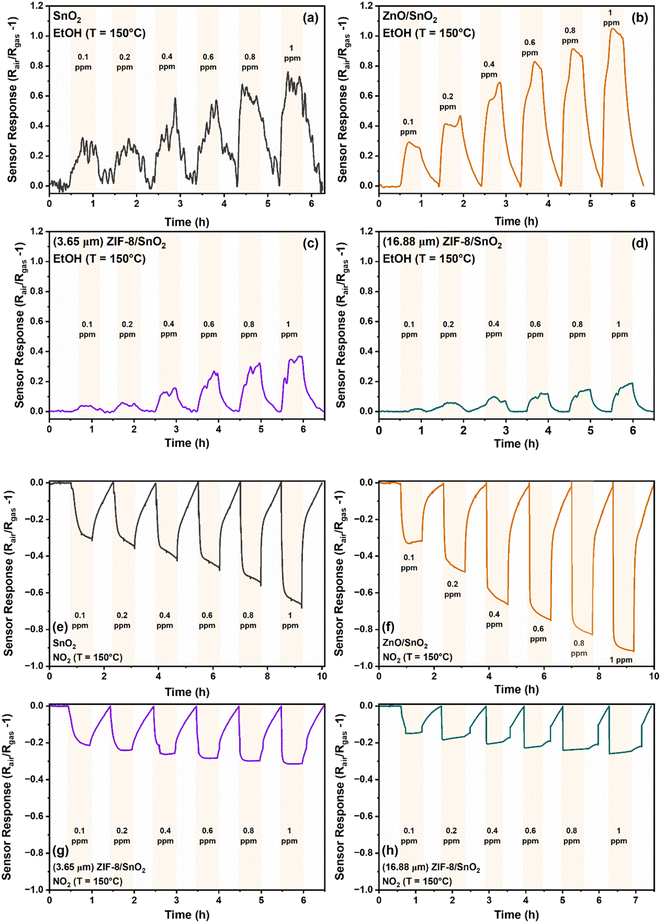
Fig. 3a–d illustrates the dynamic sensing response for ethanol (reducing gas) and NO2 (oxidizing gas) (Fig. 3e–h) as a function of concentration (0.1–1 ppm) for the SnO2, ZnO/SnO2, 3.65 μm (thin) ZIF-8/SnO2 and 16.88 μm (thick) ZIF-8/SnO2 sensors, respectively. Fig. S2a and b† shows the dynamic sensing responses of a representative 9.32 μm (medium) ZIF-8/SnO2 sensors for ethanol and NO2, respectively. Under simulated dry air conditions both the SnO2 and ZnO/SnO2 metal oxide sensors interact with oxygen molecules and capture free electrons from the conduction band, resulting in the formation of ions (O2−) on the surface. At an optimal operating temperature, the O2− ions dissociate and form chemisorbed oxygen ions (O−), which additionally capture electrons forming O2−. By capturing electrons, the concentration of charge carriers is reduced, increasing the resistance of the sensor. When reducing target gas is introduced, its reaction with the O2−, causes their release from the surface and injection of the electrons back to the semiconductor. In the presence of a reducing gas, our metal oxide sensors exhibit a typical n-type semiconductor behaviour,31 showing a decrease of the resistance. In contrast, when an oxidizing gas was introduced into the system, such as NO2 the electrons are trapped from the conduction band by adsorption of further oxidation of the metal oxide sensor surface, resulting in an increase of the resistance.32 Our sensors showed good linearity in the range of 0.1–1 ppm, as represented in Fig. S3.†
Fig. 4 represents the density functional theory (DFT) calculations, employed to investigate the adsorption energies of a representative subset of gas analytes on both the SnO2 (110) and ZIF-8 surfaces. The adsorption energies (eV) for ZIF-8 and SnO2 surface upon interaction with various target gas molecules have been summarized in Table S1.† Compared to ZIF-8, SnO2 consistently showed significantly stronger interactions with all tested gas molecules. For example, in the case of NO2, the adsorption energy on SnO2 was notably more negative (−2.00 eV) than on ZIF-8 (−0.38 eV), indicating a much stronger affinity of NO2 for SnO2. This trend held true for all the gases studied, suggesting that SnO2 possesses stronger interaction potential for these gas molecules than ZIF-8. This is well-aligned with our experimental findings in Fig. 3, explaining the stronger sensing response of the pure SnO2 sensors than the ZIF-8 containing ones.
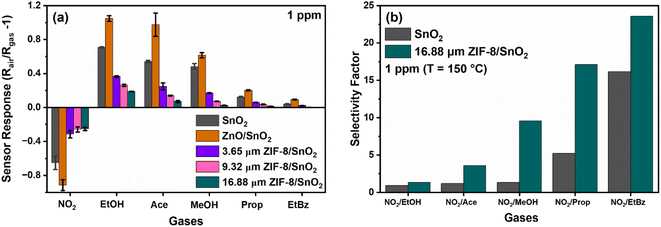
We investigated the responsivity of our integrated ZIF-8 membrane sensor to a panel of gas molecules. As depicted in Fig. 5a, an increase in the thickness of the ZIF-8 layer consistently resulted in a reduction in the sensor response, aligning with our DFT computational findings presented in Fig. 4. Specifically, we observed the absolute responses of the SnO2 porous fractal sensor to be 0.65, 0.71, 0.54, 0.48, 0.13 and 0.04 at 1 ppm, towards the tested subset of gases. In comparison, the sensor responses at 1 ppm for ZIF-8/SnO2 dual layer sensors with thicknesses of 3.65 μm (thin) were 0.31, 0.36, 0.25, 0.17, 0.06, 0.02 and for 16.88 μm (thick), they were 0.25, 0.19, 0.07, 0.005, 0.002, 0.003 towards NO2, ethanol, acetone, methanol, propane, and ethyl benzene, respectively. Remarkably, we observed a ∼54% decrease in response for the thin ZIF-8/SnO2 sensor and a substantial ∼80% decrease in response for the thickest ZIF-8 sensor, for kinetically larger target gases. However, in the case of NO2, the response decrease for the varying thickness layers was only ∼19%, suggesting that the ZIF-8/SnO2 sensor with varying thickness can selectively detect NO2. This reduced decrease in response for NO2 translates into an enhanced NO2 selectivity factor, as illustrated in Fig. 5b. An inverse relation was observed between the thickness of the ZIF-8 membrane and the overall sensor response. The reduced overall response is tentatively attributed to the increased decrease of the analyte molecules diffusion flux to the SnO2 sensing layer. We previously investigated the selectivity of ZIF-8/SnO2 conformal structures fabricated by atomic layer deposition (ALD) and our chemical conversion of ZnO on a highly porous SnO2 nanoparticle sensing layer.21 A substantial decrease in sensor response was observed by increasing the thickness of the ZIF-8 nano-layer coating. This was attributed to the size exclusion effect brought about by the intrinsic ZIF-8 porosity. Here, adopting a hierarchical structure with both micro- and micro-porosity and a tuneable sub-micro-scale thickness, we introduce the additional capability of modulating the gas molecules transport time through the ZIF-8 membrane.
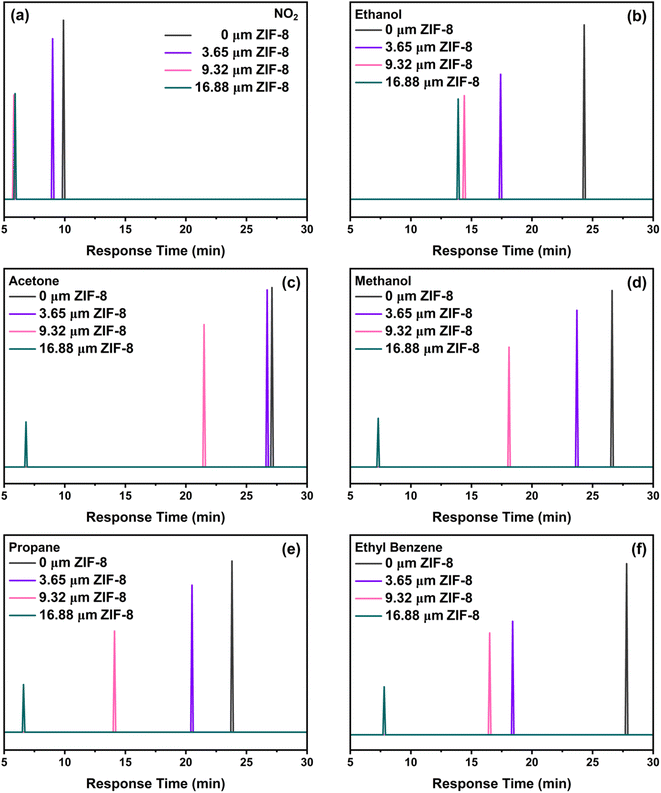
We have used this tuneable membrane feature to achieve characteristic response time-fingerprints for each of the analyte gas molecules, which resembles a gas chromatograph (GC) (Fig. 6). The response–recovery time curves related to these measurements have been illustrated in Fig. S4.† The response time can be tuned by varying the ZIF-8 thickness, enabling to distinguish between different gases.
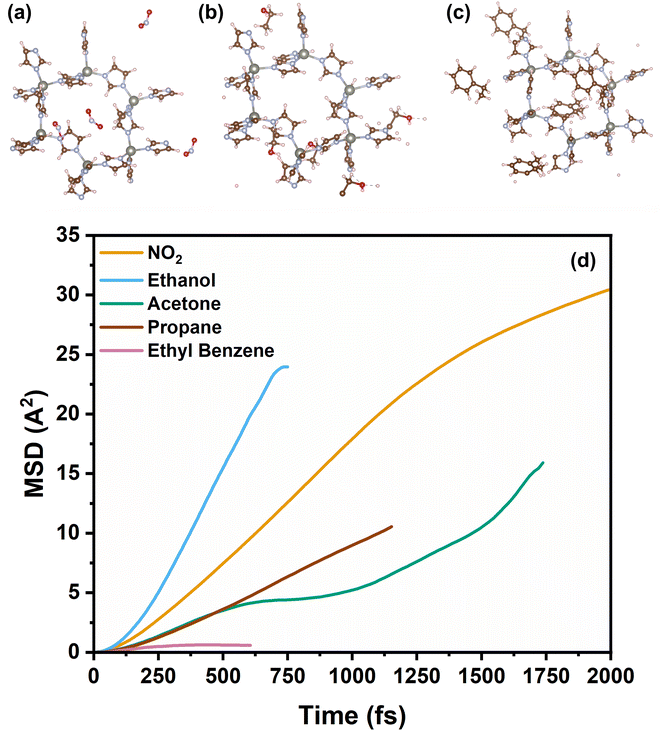
We observed a consistent and surprising trend that as the thickness of the ZIF-8 layer increased, the response time consistently decreased for all tested gases. The reduction in response time is tentatively attributed to the presence of ZIF-8 membrane over the SnO2 sensing layer, which decreases the number of active sites available for chemical interactions. This leads to a faster attainment of equilibrium in the sensor's response, thus resulting in shortened response times. Specifically, the NO2, is the fastest and almost halved from ca. 10 to 5.9 min from the bare SnO2 sensor to the thickness ZIF-8/SnO2 sensor. In contrast, larger gas molecules, such as ethyl benzene, exhibit longer response times up to ca. 7 min. This opens exciting possibilities for tailoring the sensor response to a wide range of gases with significantly higher selectivity than current metal-oxide sensors. This also enables the fabrication of sensor arrays where the response time of the sensor can be used to fingerprint the presence of a specific analyte. To gain further insight into the mechanism of gas diffusion through the ZIF-8 membrane, molecular dynamics (MD) simulations were conducted to study the dynamic diffusion within bulk ZIF-8 structures (Fig. 7). The mean square displacement (MSD) was employed for quantitative analysis, elucidating the diffusion behaviour of various gases within the ZIF-8 membrane and revealing distinct diffusivity profiles over time. Notably, ethanol exhibited the highest diffusivity, followed by NO2, propane, acetone, and ethyl benzene. This aligns with our experimental results, where smaller gas molecules demonstrated shorter response times. The longer timescale analysis indicated a trend of shorter diffusion distances for smaller gas molecules compared to larger ones, suggesting the ZIF-8 membrane's capability to selectively modulate gas diffusion rates. Additionally, the simulations demonstrated the highly reactive nature of methanol and ethanol, as evidenced by their dissociation into smaller molecules at an early simulation time (t = 0.2 ps). Importantly, these MSD findings also shed light on the stability of gases, revealing a distinct order of lifetimes: NO2 > acetone > propane > ethyl benzene > ethanol > methanol. This additional insight into gas stability further enhances our understanding of the diffusion dynamics within the ZIF-8 membrane, reinforcing the role of this membrane as a critical factor influencing the sensor's response time and selectivity.
Comparison of our sensors figure of merits with other chemoresistive gas sensors based on ZIF-8 framework has been summarised in Table 1. Matatagui et al. reported the chemoresistive performance of ZIF-8/ZIF-67 at an operating temperature of 180 °C, testing toluene, ethanol, carbon monoxide, hydrogen and NO2 with response times of 3.1, 5.8, 4.4, 3.1 and 5.5 min respectively.33 Wu et al. reported the work of ZIF-8/ZnO sensors at an operating temperature of 25 °C, targeting H2S, with a reported response time of 7 min34 Notably, our response times, detailed in the comparison table, are within those reported in other studies for analogous sensor technologies. Improvement of the response and recovery time is necessary for application of these sensors to few applications.
As reproducibility and long-term stability are crucial parameters for the practical applicability of gas sensors, further tests were conducted on the 16.88 μm ZIF-8/SnO2 sensor. Fig. 8a shows characteristic sensor response–recovery curves for 10 cycles to 1 ppm of ethanol at 150 °C, showing good reproducibility. The long-term stability of the sensor was investigated at 150 °C for 30 days (Fig. 8b). Our sensor maintained ∼95% of its original response throughout the entire 30 day testing period.
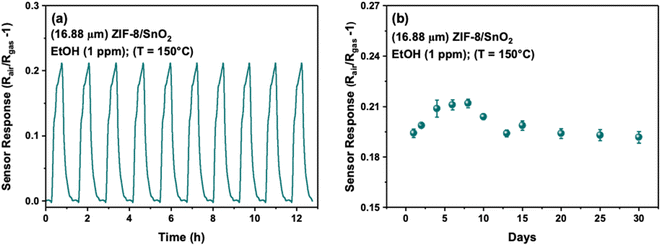 | ||
| Fig. 8 (a) Reproducibility for 10 cycles (b) long-term stability tests of 16.88 μm ZIF-8/SnO2 towards 1 ppm EtOH (Ethanol) at 150 °C. | ||
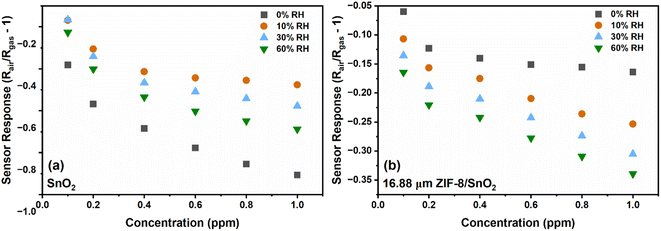
Humidity plays a crucial role as an interfering parameter in various practical applications. SnO2 and 16.88 μm (thick) ZIF-8/SnO2 sensors were tested against relative humidity (RH) conditions (0, 10, 30 and 60%), as represented in Fig. 9. At 0% RH (Fig. 9a), the SnO2 fractal sensor exhibited the highest response. However, the introduction of a small amount of RH (10%) significantly decreased the sensor response due to the competitive adsorption of water and NO2 molecules on the SnO2 surface, consistent with the literature.35 On the other hand, 16.88 μm (thick) ZIF-8/SnO2 sensors demonstrated enhanced stability under different RH conditions (Fig. 9b). This improved stability could be attributed to the ZIF-8 layers hindering the penetration of water molecules to the SnO2 surface, through its hydrophobic pores as well as due to controlled coordination behaviour. Fig. S5† illustrates the cross-sensitivity (CS) to humidity at 1 ppm NO2 for various sensors. The bar plot indicates that the CS to humidity for the SnO2 sensor decreased from 57% to 38% with increasing RH from 10% to 60%. In comparison, the CS for the 16.88 μm (thick) ZIF-8/SnO2 was in the range of 19–28%, which shows that the ZIF-8 sensor provides more stable and predictable results across different RH conditions.
Conclusions
Here, we introduce a promising approach to tune the selectivity chemoresistive gas sensors by engineering a monolithic membrane-sensing layer architecture. This platform is fabricated by depositing SnO2 and ZnO layers onto platinum inter-digitated electrodes and subsequently converting ZnO to ZIF-8 by chemical vapour conversion. Morphological and structural analysis confirmed the successful conversion of ZnO to ZIF-8. This provided control over the extrinsic porosity and thickness of the ZIF-8 membrane, allowing fabrication of a range of sensor morphologies. Systematic examination of the sensor architecture performance revealed its capacity to tune the analyte response time as a function of its physical and chemical properties. Exploration of the response-time patterns as a function of the ZIF-8 thickness, resulted in fingerprints for each gas molecule allowing its selective identification. Density Functional Theory (DFT) analysis provides a possible explanation to the observed decrease in equilibration time with increasing ZIF-8 thickness. These findings show a promising approach to engineer more selective chemoresistive sensor arrays for identification of gas molecule panels with applications including environmental monitoring, industrial safety, and medical diagnostic.Author contributions
Alishba T. John: methodology, investigation, validation, visualization, formal analysis; writing – original draft. Mahdiar Taheri: methodology, writing – reviewing & editing. Jodie A. Yuwono: methodology, formal analysis, writing – reviewing & editing. Priyank Kumar: methodology, formal analysis, writing – reviewing & editing. David R. Nisbet: funding acquisition, resources, writing – reviewing & editing. Krishnan Murugappan: conceptualization, investigation, funding acquisition, supervision, writing – reviewing & editing. Antonio Tricoli: conceptualization, funding acquisition, resources, supervision, writing – reviewing & editing.Conflicts of interest
There are no conflicts to declare.Acknowledgements
A. T. gratefully acknowledges the support of the Australian Research Council for a Future Fellowship (FT200100939) and Discovery grant DP190101864. A. T. also acknowledges financial support from the North Atlantic Treaty Organization Science for Peace and Security Programme project AMOXES (#G5634). K. M. and A. T. acknowledge financial support from the Department of Defence and Australian Research council for the National Intelligence and Security Discovery Research Grants (NISDRG) Program (NS210100083). J. A. Y. acknowledges the high-performance computing support from National Computational Infrastructure (NCI) Australia. D. R. N. was supported by a NHMRC Research Leadership Fellowship GNT1135657 and subsequently an Australian Research Council for a Future Fellowship (FT230100220). A. T. J. acknowledges Dr Renheng Bo for initial assistance in material synthesis. HRTEM analyses were performed at the TEM facility of the Unitech COSPECT (University of Milan). All authors acknowledge the facilities and the scientific and technical assistance of Microscopy Australia at the Centre for Advanced Microscopy, Australian National University, a facility that is funded by the University and the Federal Government. This research was funded by and has been delivered in partnership with Our Health in Our Hands (OHIOH), a strategic initiative of the Australian National University, which aims to transform healthcare by developing new personalised health technologies and solutions in collaboration with patients, clinicians, and health care providers.References
- M. Righettoni, A. Tricoli and S. E. Pratsinis, Anal. Chem., 2010, 82, 3581–3587 CrossRef CAS
.
- X. Kou, N. Xie, F. Chen, T. Wang, L. Guo, C. Wang, Q. Wang, J. Ma, Y. Sun and H. Zhang, Sens. Actuators, B, 2018, 256, 861–869 CrossRef CAS
.
- F. Yin, W. Yue, Y. Li, S. Gao, C. Zhang, H. Kan, H. Niu, W. Wang and Y. Guo, Carbon, 2021, 180, 274–297 CrossRef CAS
.
- Y. C. Wong, B. C. Ang, A. Haseeb, A. A. Baharuddin and Y. H. Wong, J. Electrochem. Soc., 2019, 167, 037503 CrossRef
.
- N. Nasiri and C. Clarke, Sensors, 2019, 19, 462 CrossRef PubMed
.
- C. Athanasekou, M. Pedrosa, T. Tsoufis, L. Pastrana-Martínez, G. Romanos, E. Favvas, F. Katsaros, A. Mitropoulos, V. Psycharis and A. Silva, J. Membr. Sci., 2017, 522, 303–315 CrossRef CAS
.
- A. T. Güntner, S. Abegg, K. Wegner and S. E. Pratsinis, Sens. Actuators, B, 2018, 257, 916–923 CrossRef
.
- L. Li, T. Wang, Q. Liu, Y. Cao and J. Qiu, Carbon, 2012, 50, 5186–5195 CrossRef CAS
.
- Z. Chen, J. Wang and Y. Wang, Talanta, 2021, 235, 122745 CrossRef CAS PubMed
.
- S. Ahoulou, E. Perret and J.-M. Nedelec, Nanomaterials, 2021, 11, 999 CrossRef CAS PubMed
.
- J. Park and H. Tabata, ACS Omega, 2021, 6, 21284–21293 CrossRef CAS PubMed
.
- Q.-Q. Chen, R.-N. Hou, Y.-Z. Zhu, X.-T. Wang, H. Zhang, Y.-J. Zhang, L. Zhang, Z.-Q. Tian and J.-F. Li, Anal. Chem., 2021, 93, 7188–7195 CrossRef CAS
.
- A. I. Khudiar, A. K. Elttayef, M. K. Khalaf and A. M. Oufi, Mater. Res. Express, 2020, 6, 126450 CrossRef
.
- J.-S. Jang, W.-T. Koo, D.-H. Kim and I.-D. Kim, ACS Cent. Sci., 2018, 4, 929–937 CrossRef CAS PubMed
.
- P. E. Blöchl, Phys. Rev. B: Condens. Matter Mater. Phys., 1994, 50, 17953 CrossRef PubMed
.
- G. Kresse and D. Joubert, Phys. Rev. B: Condens. Matter Mater. Phys., 1999, 59, 1758 CrossRef CAS
.
- G. Kresse and J. Furthmüller, Comput. Mater. Sci., 1996, 6, 15–50 CrossRef CAS
.
- G. Kresse and J. Furthmüller, Adv. Phys.: X, 1996, 54, 11169 CAS
.
- J. P. Perdew, K. Burke and M. Ernzerhof, Phys. Rev. Lett., 1996, 77, 3865 CrossRef CAS PubMed
.
- A. T. John and A. Tricoli, Adv. Phys.: X, 2022, 7, 1997153 Search PubMed
.
- A. T. John, K. Murugappan, M. Taheri, D. R. Nisbet and A. Tricoli, J. Mater. Chem. C, 2021, 9, 17331–17340 RSC
.
- H. Keskinen, A. Tricoli, M. Marjamäki, J. M. Mäkelä and S. E. Pratsinis, J. Appl. Phys., 2009, 106(8) DOI:10.1063/1.3212995
.
- A. Tricoli, Biosensors, 2012, 2, 221–233 CrossRef CAS
.
- A. Tricoli, M. Graf and S. E. Pratsinis, Adv. Funct. Mater., 2008, 18, 1969–1976 CrossRef CAS
.
- R. Bo, M. Taheri, B. Liu, R. Ricco, H. Chen, H. Amenitsch, Z. Fusco, T. Tsuzuki, G. Yu and R. Ameloot, Adv. Sci., 2020, 7, 2002368 CrossRef CAS
.
- A. Tricoli, N. Nasiri, H. Chen, A. S. Wallerand and M. Righettoni, Sol. Energy, 2016, 136, 553–559 CrossRef CAS
.
- N. J. Pineau, S. D. Keller, A. T. Güntner and S. E. Pratsinis, Microchim. Acta, 2020, 187, 1–9 CrossRef PubMed
.
- N. Nasiri, R. Bo, F. Wang, L. Fu and A. Tricoli, Adv. Mater., 2015, 27, 4336–4343 CrossRef CAS PubMed
.
- N. A. H. M. Nordin, A. F. Ismail, N. Misdan and N. A. M. Nazri,
AIP Conf. Proc.
, 2017, 1891, 020091 CrossRef
.
- J. B. James and Y. Lin, J. Phys. Chem. C, 2016, 120, 14015–14026 CrossRef CAS
.
- M. Vorokhta, I. Khalakhan, M. Vondráček, D. Tomeček, E. Marešová, J. Nováková, J. Vlček, P. Fitl, M. Novotný and P. Hozák, Surf. Sci., 2018, 677, 284–290 CrossRef CAS
.
- D. Gu, X. Li, Y. Zhao and J. Wang, Sens. Actuators, B, 2017, 244, 67–76 CrossRef CAS
.
- D. Matatagui, A. Sainz-Vidal, I. Gràcia, E. Figueras, C. Cané and J. Saniger, Sens. Actuators, B, 2018, 274, 601–608 CrossRef CAS
.
- X. Wu, S. Xiong, Y. Gong, Y. Gong, W. Wu, Z. Mao, Q. Liu, S. Hu and X. Long, Sens. Actuators, B, 2019, 292, 32–39 CrossRef CAS
.
- A. Tricoli, M. Righettoni and S. E. Pratsinis, Nanotechnology, 2009, 20, 315502 CrossRef
.
Footnote |
| † Electronic supplementary information (ESI) available. See DOI: https://doi.org/10.1039/d3ta07282g |
| This journal is © The Royal Society of Chemistry 2024 |

