
Design and evaluation of a microrectification platform using 3D printing†
Yuting
Zheng
,
Guandong
Fang
,
Zhuoqin
Fan
,
Haomiao
Zhang
 *,
Jingdai
Wang
and
Yongrong
Yang
*,
Jingdai
Wang
and
Yongrong
Yang
State Key Laboratory of Chemical Engineering, College of Chemical and Biological Engineering, Zhejiang University, 310058, P.R. China. E-mail: haomiaozhang@zju.edu.cn
First published on 30th November 2023
Abstract
We present a microrectification platform to separate effectively binary liquid mixtures, using n-hexane and cyclohexane as a model system. We design and 3D print rectification columns with three different tray structures and one packed structure for enhanced mass transfer. In the experiments, at a reflux ratio of 4.0, we obtain a height equivalent of a theoretical plate (HETP) of 10.3 mm using a designed tray structure, demonstrating an efficient process. We further develop a mass transfer model to obtain the gas–liquid mass transfer coefficient for optimal process design. Our approach that leverages the advantages of 3D printing offers an effective solution for separation of liquids with close boiling points.
Distillation is a method to separate miscible liquid mixtures by vaporization and condensation based on the different volatilities of each component. Rectification is a continuous combination of multiple distillations with the liquid and vapor brought into counter-current contact, as one of the most commonly used unit operations for separation in the chemical industry.1 However, conventional distillation/rectification processes are faced with major limitations such as outdated energy-saving technology, low equipment efficiency, and the poor separation effect of relatively low volatile mixtures.2 Although updated technologies such as extractive distillation,3,4 membrane distillation,5–7 heat pump assisted distillation,8,9 and multi-effect distillation10,11 are developed, those drawbacks still remain.
In the 1990s, microreaction technology emerged as an important method for process intensification in chemical synthesis.12–14 As microreaction comes of age, modular and customizable flow chemistry processes with an end-to-end design allow for the development of on-demand manufacturing, rapid screening reaction parameters, inline separation, and reaction optimization.15–17 In a microreaction process, separation units are one of the major components that dictate the overall performance of the system.18 However, fabricating microseparation units is mostly dependent on molding and lithographic approaches with photoresists and PDMS (polydimethylsiloxane),19 which require complex and skillful operations by hands; and thus it remains challenging to create a sophisticated design of microstructures. Three-dimensional (3D) printing has drawn much attention for its relatively facile way to make monolithic components since its discovery.20,21 Therefore, leveraging 3D printing to design and fabricate microchemical units (e.g., mixers, reactors, and separators) enlarges a new freedom of design and rapidly creates complicated structures that are impossible to make using conventional subtractive manufacturing processes.22–25
Recently, microscale distillation/rectification has been reported for better heat and mass transfer, higher energy efficiency, and increased safety; however, their structures are mostly based on empty or packed tubular channels.26,27 For microrectification devices with simple structures, it is still challenging to maintain a stable operation as well as to achieve high performance.
Among literature studies, Sundberg et al. developed a microdistillation unit packed with porous metal foams.28 In their design, the reflux and reboiling flow rates are well controlled through level monitoring and mass flow controllers.29 Ziogas et al. designed a microrectification column with baffles functioning as the column plate.30 The liquid phase flow is driven by gravity and capillary force, and a high separation efficiency is obtained when operated continuously. In addition, Hartman et al. introduced an on-chip distillation device establishing vapor–liquid equilibrium during segmented flow, with performance equivalent to a single-stage flash distillation process.31 Mardani et al. proposed a coiled shaped distillation column with packings, and assembled into a modular device through flanges.32 The modular design makes it possible to replace the key components, thus reducing the influence of chemical compatibility during experiments. MacInnes et al. designed a spiral microchannel that coupled centrifugal force and microdistillation.33,34 The gas–liquid phases were separated into two parallel counter-current layers by design, achieving more efficient contact and faster separation than conventional distillation. However, the generation and control of centrifugal forces are challenging and might limit its further development.
Herein, in this communication, we aim to develop an efficient microrectification platform with 3D printed tray/packed columns. Specifically, we (i) design three tray structures with unique 3D features as well as a packed structure to enhance mass transfer, (ii) perform experiments under batch and continuous conditions using a binary mixture of n-hexane and cyclohexane, (iii) analyze quantitatively and compare the separation performance based on the McCabe–Thiele diagram, and (iv) develop a mathematical model to obtain the gas–liquid mass transfer coefficient of the structure for optimal device design.
The experimental setup for the entire rectification process is illustrated in Fig. 1 and S1 in the ESI.† This platform primarily encompasses a plunger pump for the feed, two peristaltic pumps to control the reflux and reboiling ratios, a reboiler (oil bath), a condenser (ice bath), and 3D printed microrectification columns. Plastic 3D printing is employed for its advantages of lower cost, faster design iteration and modification, and accelerated lead time, over metal 3D printing. All columns are fabricated using a commercial Form 2 SLA 3D printer (Formlabs, MA, USA) with a High Temp Resin (FLFLGR02) of sufficient chemical compatibility. In order to obtain high thermal stability, the as-printed columns are post-cured at 80 °C for 2 h with a temperature-controlled light curing machine (Form Cure, Formlabs), and subsequently follow an additional thermal cure in a lab oven at 160 °C for 3 h. See Table S1 in the ESI† for more information of this material.
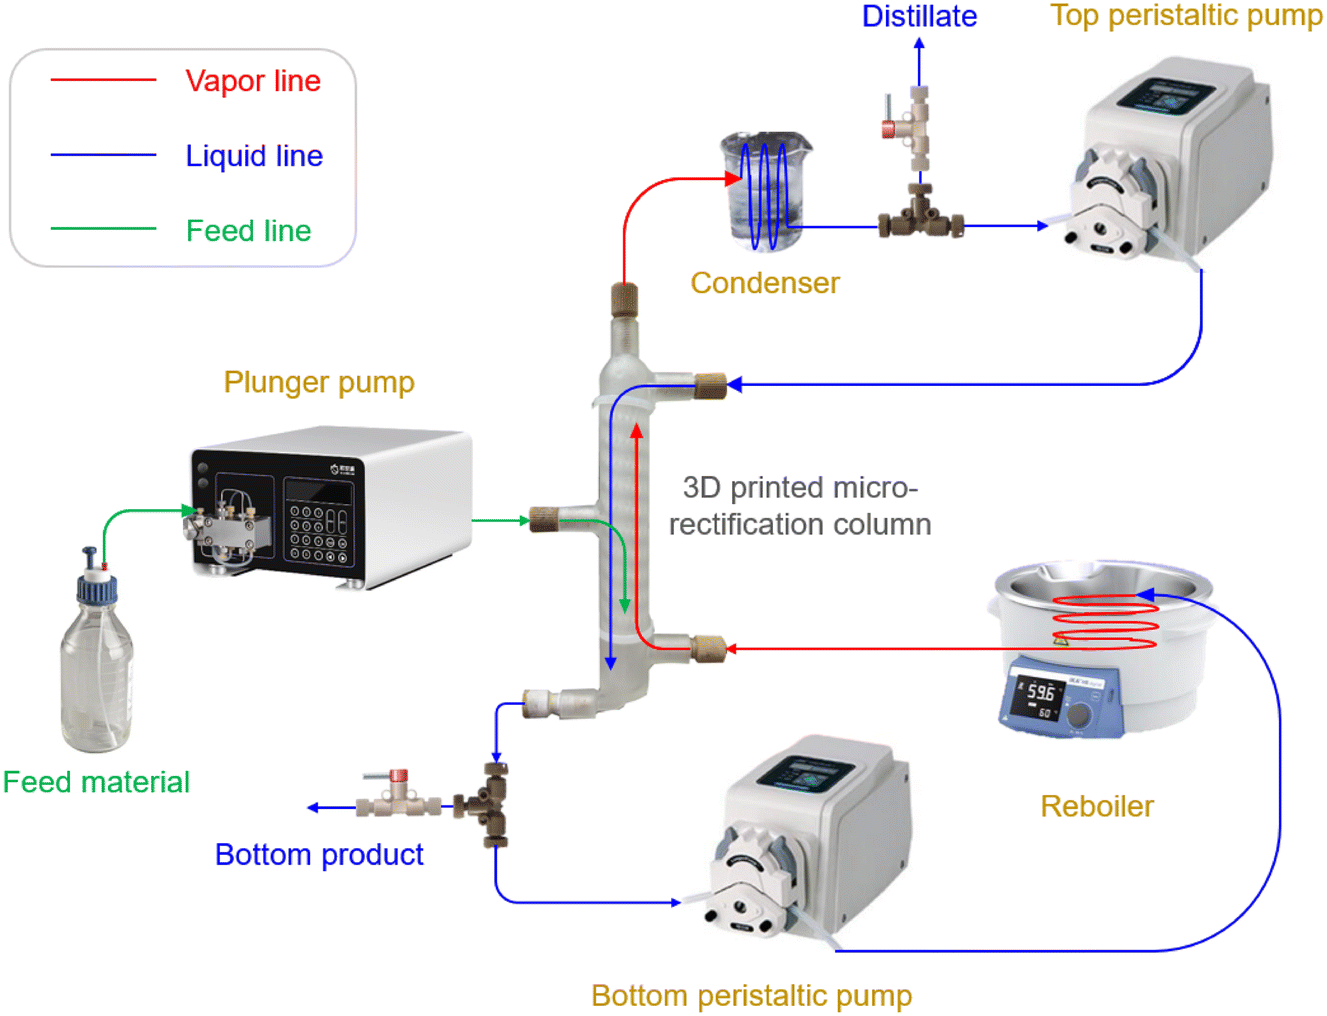 | ||
| Fig. 1 Illustration of the experimental apparatus. | ||
As the key components, we design and engineer three tray microrectification columns with different 3D structures (Fig. 2 and S2–S4 in the ESI†). In contrast to previously reported microrectification devices that were based on simple-shape tubing or channels, we take full advantage of 3D printing to manufacture the rectification column into a monolithic piece, which consists of a top part for distillate, a bottom part for bottom products (see the structures in Fig. S5 of the ESI†), and tray/packed columns with a feed inlet. The printing accuracy of the 3D printer is 25 μm, and thus the smallest characteristic length of our structures is limited to 300 μm. Therefore, considering the order of magnitude of the characteristic dimensions, we select the column diameter in the order of 10 millimeters to implement the fine structures for enhanced gas–liquid contact. The main channel of each column has an inner diameter of 14.0 mm and a height of ∼141 mm by design. Each column has three inlets and two outlets, all of which are designed to fit a PEEK fitting (IDEX) using ¼-28 threads. The feed inlet is located in the middle of the column and can be adjusted according to the design demand. The height of the column is flexible and alterable, as increasing the height (i.e., adding the number of trays) or connecting more columns in series can improve its separation performance.
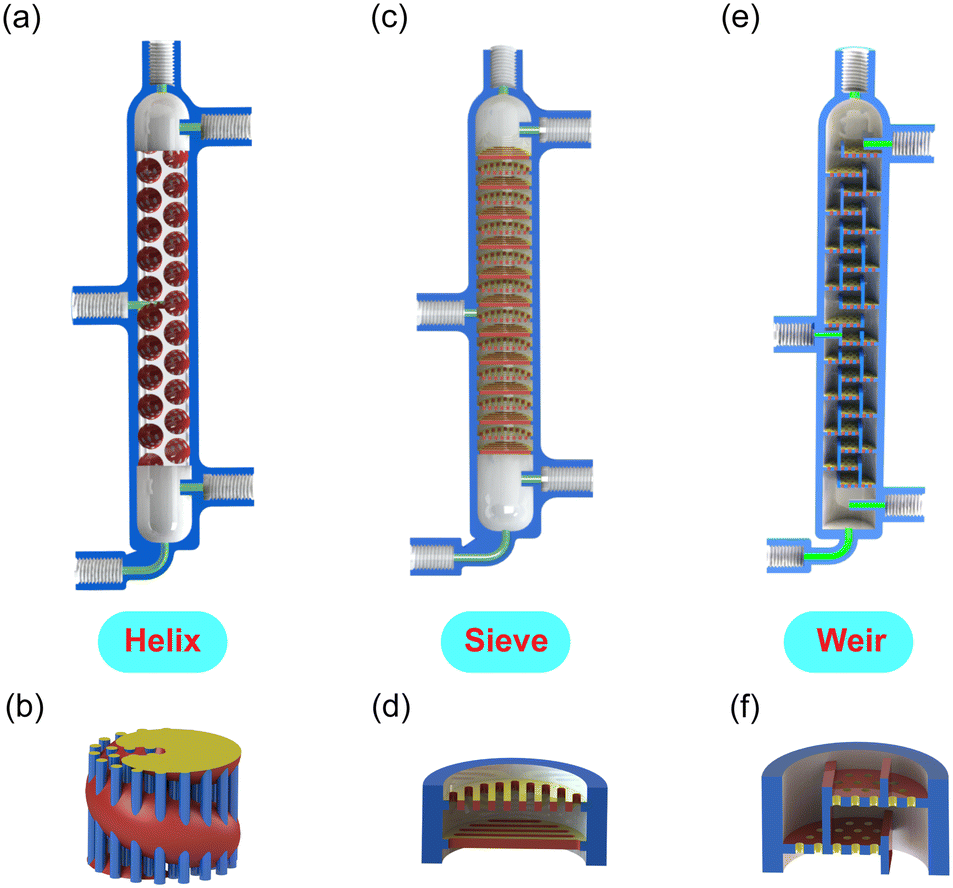 | ||
| Fig. 2 Illustration of the tray columns, i.e., (a and b) helix, (c and d) sieve, and (e and f) weir structures. In order to better display the 3D structure, (b) shows the pathway through which the gas–liquid fluids flow, while (d) and (f) show half the structural units. | ||
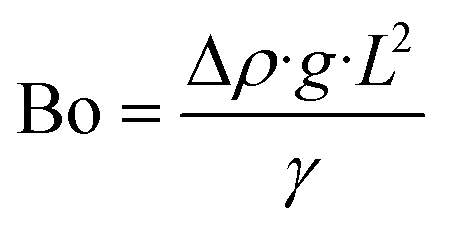
In this length scale, the Bond number (Bo), also called the Eötvös number (Eo) in fluid dynamics, is an important dimensionless quantity that represents the relative effect of gravitational forces versus surface tension forces, as defined in eqn (1).
 | (1) |
Here, Δp is the difference in density of the two phases, g is the gravitational acceleration (9.81 m s−2), L is the characteristic length, and γ is the surface tension. The value of Bo determines the dominant force in microrectification; in particular, a Bo ≫ 1 indicates a process similar to conventional gravity rectification.
In order to enhance the gas–liquid contact, our designed tray columns all have a large specific surface area. (i) The helix structure is based on a coiled channel (diameter 6.6 mm) with multiple inserted small straight channels (diameter 0.5 mm), as illustrated in Fig. 2a, b and S2 in the ESI.† By design, the liquid travels down along the red coiled channel while the vapor rises through the blue straight channels (Fig. 2b). The vapor and liquid are mixed in the intersection of channels. The smallest feature in this design is 0.5 mm. (ii) The second design (sieve) is based on a simple perforated sieve plate with the smallest feature of 0.7 mm (Fig. 2c, d and S3 in the ESI†). A rotation angle of 90 degrees exists between any two adjacent plates. (iii) The next structure (weir) is more likely a miniature version of a conventional tray column with overflow weirs, in which plates with holes are rotated and stacked together (Fig. 2e, f and S4 in the ESI†). The diameter of the holes on the tray, as the smallest feature, is 0.4 mm. In addition, we compare the separation results of the above tray columns with (iv) a packed column, i.e., an empty channel of the same size filled with sphere packings (mean diameter 2.0 mm). Detailed dimensions, the porosity of columns, and the calculated Bo numbers with n-hexane/cyclohexane of all structures are summarized in Table 1 and S2 in the ESI.†
| Type | Structure | Volume, m3 | Porosity, % | Bo |
|---|---|---|---|---|
| Tray | Helix | 8.92 × 10⁻⁶ | 70.8 | 0.0959 |
| Tray | Sieve | 1.08 × 10⁻⁵ | 85.7 | 0.188 |
| Tray | Weir | 1.14 × 10⁻⁵ | 79.7 | 0.0614 |
| Packed | Sphere | 5.57 × 10⁻⁶ | 44.2 | 0.0345 |
For all columns, even though their diameters are on the centimeter scale, we refer to them as the microrectification column because (i) the smallest feature of the column structure is on the microscale, and (ii) the calculated Bo numbers are much smaller than 1, indicating that surface tension forces dominate over gravitational forces.
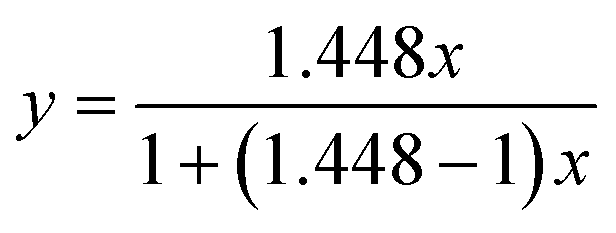
We use the binary mixture of n-hexane (boiling point 68.7 °C) and cyclohexane (boiling point 80.7 °C) as a model system, with a small boiling point difference of 12 °C. The calculated mean relative volatility of n-hexane to cyclohexane is 1.448, indicating that the separation using rectification is challenging, whereas more theoretical stages and a higher reflux ratio may be necessary. We draw the McCabe–Thiele diagram using the vapor–liquid equilibrium data (eqn (2)) for the component with the lower boiling point (i.e., n-hexane). This equilibrium curve is flat and close to the diagonal line of the diagram.
 | (2) |
We begin by running the device at 1 atm and infinite reflux ratio (i.e., full-reflux operation). The mixture of n-hexane and cyclohexane is fed into the column using a plunger pump (Oushisheng, # DP-H200) through the central inlet at room temperature. Heat loss is prevented by wrapping the column with insulating tape. The reboiler, using an oil bath, is pre-heated to 100 °C. Once the fed liquid reaches a certain level in the column, all inlets/outlets are blocked to form a closed system. After the liquid filled the bottom region of the column, the less volatile component enriches and flows toward the bottom plate, which subsequently exits the column through the bottom outlet. Then, we turn on the bottom peristaltic pump (Longer, # BT100-3J) to recirculate the whole liquid through a coiled PFA tube (inner diameter 1.59 mm, outer diameter 3.18 mm) immersed in the 100 °C oil bath to reboil.
We notice that controlling liquid boiling in a small-scale channel is challenging due to the reduced nucleation, as surface effects play an important role during flow boiling in microchannels. In the absence of dissolved gas or surface nucleation sites, liquid is easily superheated during flow without boiling.35 In order to prevent the formation of superheated liquid mixtures, we employ in-house designed inline mixers (Fig. S6 in the ESI†) as well as sphere ceramic packings (mean diameter 1 mm) in the PFA tube to generate nucleation. Visible boiling is therefore observed on the surface of the mixer/packings.
After the vaporized stream enters the column through the bottom inlet, the main stream is heated up and the liquid level gradually decreases. The vapor rises from the bottom of the column through the liquids, where heat and mass transfer occur during contact. The vapor enriches with the more volatile component to rise towards the top plate, exits the column from the top outlet, and is cooled down using the ice bath at 0 °C. We then turn on the top peristaltic pump, ensuring that all the condensed liquid returns to the column. After reflux begins, batchwise samples are taken every five minutes from both the top (distillate) and the bottom (bottom product) using valves, and their compositions are subsequently determined by gas chromatography (FULI, GC9720 plus). Each time after sample collection, we pump a small amount of feed materials into the column at a low flow rate to compensate for the liquid level, ensuring that there is a sufficient amount of condensed liquid accumulated in the top column vial at the next sampling.
When the full-reflux operation reaches steady state, indicated by stable and constant GC measurements, we operate the microrectification column continuously. We control the feed flow rate at 0.5–1.0 mL min−1 and remove the distillate and bottom products continuously. The two peristaltic pumps, located at the top and the bottom, are used to control the reflux ratio (R) and the reboiling ratio, respectively. During experiments, we keep the liquid level at a certain height in the bottom region to ensure a stable operation. In this mode, the temperature decreases from the bottom to the top along the column, while the pressure remains nearly constant (1 atm).
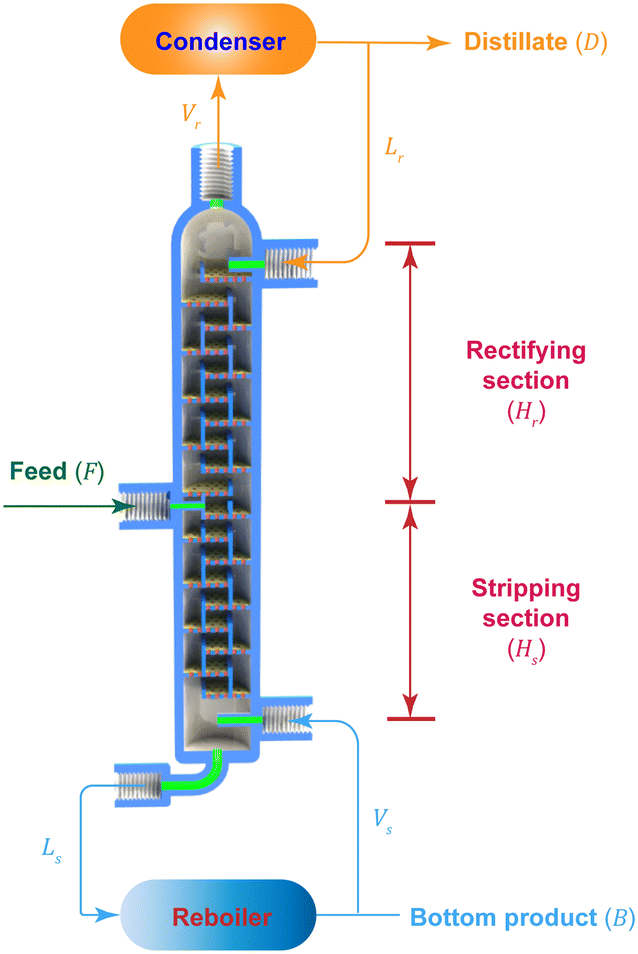
We use the McCabe–Thiele method36 to determine the number of theoretical plates (N), as an evaluation of the performance of a rectification column. The height equivalent of a theoretical plate (HETP) is further calculated by the ratio of the column height that consists of the heights of the rectifying section (Hr) and the stripping section (Hs), and N (eqn (3)).
 | (3) |
During the full-reflux operation, it takes about 30 min for the system to reach a dynamic equilibrium. To reduce the duration of the startup, a higher reboiler temperature is recommended. Fig. 3 and Table 2 illustrate the separation of approximately equimolar amounts of n-hexane/cyclohexane performed at R → ∞. The reboiler temperature of 100 °C is high enough for a portion of the stream to vaporize; when this temperature is lower (i.e., 80–100 °C), there is not enough vapor that could enter the condenser at the top. When the reboiled stream enters the column, it is visible that violent gas–liquid mixing occurs on the surface of plates/packings. The helix structure performs the best, with 8.2 theoretical stages at total reflux ratio, achieving 89.4 mol% n-hexane as the distillate. The resulting HETP is as low as 10.0 mm. The weir structure has 7.7 theoretical stages, while the sieve structure performs similarly to the packed column (both have N ≈ 6.0), although their porosities are very different.
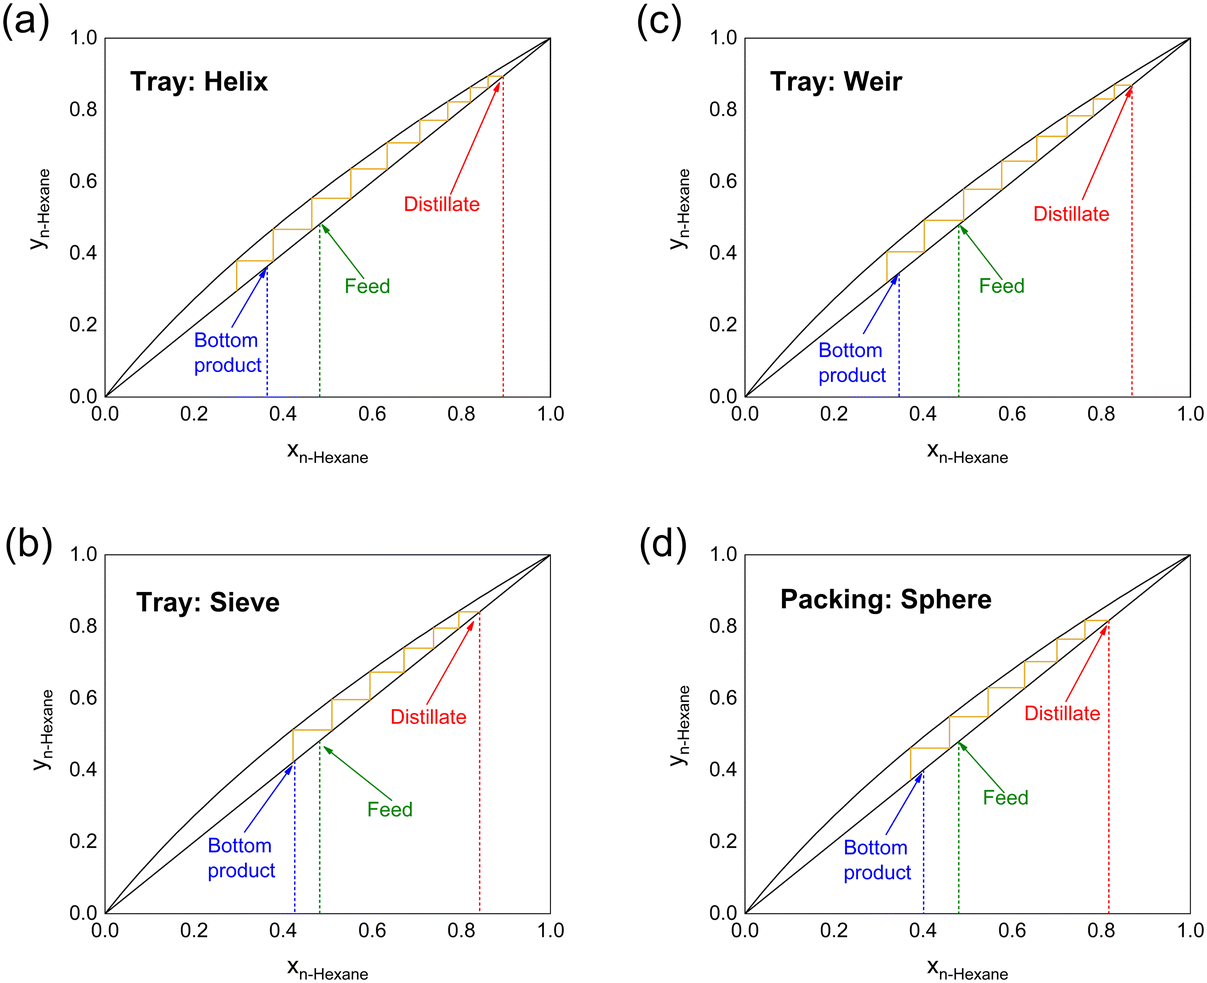 | ||
| Fig. 3 McCabe–Thiele diagram of n-hexane/cyclohexane at total reflux ratio, with tray columns of (a) helix, (b) sieve, and (c) weir structures, and (d) the column with sphere packings. Conditions used in the experiments: 1 atm and 25 °C inlet temperature. | ||
| Structure | Feed, mol% | Distillate, mol% | Bottom product, mol% | N | HETP, mm |
|---|---|---|---|---|---|
| Helix | 48.2 | 89.4 | 36.4 | 8.2 | 10.0 |
| Sieve | 49.1 | 84.1 | 42.6 | 6.0 | 13.7 |
| Weir | 48.0 | 86.9 | 34.6 | 7.7 | 10.6 |
| Sphere | 48.0 | 81.7 | 40.1 | 5.7 | 14.4 |
The helix structure has the best performance because its unique structure increases the gas–liquid contact and in the meantime makes it less prone to flooding; however, in the sieve structure, due to the lack of an overflow weir, the column is prone to flooding, resulting in a decrease in separation capacity.
At the full-reflux steady state, an additional 20 min is required for the system to achieve a dynamic equilibrium in the continuous mode (i.e., with continuous feed of raw materials and removal of distillate/bottom products). During experiments, when the flow rate of the feed exceeds 1.0 mL min−1, the operation becomes more difficult to control and requires more energy input, i.e., higher reboiler temperature and better condensation. In this work, a cold liquid or saturated liquid is employed under the feed conditions, indicating q ≥ 1, where the factor q is the moles of the liquid flow in the stripping section that result from the introduction of each mole of feed. When the feed temperature is 25 °C, the calculated q is 1.218. The feed line equation is eqn (4), where xF is the concentration of n-hexane.
 | (4) |
After the feed line is located, we are able to construct the operating lines using the McCabe–Thiele procedure.36 The minimum reflux ratio (Rmin) could be further determined. Fig. 4 and Table 3 illustrate the McCabe–Thiele diagram of n-hexane/cyclohexane at R = 4.0. The helix column performs the best in this continuous mode, achieving 78.0 mol% of n-hexane as the distillate; eight theoretical stages are required to reach this separation result; and Rmin is 2.13. The weir and sphere structures achieve a similar distillate composition (∼74 mol% n-hexane). The sieve structure has the worst performance, consistent with the full-reflux mode, which may be improved by increasing the complexity of the structure and the tortuosity of the fluid pathway.
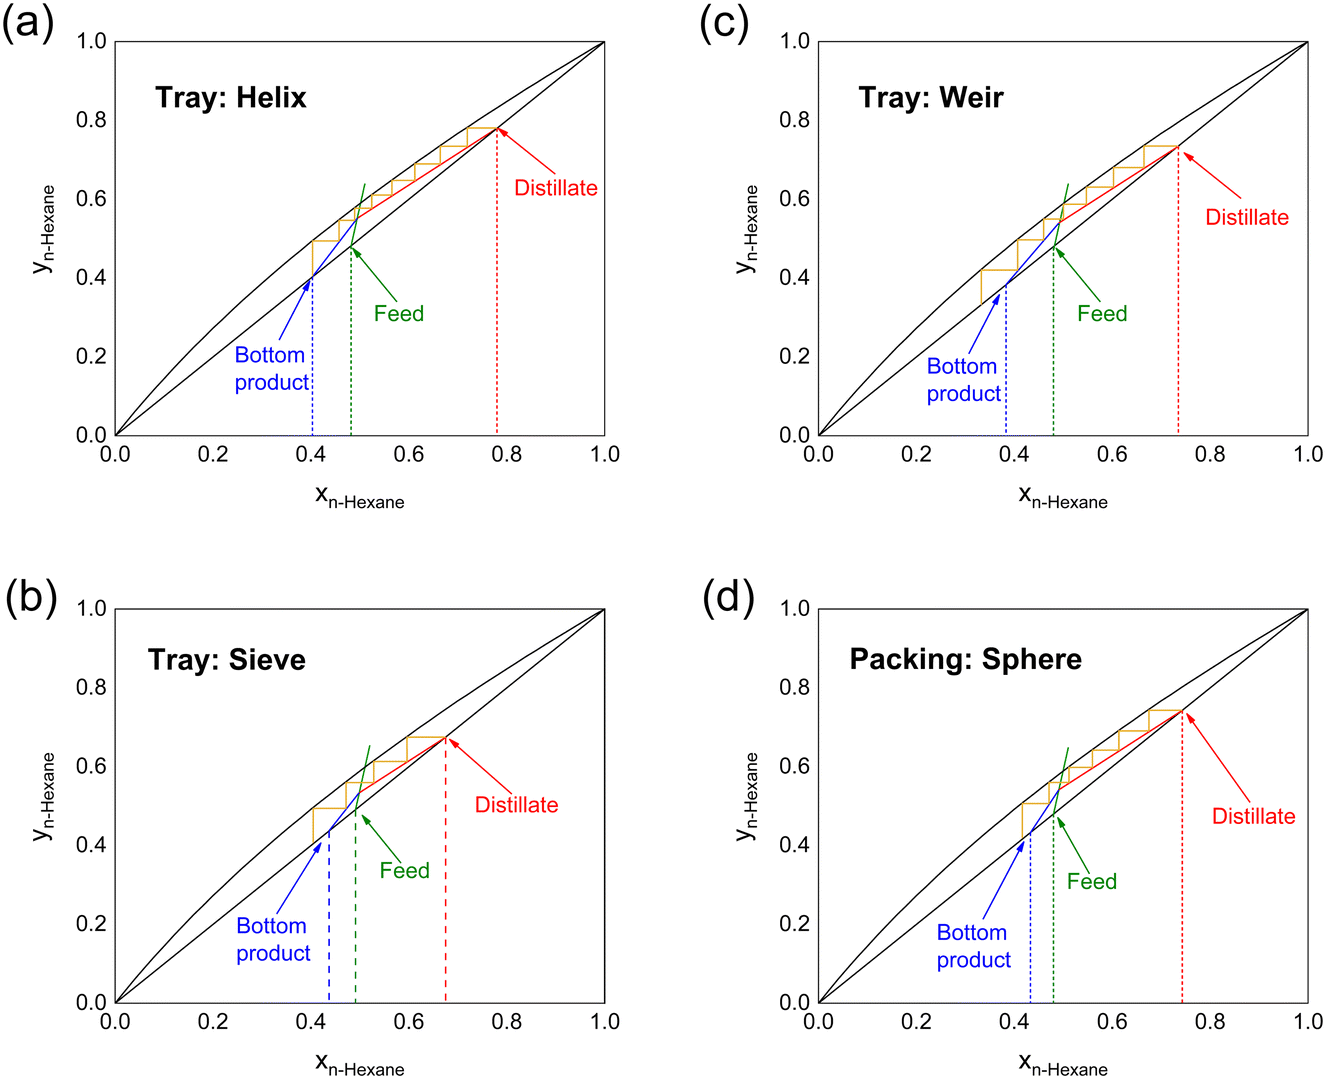 | ||
| Fig. 4 McCabe–Thiele diagram of n-hexane/cyclohexane at a reflux ratio of 4.0, with tray columns of (a) helix, (b) sieve, and (c) weir structures, and (d) the column with sphere packings. The green, red, and blue solid lines denote the feed line, rectifying line, and stripping line, respectively. Conditions used in the experiments: 1 atm and 25 °C inlet temperature. | ||
| Structure | Feed, mol% | Distillate, mol% | Bottom product, mol% | N | HETP, mm |
|---|---|---|---|---|---|
| Helix | 48.2 | 78.0 | 40.3 | 8.0 | 10.3 |
| Sieve | 49.1 | 67.5 | 45.7 | 3.6 | 22.8 |
| Weir | 48.0 | 73.5 | 38.3 | 6.4 | 12.8 |
| Sphere | 48.0 | 74.3 | 43.3 | 5.8 | 14.1 |
For continuous operation of small-scale rectification columns, it remains very difficult to manipulate the temperature profiles along the column, and therefore controlling the reflux ratio becomes crucial for better performance. Using peristaltic pumps enables good process control, especially the control of reflux and reboiling ratios, therefore maintaining an essential temperature gradient through good gas–liquid mass transfer.
The above discussion is based on the fixed column height and feed location, i.e., fixed Hr and Hs. However, the efficiency of most columns in this work is better than previously reported 3D printed tubular column structures32 (see Table S3 in the ESI† for more information). Due to the small mean relative volatility of n-hexane to cyclohexane, the highest concentration of n-hexane as the distillate, in those columns, is still below 90 mol%. Even though fabricating a higher column (i.e., more theoretical stages) or connecting multiple columns in series could further improve the performance, it would be tedious to repeat those separation experiments in the lab, especially more time is required for a larger-volume platform to reach a steady state operation.
In order to assist microrectification column design, we develop a one dimensional (1D) mathematical model (see Fig. 5 for the model geometry) to determine the mass transfer coefficient that helps find the optimal values of Hr and Hs for specific separation tasks. To simplify the model, we assume the (i) constant molar overflow, (ii) negligible heat loss, (iii) negligible redial variations, (iv) nearly saturated liquid feed, and (v) ideal gas. Based on those assumptions, only the mass balance equations dictate the rectification column performance.
 | ||
| Fig. 5 1D mass transfer model of the microrectification geometry. | ||
The overall and species mass balances in a binary system are presented by eqn (5) and (6), where F, D, and B are the molar rates of the feed, distillate, and bottom product, respectively, and xF, xD, and xB represent their molar concentrations.
| F = D + B | (5) |
| FxF = DxD + BxB | (6) |
The mass balances of the vapor and liquid phases are calculated using eqn (7) and (8), where L and V are the molar rates of the liquid and vapor, and the subscript s and r denote the stripping and rectifying sections, respectively.
| F = Ls − Lr | (7) |
| Vs = Vr | (8) |
To relate L and V, a mass balance of the distillate stream is calculated using eqn (9).
| D = Vr − Lr | (9) |
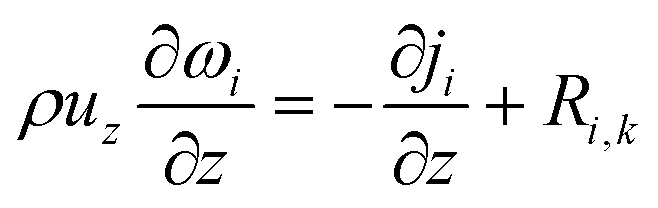
The 1D mass conservation equation (z-direction) of vapor and liquid phases is separately described as eqn (10), where the subscript i stands for s or r, and ω is the mass fraction.
 | (10) |
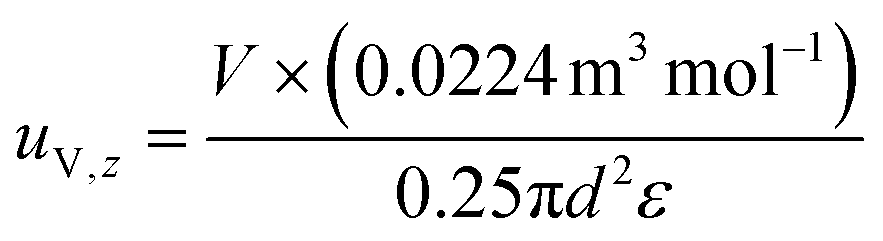
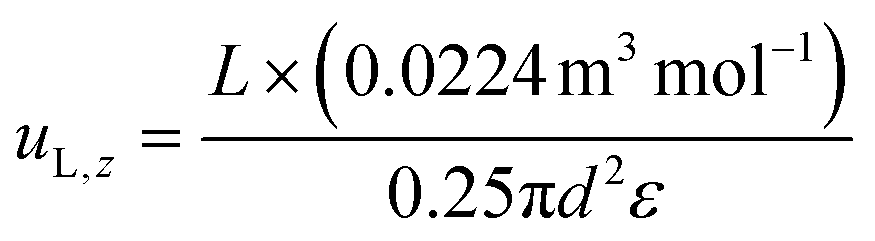
See the ESI† for the calculation of the diffusive mass flux (ji) and the boundary conditions. The z-directional velocities of vapor and liquid phases (i.e., uV,z and uL,z) are in opposite directions and calculated based on the diameter (d) and porosity (ε) of the column (eqn (11) and (12)).
 | (11) |
 | (12) |
The source term (Ri,k), in kg (m−3 s−1), represents the mass transfer rate between both phases (eqn (13) and (14)), where the subscript k denotes the more volatile (n-hexane, subscript HEX) or the less volatile (cyclohexane, subscript CYH) species.
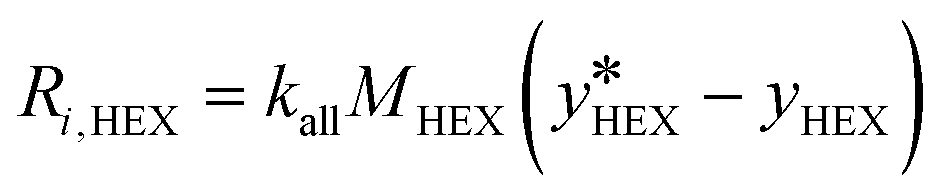 | (13) |
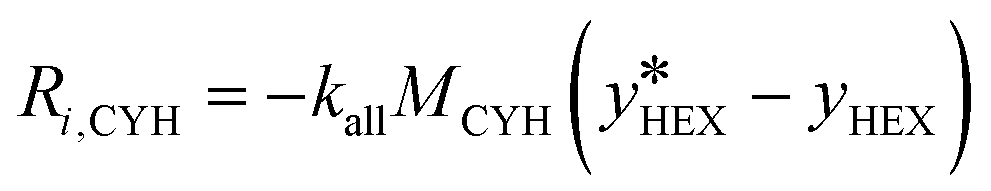 | (14) |
Here,  is the equilibrium concentration, kall is the overall mass transfer coefficient of the more volatile phase in mol (m−3 s−1), and M is the molecular weight. kall is an important parameter to reflect the multiphase mass transfer behavior, which is determined by the column structure as well as the fluid dynamics.37 In our approach, kall could be fitted and obtained using Comsol Multiphysics by inputting the model geometry and the concentrations of the distillate and bottom product as boundary conditions. Table 4 summarizes the fitted values of kall in all columns. The helix structure, with the smallest HETP, has the largest kall of 35.6 mol (m−3 s−1).
| Structure | Helix | Sieve | Weir | Sphere |
|---|---|---|---|---|
| k all, mol (m−3 s−1) | 35.6 | 12.9 | 29.3 | 22.5 |
We assume that the value of kall remains constant with a different column height, and then we are able to design the column (i.e., Hr and Hs) with certain requirements of the feed, distillate, and bottom product concentrations (i.e., xF, xD, xB). With kall known, we take those target concentrations as new boundary conditions and re-run the simulation, by varying Hr and Hs, until a matching result of the vapor and liquid concentrations in the distillate as well as in the bottom product is obtained.
As an illustration at R = 4, to reach a separation requirement of n-hexane and cyclohexane (i.e., xD = 95%, xF = 50%, xB = 5%) using the helix structure, the column height (Hr + Hs) needs to be 0.63 m and Hr is 0.39 m; while for the sieve structure, (Hr + Hs) needs to be increased to 1.38 m and Hr is 0.66 m.
In conclusion, we develop a microrectification assembly for the separation of a binary liquid mixture with close boiling points. We engineer three tray column structures and one packed structure for 3D printing, with smallest features at the microscale to enhance the gas–liquid mass transfer. In the experiments using approximately equimolar amounts of n-hexane and cyclohexane, the helix structure performs the best, achieving 89.4 mol% (R → ∞) and 78.0 mol% (R = 4) n-hexane as the distillate, which correspond to HETP values of 10.0 mm and 10.3 mm, respectively. Using the experimental data, we further develop a 1D mass transfer model to estimate the gas–liquid mass transfer coefficient (kall) that assists the optimal microrectification column design (i.e., Hr and Hs). The helix structure has the largest kall of 35.6 mol (m−3 s−1) in comparison to other structures. Our low-volume rectification process with 3D printed columns demonstrates an efficient separation technique, and potentially could be implemented in flow synthesis and scaled out using multiple columns in series.
Conflicts of interest
There are no conflicts to declare.Acknowledgements
We thank the National Natural Science Foundation of China (22378347 and 21908190), the State Key Laboratory of Chemical Engineering (SKL-ChE-22D04), and the National Key Research and Development Program of China (2018YFA0704601) for financial support.Notes and references
- J. G. Stichlmair, H. Klein and S. Rehfeldt, Distillation: principles and practice, John Wiley & Sons, 2021 Search PubMed.
- A. A. Kiss, J. Chem. Technol. Biotechnol., 2014, 89, 479–498 CrossRef CAS.
- Z. Lei, C. Li and B. Chen, Sep. Purif. Rev., 2003, 32, 121–213 CrossRef CAS.
- V. Gerbaud, I. Rodriguez-Donis, L. Hegely, P. Lang, F. Denes and X. You, Chem. Eng. Res. Des., 2019, 141, 229–271 CrossRef CAS.
- K. W. Lawson and D. R. Lloyd, J. Membr. Sci., 1997, 124, 1–25 CrossRef CAS.
- A. Alkhudhiri, N. Darwish and N. Hilal, Desalination, 2012, 287, 2–18 CrossRef CAS.
- E. Drioli, A. Ali and F. Macedonio, Desalination, 2015, 356, 56–84 CrossRef CAS.
- A. K. Jana, Energy Convers. Manage., 2014, 77, 287–297 CrossRef CAS.
- Z. Fonyo and N. Benkö, Chem. Eng. Res. Des., 1998, 76, 348–360 CrossRef CAS.
- M. Al-Shammiri and M. Safar, Desalination, 1999, 126, 45–59 CrossRef CAS.
- H. K. Engelien and S. Skogestad, Chem. Eng. Process., 2005, 44, 819–826 CrossRef CAS.
- R. Srinivasan, I. M. Hsing, P. E. Berger, K. F. Jensen, S. L. Firebaugh, M. A. Schmidt, M. P. Harold, J. J. Lerou and J. F. Ryley, AIChE J., 1997, 43, 3059–3069 CrossRef CAS.
- K. F. Jensen, AIChE J., 1999, 45, 2051–2054 CrossRef CAS.
- K. F. Jensen, Chem. Eng. Sci., 2001, 56, 293–303 CrossRef CAS.
- A. Adamo, R. L. Beingessner, M. Behnam, J. Chen, T. F. Jamison, K. F. Jensen, J. C. Monbaliu, A. S. Myerson, E. M. Revalor, D. R. Snead, T. Stelzer, N. Weeranoppanant, S. Y. Wong and P. Zhang, Science, 2016, 352, 61–67 CrossRef CAS PubMed.
- K. P. Cole, J. M. Groh, M. D. Johnson, C. L. Burcham, B. M. Campbell, W. D. Diseroad, M. R. Heller, J. R. Howell, N. J. Kallman, T. M. Koenig, S. A. May, R. D. Miller, D. Mitchell, D. P. Myers, S. S. Myers, J. L. Phillips, C. S. Polster, T. D. White, J. Cashman, D. Hurley, R. Moylan, P. Sheehan, R. D. Spencer, K. Desmond, P. Desmond and O. Gowran, Science, 2017, 356, 1144–1150 CrossRef CAS PubMed.
- C. Liu, J. Xie, W. Wu, M. Wang, W. Chen, S. B. Idres, J. Rong, L. W. Deng, S. A. Khan and J. Wu, Nat. Chem., 2021, 13, 451–457 CrossRef CAS PubMed.
- E. Y. Kenig, Y. Su, A. Lautenschleger, P. Chasanis and M. Grünewald, Sep. Purif. Technol., 2013, 120, 245–264 CrossRef CAS.
- E. K. Sackmann, A. L. Fulton and D. J. Beebe, Nature, 2014, 507, 181–189 CrossRef CAS PubMed.
- R. L. Truby and J. A. Lewis, Nature, 2016, 540, 371 CrossRef CAS PubMed.
- J.-Y. Lee, J. An and C. K. Chua, Appl. Mater. Today, 2017, 7, 120–133 CrossRef.
- H. Zhang, T. Kopfmüller, R. Achermann, J. Zhang, A. Teixeira, Y. Shen and K. F. Jensen, AIChE J., 2020, 66, e16873 CrossRef CAS.
- Y. Feng, H. Mu, X. Liu, Z. Huang, H. Zhang, J. Wang and Y. Yang, Ind. Eng. Chem. Res., 2020, 59, 8447–8455 CrossRef CAS.
- P. J. Kitson, G. Marie, J. P. Francoia, S. S. Zalesskiy, R. C. Sigerson, J. S. Mathieson and L. Cronin, Science, 2018, 359, 314–319 CrossRef CAS PubMed.
- Y. Feng, H. Zhang, J. Wang and Y. Yang, Ind. Eng. Chem. Res., 2021, 60, 11568–11578 CrossRef CAS.
- K. F. Lam, E. Cao, E. Sorensen and A. Gavriilidis, Lab Chip, 2011, 11, 1311–1317 RSC.
- R.-J. Yang, C.-C. Liu, Y.-N. Wang, H.-H. Hou and L.-M. Fu, Chem. Eng. J., 2017, 313, 1509–1520 CrossRef CAS.
- A. Sundberg, P. Uusi-Kyyny and V. Alopaeus, Chem. Eng. Res. Des., 2009, 87, 705–710 CrossRef CAS.
- A. T. Sundberg, P. Uusi-Kyyny, K. Jakobsson and V. Alopaeus, Chem. Eng. Res. Des., 2013, 91, 753–760 CrossRef CAS.
- A. Ziogas, V. Cominos, G. Kolb, H. J. Kost, B. Werner and V. Hessel, Chem. Eng. Technol., 2012, 35, 58–71 CrossRef CAS.
- R. L. Hartman, H. R. Sahoo, B. C. Yen and K. F. Jensen, Lab Chip, 2009, 9, 1843–1849 RSC.
- S. Mardani, L. S. Ojala, P. Uusi-Kyyny and V. Alopaeus, Chem. Eng. Process., 2016, 109, 136–148 CrossRef CAS.
- J. M. MacInnes, J. Ortiz-Osorio, P. J. Jordan, G. H. Priestman and R. W. K. Allen, Chem. Eng. J., 2010, 159, 159–169 CrossRef CAS.
- J. M. MacInnes and A. A. Ayash, Chem. Eng. Sci., 2018, 175, 320–334 CrossRef CAS.
- D. Deng, L. Zeng and W. Sun, Int. J. Heat Mass Transfer, 2021, 175, 121332 CrossRef.
- W. L. McCabe, J. C. Smith and P. Harriott, Unit operations of chemical engineering, McGraw-hill, 1993 Search PubMed.
- H. Zhang, A. Ladosz and K. F. Jensen, AIChE J., 2022, 68, e17455 CrossRef CAS.
Footnote |
| † Electronic supplementary information (ESI) available. See DOI: https://doi.org/10.1039/d3re00560g |
| This journal is © The Royal Society of Chemistry 2024 |