
 Open Access Article
 This Open Access Article is licensed under a Creative Commons Attribution-Non Commercial 3.0 Unported Licence
Creating covalent bonds between Cu and C at the interface of metal/open-ended carbon nanotubes†
Chaminda P.
Nawarathne
a,
Diego Galvez
Aranda
b,
Abdul
Hoque
 a,
Gabrielle R.
Dangel
a,
Jorge M.
Seminario
*b and
Noe T.
Alvarez
*a
a,
Gabrielle R.
Dangel
a,
Jorge M.
Seminario
*b and
Noe T.
Alvarez
*a
aDepartment of Chemistry, University of Cincinnati, Cincinnati, OH 45221, USA. E-mail: alvarene@ucmail.uc.edu
bThe Department of Chemical Engineering, Texas A&M University, College Station, TX 77843, USA. E-mail: seminario@tamu.edu
First published on 25th November 2023
Abstract
The unique electrical properties of carbon nanotubes (CNTs) are highly desired in many technological applications. Unfortunately, in practice, the electrical conductivity of most CNTs and their assemblies has fallen short of expectations. One reason for this poor performance is that electrical resistance develops at the interface between carbon nanomaterials and metal surfaces when traditional metal–metal type contacts are employed. Here, a method for overcoming this resistance using covalent bond formation between open-ended CNTs and Cu surfaces is investigated experimentally and supported by theoretical calculations. The open-ended CNTs are vertically oriented compared to the substrate and have carboxylic functional groups that react with aminophenyl groups (linkers) grafted on metal surfaces. The covalent bond formation, crosslinking carboxylic and amine, via amide bond formation occurs at 120 °C. The covalent bonding nature of the aminophenyl linker is demonstrated theoretically using (100), (110), and (111) Cu surfaces, and bridge-like bond formation between carbon and two adjacent Cu atoms is revealed. The electrical conductivity calculated for a single intramolecular-type junction supports covalent bond formation between Cu and CNTs. Experimentally, the robustness of the covalent bonding between vertically oriented CNTs is tested by exposing CNTs on Cu to sonication, which reveals that CNTs remain fixed to the Cu supports. Since bonding CNTs to metals was performed at low temperatures, the reported method of covalent bond formation is expected to facilitate the application of CNTs in multiple fields, including electronics.
1. Introduction
Electronic devices play essential roles in our daily life, and the development of smaller, faster electronics is critical for the advancement of human civilization. However, conventional electrically conductive materials have reached their operational limits for the miniaturization of electronics.1 Owing to their excellent physical and chemical properties, carbon nanotubes (CNTs) are considered a potential alternative to existing metallic conductors and Si-based semiconductors for the development of future electronics.2–4 Individual CNTs are cylindrical molecules with extremely small atomic diameters and have structures similar to rolled-up graphene sheets.3 Experimental measurements have revealed that the resistivity of multiwalled CNTs is as low as 5.1 × 10⁻⁶ Ω cm.5 This low resistivity combined with excellent mechanical properties and low density endow CNTs with potential as next-generation conductive materials. In addition, some CNTs show ballistic conductivity at room temperature, which is also advantageous for conductive materials.6 CNTs have been employed as a superior material to conventional metals and semiconductors for the development of conductive wires,7 transistors,8 wearable devices,9 energy storage devices,10 and sensors.11 However, various challenges have delayed the widespread utilization of CNTs in commercial applications. For instance, the controlled synthesis of CNTs is challenging, with particular difficulties associated with regulating the diameter, type, and chirality of CNTs during synthesis processes.12 Furthermore, CNTs must be firmly connected to metals for use in thermal and electrically conductive applications, but the formation of such stable connections remains elusive.2,13 Thus, the formation of mechanically strong bonds between metals and CNTs with decreased interface resistance is crucial for the development of CNT-based electronic applications.The formation of bonds between metals and CNTs is challenging owing to the chemically inert nature of the CNT structure. Furthermore, because there are significant differences in the surface energies of CNTs and metals, some metals cannot wet the CNT surface to form strong interactions. Despite these challenges, significant theoretical and experimental efforts by various research groups over the past two decades have focused on enhancing CNT–metal bonding. Two types of CNT–metal interactions are possible depending on the orientation of the CNT relative to the metal surface, namely, end contact and side contact.14 In side contact, a CNT side wall interacts with a bulk metal surface, whereas in end contact, a CNT tip interacts with a metal surface. Side contact can be realized via direct metal deposition on CNT side walls. For CNT–metal deposits produced by electron-beam evaporation, the type of interaction depends on the metal. In particular, Ti, Ni, and Pd form continuous decorations on CNTs, whereas Au, Al, and Cu form isolated discrete particles.15,16 The formation of continuous deposits indicates that the interactions between CNTs and metals such as Ti and Ni are strong, which is directly related to the electron densities of these metals. Furthermore, these observations have been supported by density functional theory (DFT) calculations, which predict that strong interactions will result in interfaces with low interfacial electrical resistance.14
End contact involving the formation of bonds between CNT open ends and metal is more relevant for electronic applications because this configuration facilitates electron and load transfer at the interface.13,17,18 In fact, theoretical calculations revealed that the resistance in Cu/CNT was more than double for side contact compared to end contact.17 Such open-ended CNT–metal covalent bonding has been observed theoretically for CNT synthesis17,19–21 and experimentally,22,23 where nanoscale metal particles employed in the CNT growth process remain attached to the CNT tip. Unfortunately, covalent bond formation during CNT synthesis cannot be achieved with all metals because the CNT growth process is highly dependent on the type of metallic nanoparticle. In addition, there are a few challenges associated with growing CNTs on Cu, including the poor catalytic activity of Cu for CNT growth. Furthermore, Cu as a support material can poison other deposited metal catalysts, and therefore requires additional Al2O3 buffer layers.24 Therefore, the formation of strong bonds between CNTs and metals such as Cu requires innovative bonding techniques after CNT synthesis.25
Multiple studies have focused on the formation of such metal–CNT end contacts. Milowska et al. have shown improved electrical conductivity of Cu–CNT composites upon sputtering of carefully selected metallic combination followed by heat treatment to form a Cu–M–CNT type interaction.26 Electron beam and heat treatments have been applied to overcome the energy barrier between CNTs and metals, but these techniques require extreme reaction conditions that might not be suitable for CNT–metal bonding in electronic industry.22,27,28 Cu metal has long been used as a conductive material for electronics owing to its superior conductivity and abundance.1 Among open-ended CNT–metal interactions, CNT–Cu bonds with low interfacial resistance are particularly relevant for practical applications. Nevertheless, minimal attention has been dedicated to bonding between bulk Cu metal and CNTs. Direct CNT–Cu attachment leads to the formation of weak interfacial bonds with high resistance.14 According to DFT simulations, proper CNT functionalization29 or connecting CNTs to the metal surface via a short linker molecule is more conducive to achieving low-resistance Cu–CNT interfacial interactions than direct CNT–metal bonding.30 Furthermore, linker molecules have been used for bonding CNT tips to Al and Au.31–34 The bond between the metal and the linker molecule is critical for utilizing linkers as intermediates for CNT–metal bonding. Most previous approaches have relied on the formation of self-assembled monolayers (SAMs) on metal surfaces for linker immobilization. However, the bonds between SAMs and metals involve physisorption rather than chemisorption.35,36 Furthermore, SAM formation is metal specific and is not suitable for Cu. Pinson and co-workers have demonstrated an interesting reaction pathway based on diazonium salts for bond formation between aryl rings and various metal substrates, including Cu. Experimental and DFT simulation results have shown the formation of strong bonds between metals and diazonium salts.37–41 Jiang et al. investigated the chemical nature of the bond between aryl groups and various metal surfaces using DFT simulations.42 Similarly, DFT studies have shown that phenyl radicals interact with Cu surfaces.43 Previously, our team reported the successful chemical connection of Pt and Cu to open-ended CNTs, but progress was limited by challenges associated with experimental characterization at the nanoscale.44
In this study, we used an aminophenyl linker to form covalent bonds between Cu and open-ended CNTs (Fig. 1). The Cu metal surface was functionalized with aminophenyl groups via a spontaneous reaction with a suitable diazonium salt. Subsequent bond formation between the aminophenyl linkers and carboxyl-functionalized vertically aligned carbon nanotubes (VA-CNTs) resulted in successful covalent bonding between Cu surfaces and open-ended CNTs. For the first time, to the best of our knowledge, the covalent bond formation mechanism was validated by DFT calculations and detailed computational experiments, including Bader charge analysis on different Cu crystal lattices. Furthermore, the energy change for each step of the proposed mechanism was validated theoretically. X-ray photoelectron spectroscopy (XPS) and infrared (IR) spectroscopy, with the support of theoretical predictions, were employed to quantify and evaluate the presence of organic groups on the Cu surface. Finally, the bonding strength was evaluated using a series of ultrasonication studies.
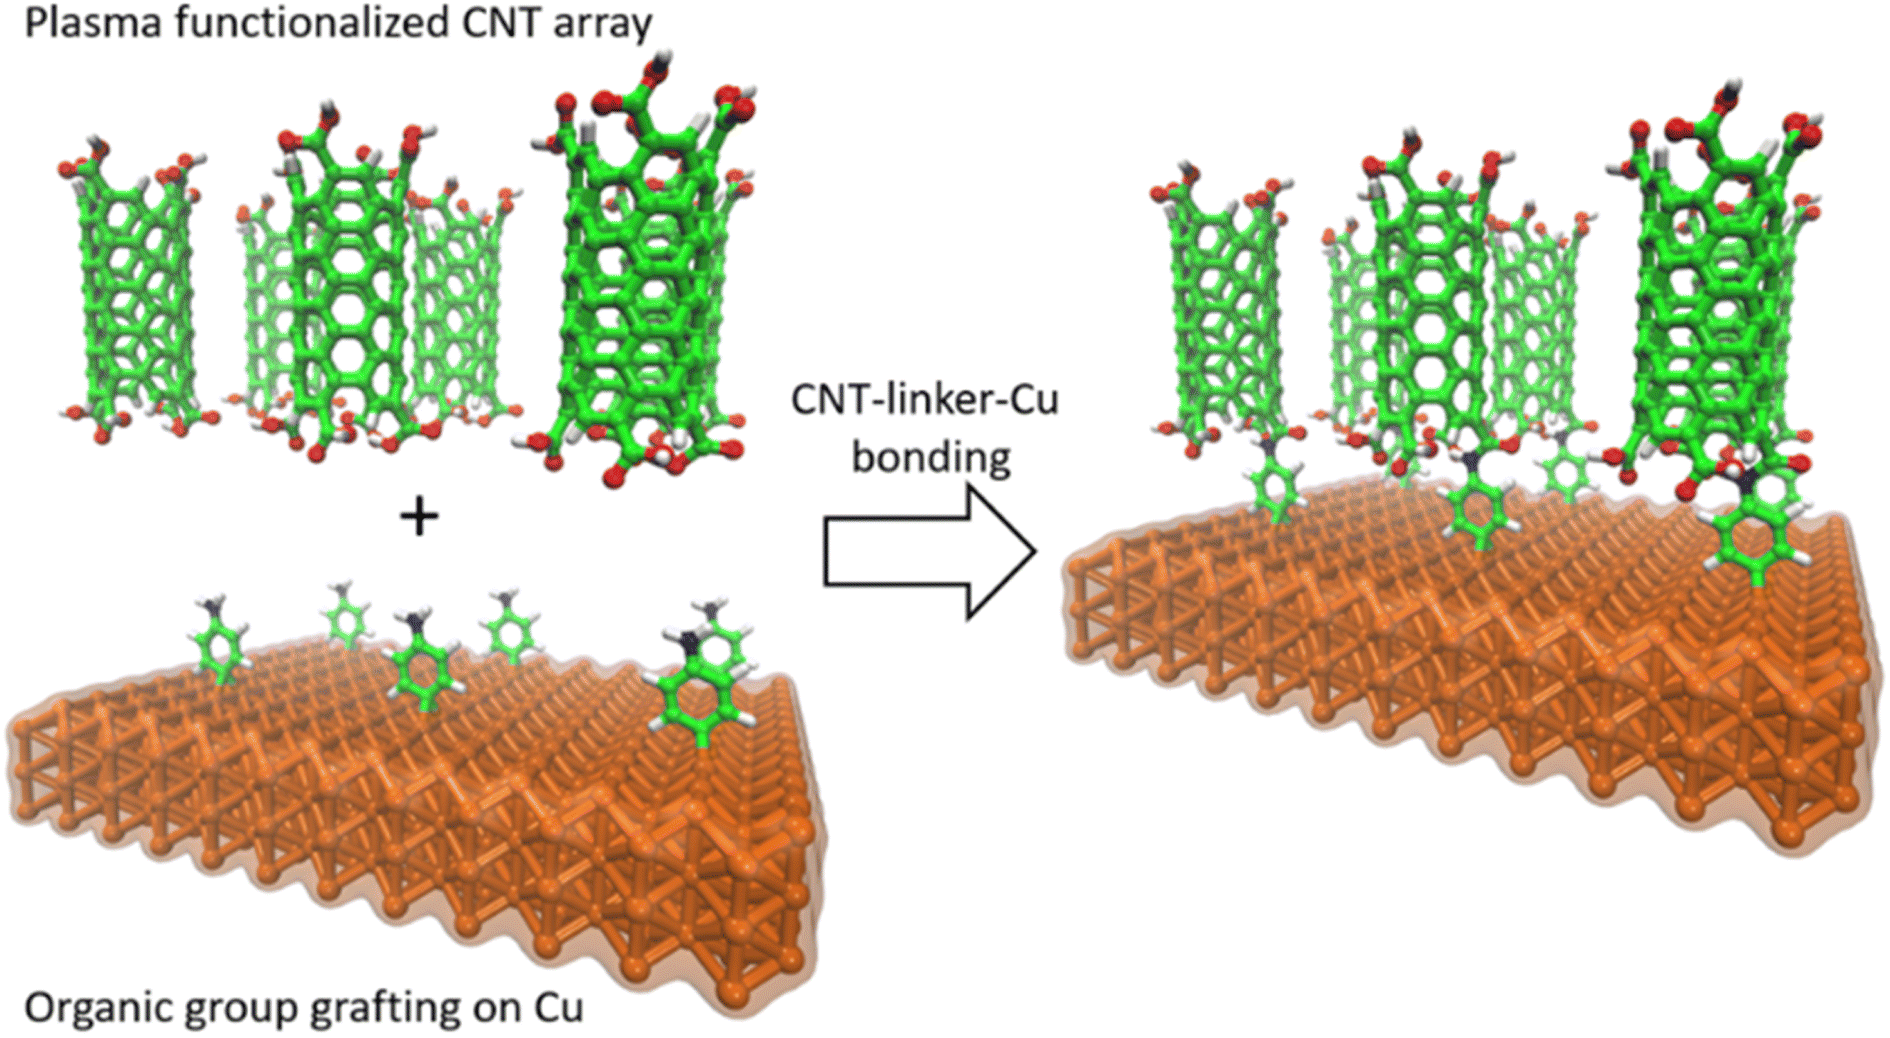 | ||
| Fig. 1 Schematic of covalent bond formation between open-ended CNTs and a crystalline Cu metal surface. Nitrogen (blue), carbon (green), hydrogen (white), oxygen (red), and copper (orange). | ||
2. Experimental section/methods
2.1 Materials
A 6 nm thick Al2O3 layer was deposited on a silicon oxide (silica) substrate as a catalyst support layer. Subsequently, 0.7 nm thick Co and 0.7 nm Fe layers were deposited on the Al2O3 layer as catalysts for CNT growth. Arrays of CNTs with few walls were grown on the catalyst-deposited Si substrate by chemical vapor deposition (CVD) using ethylene and hydrogen as precursor gases in a FirstNano CVD system (CVD Equipment Corporation, Islip, NY, USA). The CNTs are ∼200 μm long and there are about 1011 CNTs cm−2. A detailed description of the CNT growth process has been published elsewhere by our group.45,46 Catalyst particles at the base of the CNT array were oxidized during the CNT growth process to separate the CNTs from the Si wafer. The CNT arrays consisted of vertically aligned individual, orthogonal CNTs held together by weak van der Waals forces between their side walls to form a fragile film with CNT open ends at the top and bottom (Fig. S1†).Sodium nitrite (NaNO2, 99.4%) was obtained from Chem-Impex International Inc. Acetic acid (CH3COOH, 99.0%) was purchased from Fisher Scientific. Nitric acid (HNO3, 95%), hydrochloric acid (HCl, 37%), acetone (99.7%), ethanol (99.8%), and p-phenylenediamine (98%) were purchased from Sigma-Aldrich. All reagents were used as received. Mirror-like multipurpose 110 Cu sheets (McMaster-Carr) were used as the Cu substrate.
2.2 Computational details
Organic group binding to Cu is critical for CNT–Cu bonding via organic linker molecules. To identify the nature of the bonds between Cu and aminophenyl linkers, Cu slab, aminophenyl/Cu slab, and CNT/aminophenyl/Cu slab configurations were optimized for three different Cu planes (100), (110), and (111) using the Born–Oppenheimer approximation and DFT within the projector-augmented wave (PAW) approach to solve the electronic Schrödinger equation with the Perdew–Burke–Ernzerhof (PBE) functional.47,48 During optimization, a plane-wave energy cutoff of 50 Ry (wavelength λ = 0.4 Å) was used. All self-consistent field (SCF) calculations were performed using the Quantum Espresso program.49Additionally, DFT calculations were performed using Gaussian 16![[thin space (1/6-em)]](https://www.rsc.org/images/entities/char_2009.gif) 50 with the B3PW91 functional51,52 and the 6-311++G(d,p) basis set.53,54 The structure of a Cu cluster attached to a CNT through an aminophenyl group was optimized. Water solvation effects were included implicitly via the SMD55 method by adding short-range energy contributions to the polarizable continuum model (PCM)56,57 using the integral equation formalism variant (IEFPCM).58 During optimization, the bond lengths, bond angles, molecular charges, vibrational frequencies and intensities of IR and Raman bands were computed for various CNT–aminophenyl–Cu configurations. The CNTs employed in the simulations are semiconducting single walled CNTs (8,0) and have a length of 15 A.
50 with the B3PW91 functional51,52 and the 6-311++G(d,p) basis set.53,54 The structure of a Cu cluster attached to a CNT through an aminophenyl group was optimized. Water solvation effects were included implicitly via the SMD55 method by adding short-range energy contributions to the polarizable continuum model (PCM)56,57 using the integral equation formalism variant (IEFPCM).58 During optimization, the bond lengths, bond angles, molecular charges, vibrational frequencies and intensities of IR and Raman bands were computed for various CNT–aminophenyl–Cu configurations. The CNTs employed in the simulations are semiconducting single walled CNTs (8,0) and have a length of 15 A.
Periodic slab calculations can describe the band structure of a metal and its interaction with an attached molecule, thus providing accurate information about the charge transfer, bond structure, and vibrational modes.59 First, structural optimization was performed to determine the equilibrium geometry of the aminophenyl groups on (100), (110), and (111) Cu surfaces. Then, the vibrational modes of the entire structure were obtained.
Bader charge distributions for different CNT–metal contacts along the CNT axis were used to indicate if electron accumulation occurred at the interface, which would induce a dipole at the CNT–metal contact.62 Similarly, electron transport along different CNTs was studied by Ketolainen et al.63 using Bader charge analysis as an indicator of charge transfer.
2.3 Organic layer formation on Cu surfaces
A mirror-polished Cu sheet was ultrasonicated in acetone for 1 h to remove any impurities from the surface. Then, the Cu sheet was rinsed with deionized water and ethanol, dried, and immediately placed in a glacial acetic acid solution for 30 s to remove copper oxides, as suggested by Hurley and McCreery.80 The surface-treated Cu sheet was immediately immersed in the reaction media for organic grafting. Organic group grafting on Cu was achieved by diazonium salt reduction on the metal surface. The desired diazonium salt was prepared in situ by mixing an appropriate aryl amine and NaNO2 in an acidic medium, and the resulting diazonium cations reacted spontaneously with the Cu sheet. Specifically, the aminophenyl diazonium salt was produced in situ by mixing an acidic solution (0.5 M HCl) of 10 mM p-phenylenediamine with 5 mM sodium nitrite. The aqueous diazonium salt solution was purged with nitrogen for 5 min before adding the Cu sheet and purging was continued until the end of the reaction to avoid the presence of atmospheric oxygen in the reaction medium.2.4 Cu metal surface characterization after organic group grafting
2.5 Functionalization of CNT open ends
The VA-CNT arrays were carefully detached from the silica substrate as self-standing thin 3D films. VA-CNT array functionalization was performed using a Plasma Prep III solid-state air plasma cleaner (SPI Supplies, West Chester, PA, USA). In the plasma chamber, the top of the CNT array was exposed to plasma for 1 min at an RF of 100 W.2.6 CNT bonding to Cu surfaces
To achieve CNT–Cu bonding, the aminophenyl-grafted Cu surface and the plasma-functionalized VA-CNT array were clamped together and heated for 1 h at 120 °C to promote the covalent bonding. Control samples with nonfunctionalized surfaces were prepared under similar conditions (control 1: functionalized CNTs with a bare Cu surface and control 2: a pristine CNT array with aminophenyl-grafted Cu).2.7 Characterization of CNT–Cu interactions
To visualize the CNTs on the Cu surface, scanning electron microscopy (SEM) micrographs were recorded using an FEI Apreo scanning electron microscope (Thermo Fisher Scientific, Waltham, MA, USA) at acceleration voltages of 5–15 kV, a current of 0.2 nA, and a working distance of ∼10 mm. Before SEM imaging, ultrasonication was utilized to remove any physisorbed CNTs from the Cu metal surface. Energy-dispersive X-ray analysis (EDAX) of the elemental composition was performed using the same instrument. The Raman spectra of CNTs attached to the Cu surface were collected using an inVia confocal Raman microscope (Renishaw, Wotton-under-Edge, UK) with a 633 nm laser as the excitation source.2.8 Electrical resistance measurements
A metallic probe (diameter ∼684 μm and surface area of the tip of the probe 339150 μm2) was lowered onto the CNT array surface carefully to make a stable connection between the CNT array and the probe but without punching the fragile CNT array. (Fig. S3†). The CNT array attached Cu metal substrate and metallic probe were connected to a multimeter to record the resistance.
3. Results and discussion
Compared with conventional materials, CNTs have impressive electrical and chemical properties. However, these properties are highly dependent on the cylindrical structure of CNTs. Therefore, to utilize their full capability, CNTs need to be firmly connected to a metal surface and the vertical orientation of the CNTs must be preserved during bond formation. CNT tip functionalization and the attachment of CNT tips to a metal have a few advantages: (1) direct covalent bond formation between CNTs and Cu surfaces can reduce electrical resistance by simulating intramolecular-type electron transport under an applied potential and (2) the connection of CNT tips to a metal allows effective load transfer to the metal surface, with more robust mechanical interfaces resulting from the covalent bond formation. The mechanism for covalent bond formation between metal and CNTs proposed in the literature was confirmed through theoretical calculations, and experimental evidence supported the strong nature of the bonding. XPS and IR surface characterization was utilized to verify the chemical functionalization of the surfaces. DFT-based computational analysis was used to assess the bond energies and electrical conductivity between Cu and VA-CNTs. Furthermore, SEM was employed to visualize the connections between CNTs and Cu surfaces.3.1 Computational analysis
The theory is employed to complement and support the covalent bond formation between C and Cu atoms and to determine the electrical conductance of the conduction channel created by the linker. To determine the bond strength or the nature of bonding between Cu, the aminophenyl linker, and CNTs, we performed first-principles DFT calculations. To examine the aminophenyl–Cu surface structure and bonding, we optimized the structures of six initial configurations consisting of an aminophenyl group placed over a high-symmetry site (top or hole) on Cu(100), Cu(110), or Cu(111) surfaces. The energetics of the six optimized configurations are displayed in Fig. 2. In five of the six configurations, including the most stable configuration for each Cu surface, a bridge structure was adopted involving the formation of two C–Cu bonds between the p-carbon of the aminophenyl group and Cu atoms. In the sixth configuration, a single bond was formed between the aminophenyl group and the Cu(111) surface. However, on the Cu(111) lattice, the single-bond configuration was 0.19 eV more energetic than the bridge configuration. | ||
| Fig. 2 Optimized geometries for aminophenyl attachment to Cu metal. The energies are relative to that of the most stable configuration (0 eV). Nitrogen (blue), carbon (green), hydrogen (white), and copper (orange). | ||
The calculated adsorption energies were 2.79–3.33 eV for the optimized bridge site configurations with two Cu–C bonds (Table 1). The optimized single-bond configuration on the Cu(111) surface gave an adsorption energy of 2.60 eV, which is the lowest among the calculated Cu–C bonds. The calculated adsorption energies are higher than those previously reported between phenyl groups and metal surfaces,42 indicating the occurrence of covalent bonding between the phenyl group and the Cu surface.81 Additionally we evaluated the ionic character of the C–Cu bond. The Pauling equation, which is an empirical relationship, can be used to obtain the percentage of ionic character in a bond considering the electronegativity difference between the bonded atoms. The ionic character percentage is given by  , where Δχ is the electronegativity difference between the atoms. The electronegativities of C and Cu (2.55 and 1.9, respectively) give an ionic character percentage of 10% only. This poor ionic character indicates that the C–Cu bond is mostly covalent in nature, as supported by the ELF results. In the optimized configurations, the carbon atom without a hydrogen atom closest to the Cu surface was found to have a charge of −0.30e to −0.40e, whereas the remaining five carbon atoms had charges of −0.2e to 1.0e. Furthermore, the aminophenyl group attached to the Cu surface had an overall charge of −0.26e to −0.37e, indicating anionic behavior. The aminophenyl group in the Cu(111)-top configuration with a single Cu–C bond had the lowest charge (−0.26e). The Cu surface remained nearly neutral, with a slight negative charge of 0.0e to −0.2e. However, the Cu atoms bonded to a carbon atom in the aminophenyl group had charges of 0.12e–0.17e, indicating the occurrence of electron exchange between Cu and the aminophenyl group (Fig. S4†).
| Cu Surface | Initial site | Final site | E total (eV) | Cu–C (Å) | Number of Cu–C bonds | Cu–C (eV) | BEa (eV) | Cu–C–Cu (°) | θ (°) |
|---|---|---|---|---|---|---|---|---|---|
| a Binding energy (BE) = E(Cu surface) + E(aminophenyl) − E(aminophenyl/Cu surface). b Angle of the aminophenyl molecular plane with respect to the Cu surface plane. | |||||||||
| 100 | Top | Bridge | −954910.11 |
2.07 | 2 | 1.64 | 3.28 | 75.3 | 84.6 |
| 100 | Hole | Bridge | −954910.16 |
2.08 | 2 | 1.66 | 3.33 | 75.3 | 89.4 |
| 110 | Hole | Bridge | −954909.60 |
2.07 | 2 | 1.58 | 3.16 | 74.3 | 88.8 |
| 110 | Top | Bridge | −954909.78 |
2.05 | 2 | 1.67 | 3.34 | 75.9 | 80.3 |
| 111 | Hole | Bridge | −954919.95 |
2.02 | 2 | 1.39 | 2.79 | 68.2 | 85.6 |
| 111 | Top | Top | −954919.76 |
1.97 | 1 | 2.60 | 2.60 | 84.8 | |
We also calculated the ELF characteristics to analyze the nature of the C–Cu bonds (Fig. 3). For five of the six aminophenyl/Cu slab configurations, the aminophenyl carbon atom is bonded to the center of a Cu–Cu metallic bond, as in the bridge site configurations on Cu(100) (Fig. 3A and D) and Cu(110) (Fig. 3B and E). In contrast, in the Cu(111)-top configuration, the aminophenyl carbon atom is bonded to a single Cu atom located directly below it (Fig. 3C and F).
 | ||
| Fig. 3 2D ELF plots along the phase containing the Cu–C chemical bond on (A) Cu(100), (B) Cu(110), and (C) Cu(111). ELF isosurfaces (η = 0.8 eÅ−3) for an aminophenyl group on (D) Cu(100), (E) Cu(110), and (F) Cu(111). Nitrogen (blue), carbon (green), hydrogen (white), and copper (orange). | ||
In the 2D ELF plots, an intense red region with an ELF value close to 1 was observed between the carbon and Cu atoms, which had the typical shape of a covalent bond. However, the intensity decreased toward the Cu surface, indicating a mixture of covalent and metallic bonding.67
The effects of bonding a CNT to the aminophenyl group on the relative energies of the six configurations in Fig. 2 were evaluated. Overall, CNT addition did not change the energy differences among the six configurations (Fig. 4), and CNT–aminophenyl–Cu(111) formed the most stable structure.
 | ||
| Fig. 4 Relative energies for CNT attachment to Cu metal through an aminophenyl group for different Cu planes and types of aminophenyl–Cu bond (bridge or top). The energies are relative to that of the most stable configuration (0 eV). Nitrogen (blue), carbon (green), hydrogen (white), and copper (orange). | ||
To determine if the CNT attachment reaction is endothermic or exothermic, we calculated the relative energy (ΔE) using the energies of the six Cu–aminophenyl configurations (ECNT–phenyl–Cu) and an added water molecule (EH2O) compared to those of the corresponding initial optimized components, namely, the CNT (ECNT) and the aminophenyl group attached to Cu (Ephenyl–Cu). The obtained ΔE values indicate that all six reactions for attaching the CNT to the aminophenyl group bonded to the Cu surface, giving water as a product, are endothermic (Table 2). This result suggests that some energy input (0.16–0.26 eV) is required for CNT bonding to aminophenyl-grafted Cu surfaces. This energy is provided as heat to promote this reaction as suggested by the theoretical calculations. We extracted two models from ab initio DFT calculations (Fig. 5A). The first model, called “without aminophenyl”, is composed of a COOH group belonging to the CNT attached to two Cu atoms belonging to the Cu slab. The second model, called “with aminophenyl”, is composed of an aminophenyl group linking one end of the CNT and two Cu atoms belonging to the Cu slab. The I–V characteristics were calculated for the two models under applied voltages in the range of −5 to +5 V (Fig. 5B). The I–V curves revealed that the current is greater in the with aminophenyl model. We calculated the conductance as dI/dV (Fig. 5C), and in all cases, the with aminophenyl model shows greater conductance than the without aminophenyl model. This supports the hypothesis that chemical bonding between Cu and CNTs, which is covalent, provides a better electron transport path compared to mere physical contact. Similarly, the resistance, calculated as dV/dI (Fig. 5D), indicates that the electron flow is improved when an aminophenyl linker is used to attach the CNT to the Cu surface. To highlight the advantages of a linker molecule between a CNT and Cu substrate, zigzag CNT (8,0) was employed. Specifically, semiconducting CNTs should showcase the effectiveness of the linker under less favorable conditions compared to metallic CNTs.
| Cu plane | E phenyl–Cu (eV) | E CNT (eV) | E CNT–phenyl–Cu (eV) | H2O (eV) | ΔE = (ECNT–phenyl–Cu + EH2O) − (Ephenyl–Cu + ECNT) |
|---|---|---|---|---|---|
| 100 | −954910.11 |
−29859.49 |
−984170.31 |
−599.10 | 0.19 |
| 100 | −954910.16 |
−29859.49 |
−984170.36 |
−599.10 | 0.18 |
| 110 | −954909.60 |
−29859.49 |
−984169.72 |
−599.10 | 0.26 |
| 110 | −954909.78 |
−29859.49 |
−984169.98 |
−599.10 | 0.18 |
| 111 | −954919.95 |
−29859.49 |
−984180.17 |
−599.10 | 0.16 |
| 111 | −954919.76 |
−29859.49 |
−984179.93 |
−599.10 | 0.21 |
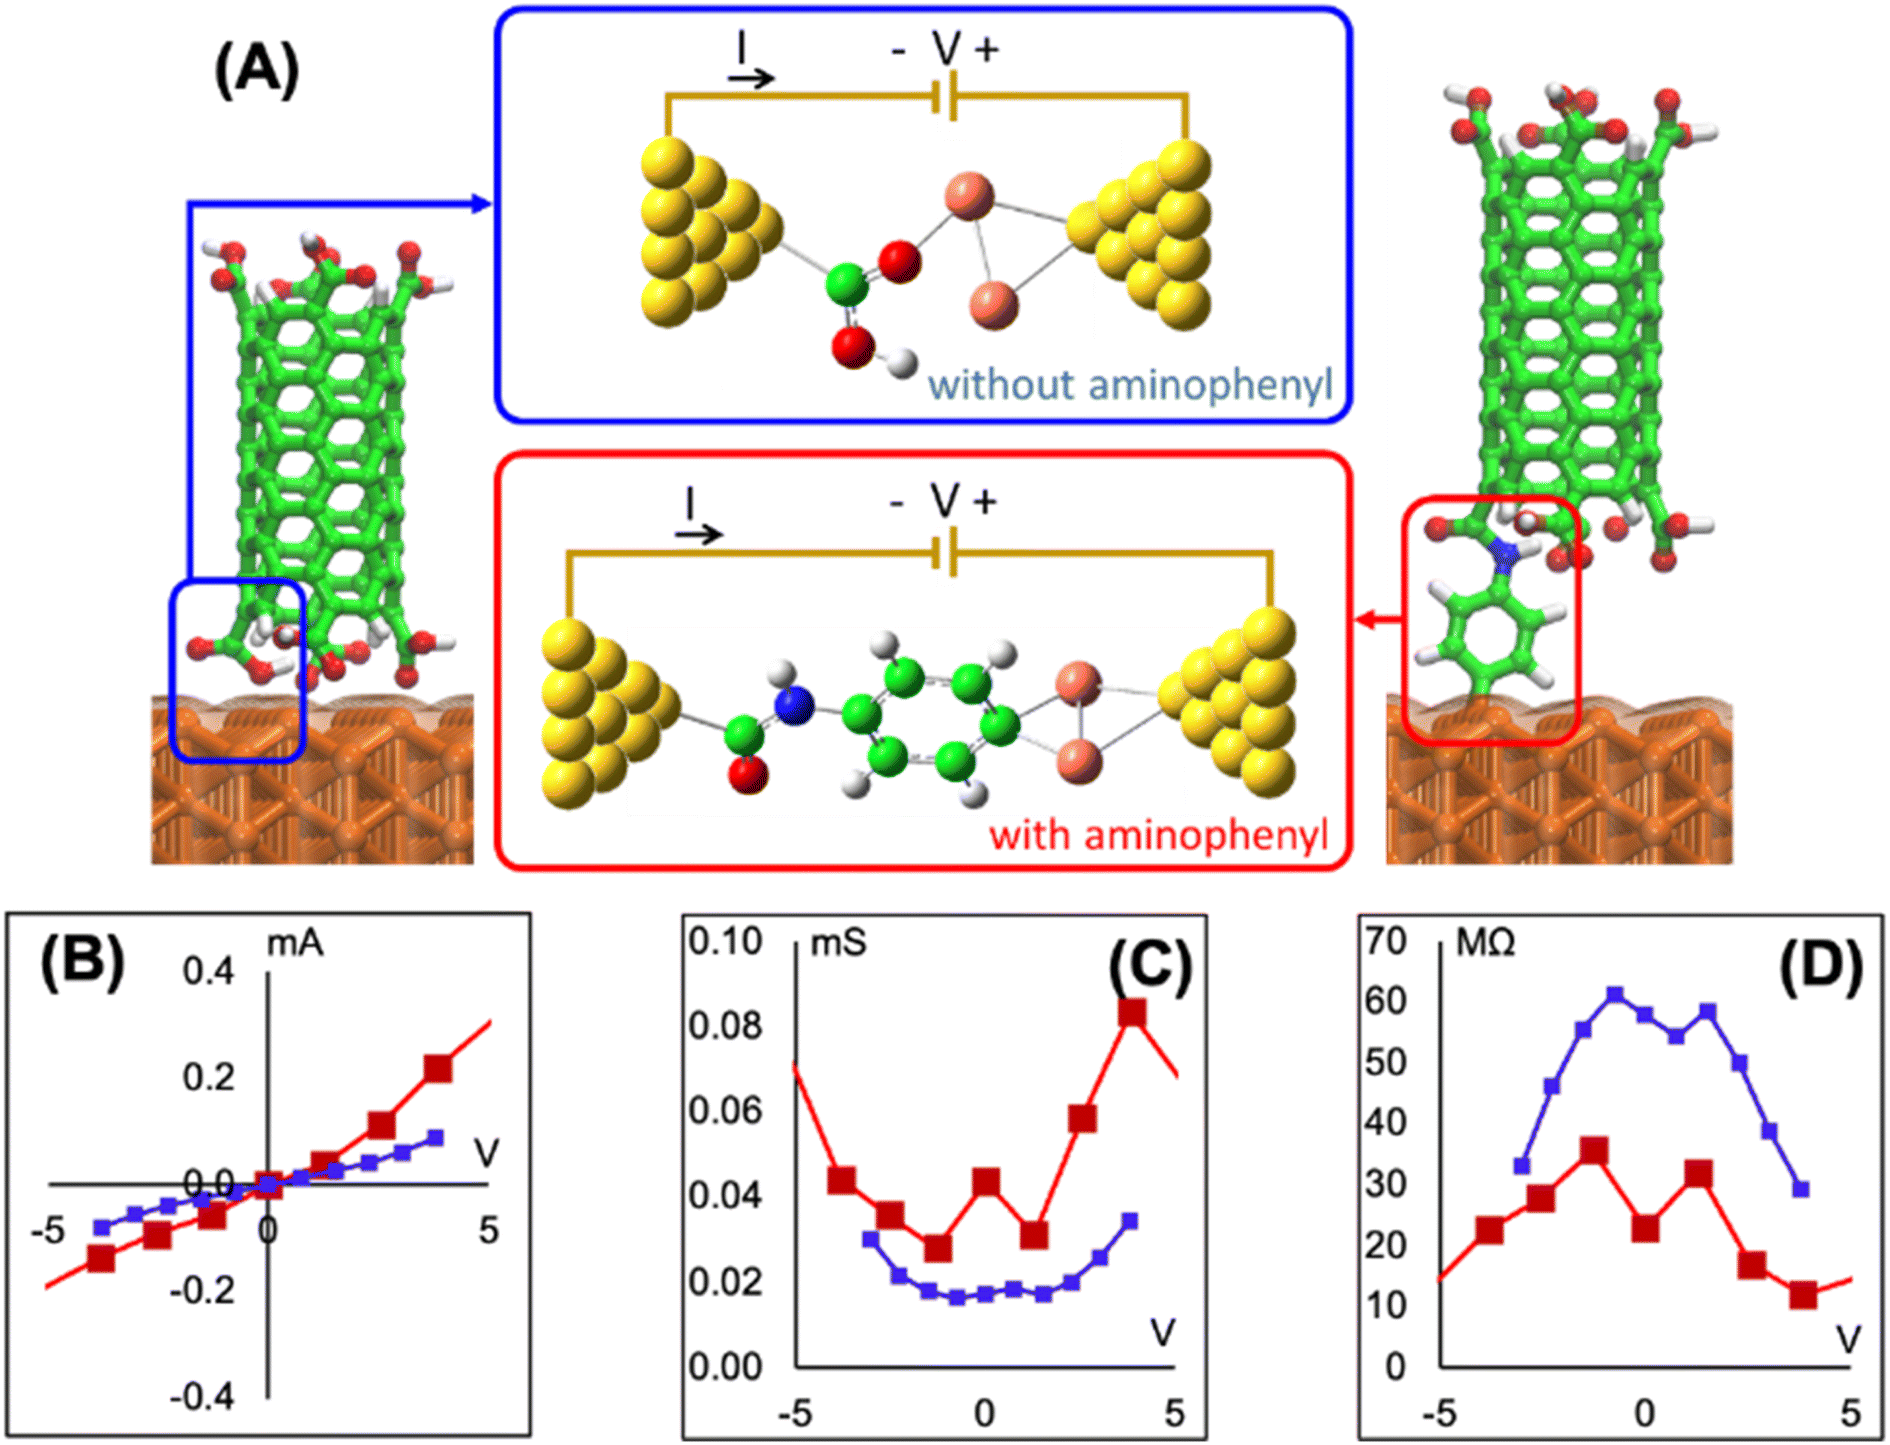 | ||
| Fig. 5 (A) With and without aminophenyl models attached to nanogold electrodes for I–V curve calculations. The nanogold electrodes constitute the electron source and drain for the calculations. Nitrogen (blue), carbon (green), hydrogen (white), copper (orange), and gold (yellow). (B) I–V curves, (C) conductance, and (D) resistance of the with aminophenyl model (red curves) and without aminophenyl model (blue curves). | ||
3.2 Proposed mechanism
Fig. 6 shows the proposed reaction mechanism for covalent bond formation between CNTs and Cu surfaces. Direct Cu–CNT bonds are not favorable because the outer orbitals of Cu are more electron rich than those of other d group metals. Therefore, we aimed to overcome the energy mismatch by using a suitable linker to connect CNTs and Cu, thus allowing the successful formation of chemical bonds under mild reaction conditions.16 Chemical bond formation between Cu and aryl radicals generated from a diazonium salt was introduced by Pinson and co-workers and has been widely used by his and other groups for various applications.82–85 Lyskawa and Bélanger et al. used phenylenediamine to generate a monodiazonium salt containing an amine group that can undergo a second reaction, and cyclic voltammetry and XPS analyses confirmed that this salt could be generated in situ by mixing acidic phenylenediamine and sodium nitrite.86 The spontaneous reaction between Cu and the aminophenyl diazonium salt was used to immobilize aminophenyl groups on the Cu surface. Similar covalent bond formation has been demonstrated between Cu and various diazonium salts, including phenyl diazonium salt, nitrophenyl diazonium salt, nitro azobenzene diazonium salt, and fast blue diazonium salt.80 When the metal substrate is more reducing than the diazonium salt, the diazonium salt can be reduced to form a radical by taking an electron from the metal surface, and the obtained radical can then react with the metal surface to form a chemical bond.87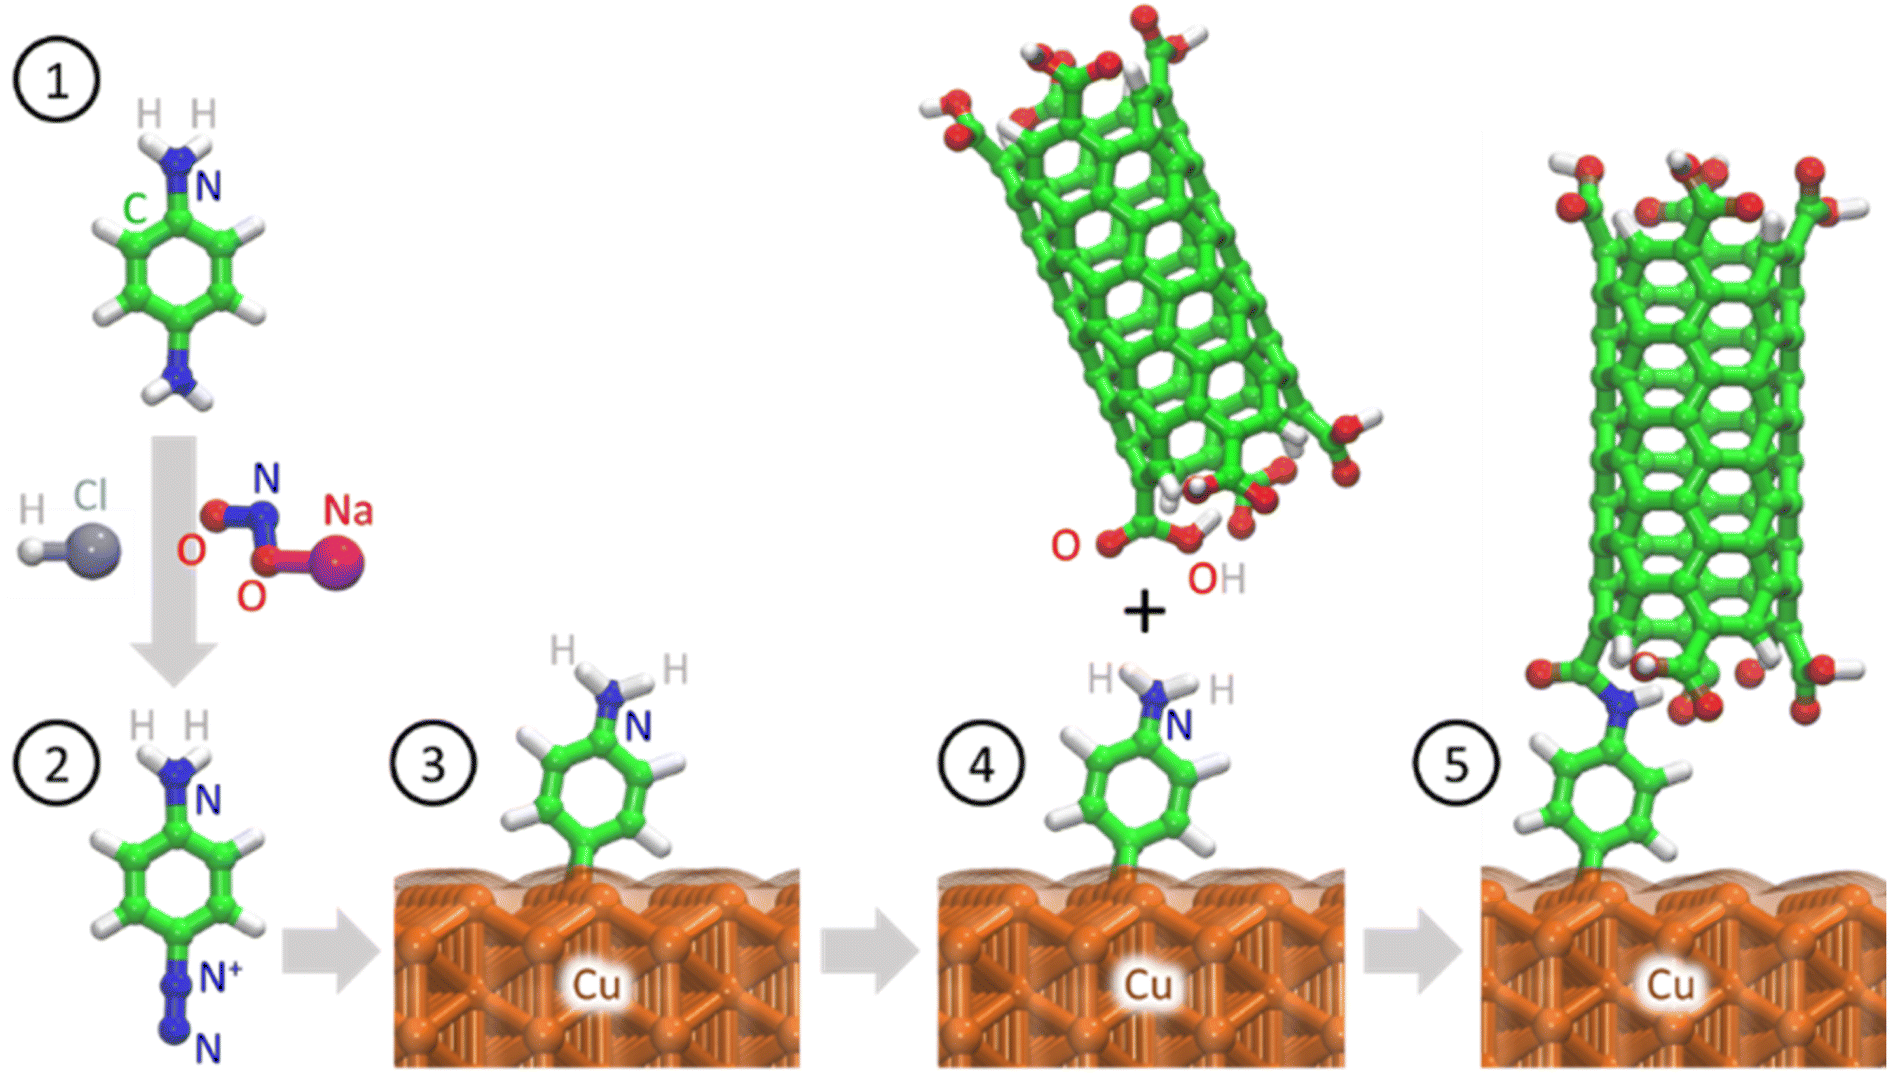 | ||
| Fig. 6 Proposed mechanism for Cu surface functionalization and subsequent attachment of carboxylic-group-functionalized CNT tips. Nitrogen (blue), carbon (green), hydrogen (white), oxygen (red), and copper (orange). | ||
The proposed mechanism involves the grafting of aminophenyl groups onto the Cu surface and subsequent bonding of the aminophenyl groups to carboxylic functional groups on the CNT open ends. The energy changes calculated for aminophenyl grafting on Cu (100), Cu (110), and Cu (111) suggest that the grafting reaction is spontaneous. Furthermore, theoretical calculations provided evidence for covalent bond formation between the aminophenyl group and the Cu metal slab. The carboxylic functional group can be formed on CNT surfaces through treatment with oxidative chemicals, including HNO3, H2SO4, and KMnO4, or by plasma treatment.88 In particular, the use of RF plasma treatment to generate oxygen-containing functional groups on CNT surfaces has been demonstrated.89–91 Plasma treatment is preferable to liquid-phase chemical oxidation because it can preserve the CNT distribution within the array and can avoid the introduction of chemical oxidation byproducts as contaminants. Similarly, Kaur et al. covalently bonded plasma-oxidized CNT open ends to amino-grafted metal surfaces to reduce the interfacial thermal resistance.32 According to the theoretical calculations, the reaction between the CNTs and the aminophenyl groups attached to Cu is endothermic. Therefore, external heat must be provided to promote the reaction between carboxylic groups and aminophenyl groups.92 To verify the reaction mechanism, surface characterization techniques were used to identify the functional groups formed during each chemical treatment step.
3.3 Surface characterization
The elemental composition before and after aminophenyl grafting on the Cu surface was determined using EDAX (Fig. S5†). The C content increased from 2.6 to 19 at%, the N content increased from 0 to 1.4 at%, the O content increased from 0.5 to 2.5 at%, and the Cu content decreased from 96.8 to 76.9 at%. These changes are consistent with the formation of an organic film containing C, N, and O on the Cu surface upon diazonium grafting.The grafting of aminophenyl groups onto the bare Cu surface was further characterized using XPS. Fig. 7A shows the survey spectra of the bare and aminophenyl-grafted Cu surfaces. As expected, the XPS spectrum of the bare Cu surface has characteristic Cu 2p1/2 and Cu 2p3/2 peaks at 952.2 and 932.6 eV, respectively. The peak observed at 530.5 eV for the bare Cu surface can be explained by trace oxygen on the Cu surface. Furthermore, trace carbon detected at 284.9 eV can be explained by the presence of organic contaminants introduced during the cleaning process or CO2 adsorbed from the atmosphere. The reaction time for aminophenyl group grafting clearly affected the peak intensities in the XPS survey spectra. The Cu peak intensities decreased and the carbon peak increased significantly upon increasing the reaction time from 5 s (Figure 7A) to 5 min (Fig. S6A†), confirming the presence of a carbon-containing layer on the Cu surface.83 In addition, the increased C and N peak intensities at longer reaction times indicate that the diazonium salt can form a multilayer structure on the Cu surface (Fig. S6A†). Furthermore, the appearance of multiple peaks in the N core-level spectrum (Fig. S6B†) at longer reaction times (5 min) suggests the possibility that different nitrogen-containing species are formed on the aminophenyl-grafted Cu surfaces through the reaction of a second diazonium molecule with an aminophenyl group already attached to the surface, as reported previously.86 The increased intensity of the oxygen peak after the grafting reaction may be due to the presence of water on the surface or the adsorption of atmospheric carbon dioxide.86
 | ||
| Fig. 7 (A) XPS survey spectra of (blue) bare Cu and (pink) aminophenyl-grafted Cu surfaces (5 s reaction time). The insets show magnified views of the N peaks. (B) IR spectra of (a) the bare Cu surface, (b) the aminophenyl-grafted Cu surface (5 min reaction time), and (c) solid p-phenylenediamine. | ||
The core-level N 1s spectrum of the aminophenyl-grafted Cu surface (5 s reaction time) shows two peaks at 399.6 and 405.2 eV (Fig. S7†). The prominent peak at 399.6 eV can be attributed to amino groups on the metal surface. Similar amino group peaks have been observed at 399.4 eV for aminophenyl-attached Au surfaces and 400 eV for diazonium-salt-attached Cu surfaces.85,86 The weak peak at 405.2 eV can be attributed to NO2 species on the Cu surface, likely due to contaminants in the sample.85 Similarly, the weak peaks observed for the bare Cu surface are assigned to contaminants.
Fig. 7B shows the experimental IR spectra of the bare Cu surface, the aminophenyl-grafted Cu surface, and solid p-phenylenediamine. Furthermore, the theoretically predicted IR spectra of the optimized structures were compared with the experimental results (Fig. S8†). The presence of aminophenyl groups on the metal surface is indicated by the observation of C–H, N–H, and C![[double bond, length as m-dash]](https://www.rsc.org/images/entities/char_e001.gif) C stretching peaks. In the experimental IR spectrum of the aminophenyl-grafted Cu surface, the broad peak at 3200–3700 cm−1 corresponds to N–H bond elongation, and a similar peak appears at 3601 cm−1 in the theoretically predicted spectrum. The experimental peak centered at 2925 cm−1 can be attributed to C–H stretching vibrations,86,93 whereas the corresponding theoretically predicted peak appears at 3191 cm−1. Badawi et al. observed a similar shift for the C–H stretching peak in the experimental and theoretical spectra of p-phenylenediamine.94 The peaks at 1490–1654 cm−1 in the spectrum of the aminophenyl-grafted Cu surface can be attributed to aromatic ring stretching.93 Similar sharp peaks are observed at 1443–1627 cm−1 in the solid p-phenylenediamine spectrum. For the aminophenyl-grafted Cu surface, the peaks at 1295 and 1180 cm−1 can be attributed to C–NH2 stretching and CH bending, respectively.95 A similar peak has been observed at 1273 cm−1 for aminophenyl-grafted Au surfaces.86 The multiple peaks observed in the experimental spectra at 235–1900 cm−1 are due to the instrumental noise. Table S1† compares the theoretical predicted vibrational wavenumbers and the experimentally observed values for the aminophenyl-grafted Cu surface.
C stretching peaks. In the experimental IR spectrum of the aminophenyl-grafted Cu surface, the broad peak at 3200–3700 cm−1 corresponds to N–H bond elongation, and a similar peak appears at 3601 cm−1 in the theoretically predicted spectrum. The experimental peak centered at 2925 cm−1 can be attributed to C–H stretching vibrations,86,93 whereas the corresponding theoretically predicted peak appears at 3191 cm−1. Badawi et al. observed a similar shift for the C–H stretching peak in the experimental and theoretical spectra of p-phenylenediamine.94 The peaks at 1490–1654 cm−1 in the spectrum of the aminophenyl-grafted Cu surface can be attributed to aromatic ring stretching.93 Similar sharp peaks are observed at 1443–1627 cm−1 in the solid p-phenylenediamine spectrum. For the aminophenyl-grafted Cu surface, the peaks at 1295 and 1180 cm−1 can be attributed to C–NH2 stretching and CH bending, respectively.95 A similar peak has been observed at 1273 cm−1 for aminophenyl-grafted Au surfaces.86 The multiple peaks observed in the experimental spectra at 235–1900 cm−1 are due to the instrumental noise. Table S1† compares the theoretical predicted vibrational wavenumbers and the experimentally observed values for the aminophenyl-grafted Cu surface.
To identify the type of bonding between the organic groups and the Cu surface, physisorbed molecules were removed from the Cu surface by ultrasonication in acetone for 30 min, and the remaining groups on the Cu surface were characterized by IR spectroscopy. The IR spectra of the sonicated and unsonicated samples are similar (Fig. S9†), suggesting the chemisorbed nature of the organic groups on the Cu metal surface.
XPS analysis of the plasma-treated CNT array surface was performed to identify the surface functional groups on the CNT open ends at the top of the array (Fig. S10†). The survey spectrum (Fig. S10A†) of the pristine CNT array exhibits a sharp peak at 285 eV that can be attributed to C. In contrast, the XPS survey spectrum of the plasma-functionalized CNT array shows two sharp peaks at 533.08 and 285.08 eV, attributable to O and C, respectively, which indicate the presence of C- and O-containing functional groups. Further analysis of the core-level XPS spectra of the pristine and plasma-functionalized CNT arrays indicates that the plasma treatment can effectively generate carboxylic groups on the CNT open ends. The core-level C 1s spectrum of the plasma-treated sample exhibits a peak at 288.5 cm−1 corresponding to carboxylic functional groups (Fig. S10C†), whereas this peak does not appear in the spectrum of the pristine CNTs (Fig. S10B†). Furthermore, the core-level C 1s spectra show peaks corresponding to C–C, defects, and carbonates at 284.4, 284.8, and 290.8 eV, respectively, for the pristine CNTs and at 284.4, 285.48, and 291.8 eV, respectively, for the plasma-functionalized sample. Similar results have been reported by Malik et al.96 and Datsyuk et al.97
3.4 SEM characterization
The 3-dimensional nature of the VA-CNTs on the Cu surface was evaluated using SEM. The orthogonal orientation and vertically aligned nature of the CNT array connected to the metal surface can be observed in Fig. 8A. The high-magnification image reveals clear connections between the metal surface and the ends of the CNTs at the interface (Fig. 8B). This covalent bonding technique has potential relevance for electronic applications because the CNT side walls are not damaged, and only the CNT tips are involved in bonding, allowing preservation of the CNT properties, including electrical conductivity. Furthermore, CNT arrays that are only attached to Cu surfaces via compression can be easily detached and dispersed into solution under sonication, because of the weak van der Waals forces between the CNTs within the array. Ultrasonication is a high-energy method that is commonly used to disperse CNTs in mixtures.98 For CNTs covalently bonded to Cu surfaces, ultrasonication in acetone for extended times (up to 30 min) did not detach the CNTs from the Cu substrate (Fig. 8C). Instead, the image revealed that the uniformity of the CNT array surface was lost due to forming aggregates into bundles, typical of CNTs after solvent interaction, but they all seem to remain attached to the substrate. Owing to the low density of CNTs in CNT arrays, individual CNTs tend to aggregate into bundles after sonication. The combed-hair-like morphology observed in the high-magnification SEM image of the VA-CNTs bonded to the Cu surface after sonication indicates that individual CNTs were drawn during densification and sonication, but their ends remained fixed to the surface (Fig. 8D). As the tips of the CNTs remain connected to the Cu surface after 30 min sonication, the bonds formed between the CNTs and Cu metal are considered strong. Similar aggregation of CNTs grown as arrays on flat substrates was observed by De Volder et al. upon solvent addition.99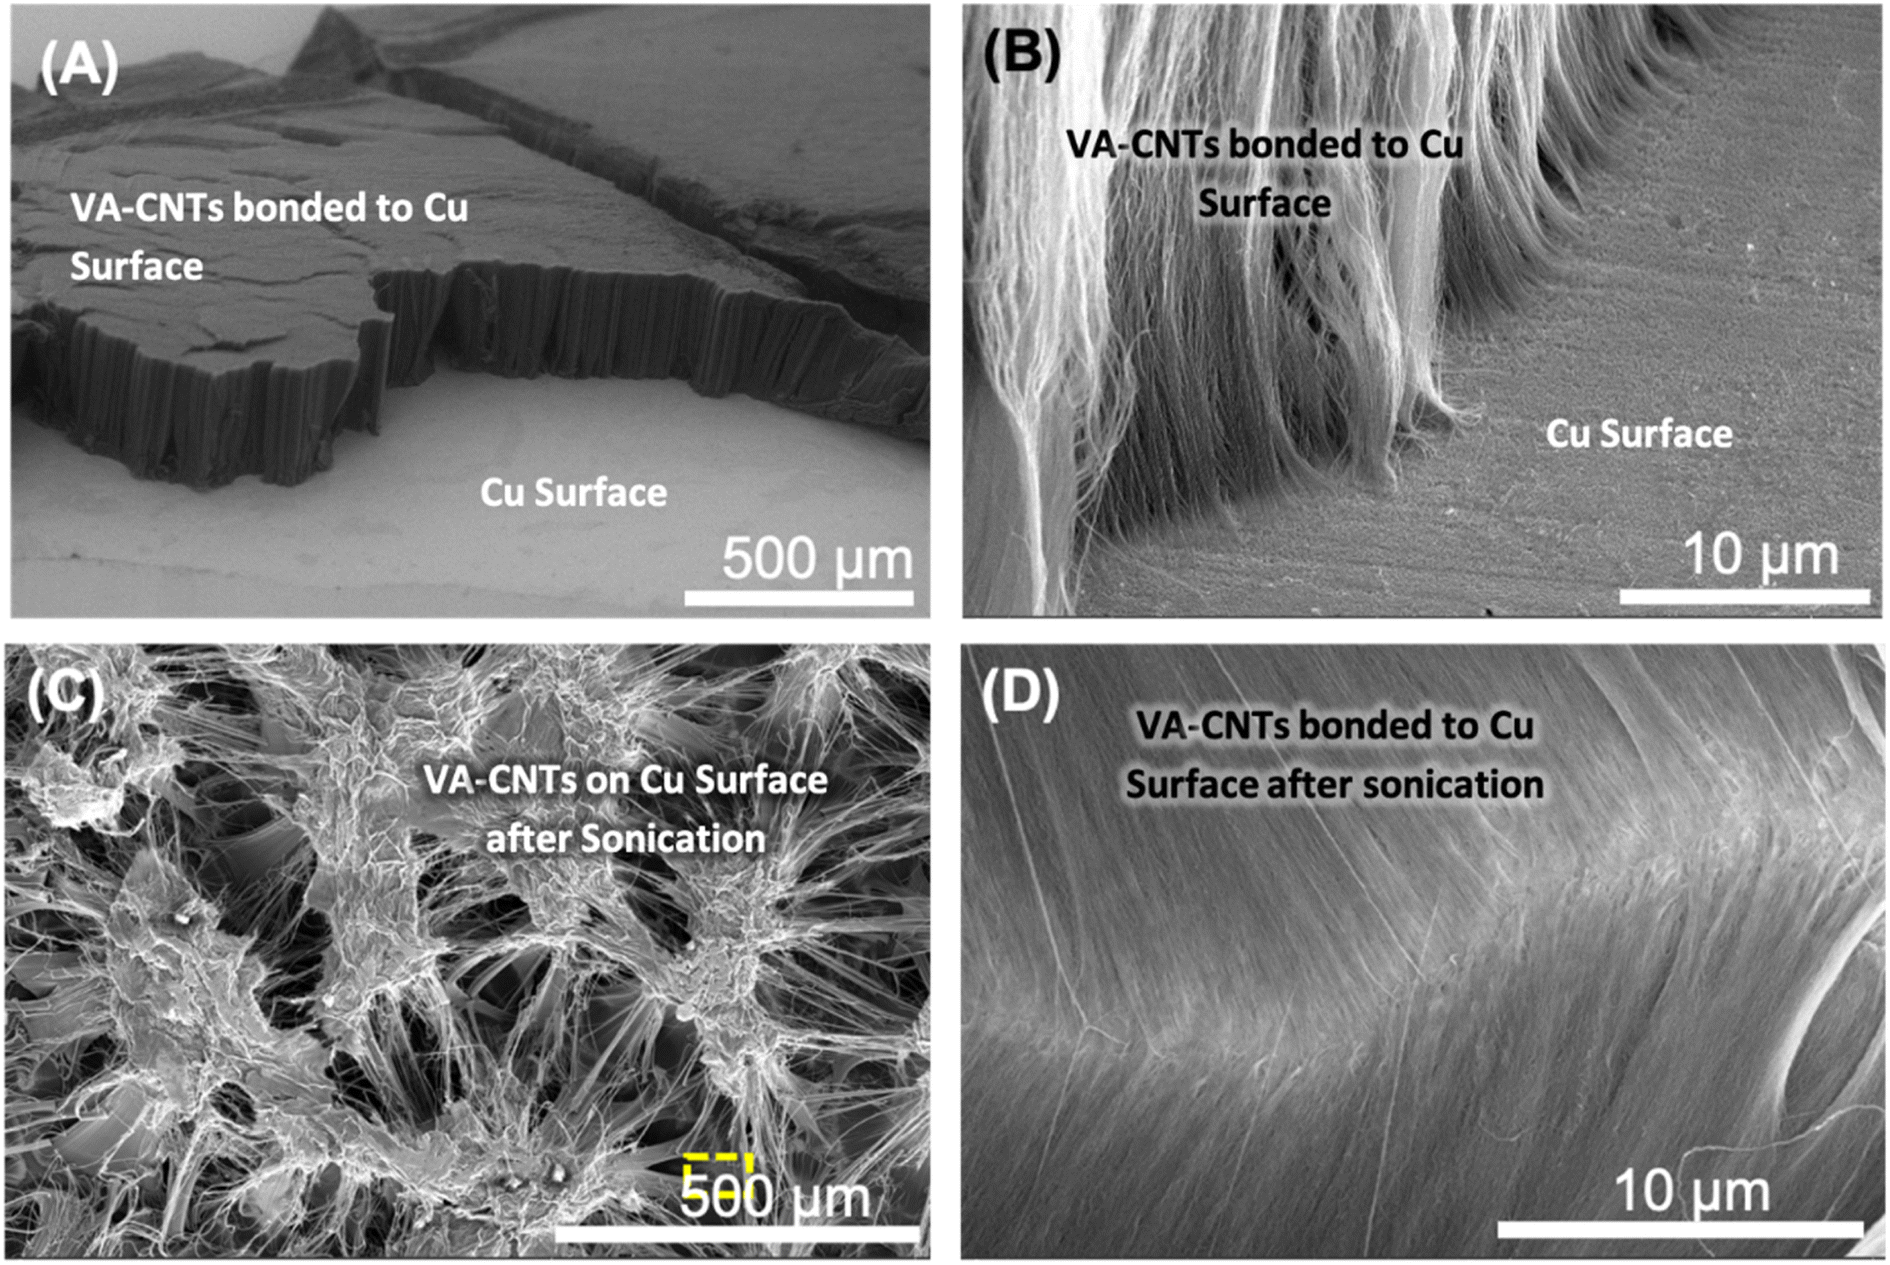 | ||
| Fig. 8 SEM images of CNT VA-CNTs covalently bonded to a Cu metal surface before and after sonication. (A) Side view of the CNT array attached to the Cu surface. (B) High-magnification view of the open-ended VA-CNTs bonded to the Cu substrate. (C) Low- and (D) high-magnification top views of the VA-CNT array bonded to the Cu surface after ultrasonication. | ||
To further demonstrate the bonding strength of the CNTs attached to the Cu surface, the VA-CNTs were removed using adhesive tape (Scotch™). The sticky surface of the adhesive was pressed against the CNTs at the top of the CNT array, and then the adhesive was peeled off from the Cu surface. SEM images of the Cu substrate after separating the CNT array with adhesive revealed a large number of broken CNTs remaining on the Cu substrate (Fig. S11†), confirming the high Cu–CNT bonding strength. Similar results have been observed for CNTs attached to metal surfaces using nano-thermocompression.28,100 Raman spectra collected from the area where CNTs were connected to metal and then removed using adhesive tape reveal Raman peaks indicative of CNT presence, suggesting that broken CNTs remain bonded to the metal surface. Two specific CNT peaks (D and G peaks) appear in the Raman spectra (Fig. S12†). The D/G peak ratio is higher (1.8) for the Raman spectrum of broken CNTs on the metal surface compared to the typical Raman of the employed CNTs. This indicates that the adhesive tape test leaves broken CNTs on the metal surface because the strength of the metal–CNTs bonds is higher than the van der Waals that keeps them within the CNT array. The robustness of the grafted aminophenyl linker has recently been employed for the development of an electrochemical hydrogen peroxide sensor. It has shown impressive current response stability when exposed to high oxidative potentials for 540 h.101
3.5 Electrical resistance measurements at the CNT–metal interface
Using p-phenylenediamine as a linker between CNT open-ends and Cu metal has a few advantages. The linking of CNTs and Cu is facilitated by the two amine groups located at opposite ends of the p-phenylenediamine molecule, which can participate in two different reactions with oxidized CNTs and Cu metal. For effective C bonding from CNTs to metal, metallic Cu is preferred, because eliminating oxides exposes more Cu atoms available for bonding to C. Furthermore, the use of a π-electron-rich molecule as the linker is expected to improve the electrical conductivity at the interface because the π-electrons can participate in charge transfer.102 Aminophenyl is a small molecule with conjugated π bonds, and therefore we consider it as a good candidate to evaluate experimentally and theoretically. It is well known that not all covalent bonds improve the conductivity, and sigma bonds tend to worsen while π-bonding improves it. The interfacial resistance was measured using a multimeter with a cylindrical probe to form a stable connection with a section of the top side of the CNT array. It is expected that light pressure applied on the cylindrical probe (∼684 μm diameter) makes a circular contact with the same number of CNTs. The SEM image in Fig. S13A† shows multiple probe prints at low magnification, while Fig. S13B† shows a higher magnification of a single probe print on top of CNT arrays. Each print contains ∼108 CNTs and corresponds to a single measurement. The experimentally measured interfacial resistance of a bundle of CNTs had an average of 12 Ω for 12 measurements, whereas the DFT-calculated value was between (10–35 MΩ) for a single linker molecule bonded to a CNT. We attribute this to the difference between the number of CNTs that exist within a bundle in the experimental measurements, compared to a single bond and a single CNT in the theoretical calculation. Considering that the linker molecule employed in this work was not optimized for electrical conductivity, but experimentally most feasible, the resistance measured is within a practical range.4. Conclusion
In summary, theoretical calculations and experimental results supported and validated covalent bond formation between Cu metal atoms and carbon in aminophenyl functional groups. Simulations indicated that a bridge-like bond was formed with (100), (110), and (111) Cu lattices, although a lower energy single bond was also observed in one case with the (111) Cu lattice. Covalent bond formation between the aminophenyl groups on Cu and carboxylic groups at the open ends of CNTs allowed the aminophenyl groups to act as linkers between open-ended CNTs and Cu surfaces. SEM imaging suggested that the CNTs were connected to the Cu surface, and extensive sonication experiments verified the strength of the bonding between the CNTs and Cu. To the best of our knowledge, this is the first covalent bond formed between open-ended CNTs and metal surfaces that has the potential to simulate intramolecular-type electron transport between metals and organic nanotubes.Author contributions
CPN: experimental investigation, formal analysis, data curation and writing original draft. DGA: theoretical investigation, formal analysis, data curation and writing original draft. AH and GRD: investigation and data curation. JMS: theoretical investigation, formal analysis, data curation and supervision. NTA: conceptualization, investigation, formal analysis, supervision, revision and editing of the manuscript. All authors have given approval to the final version of the manuscript.Conflicts of interest
There are no conflicts to declare.Acknowledgements
The authors are extremely grateful to the professorship startup funds of University of Cincinnati, Chemistry Department.References
- R. M. Sundaram, A. Sekiguchi, M. Sekiya, T. Yamada and K. Hata, R. Soc. Open Sci., 2018, 5, 180814 CrossRef CAS PubMed.
- F. Daneshvar, H. Chen, K. Noh and H. J. Sue, Nanoscale Adv., 2021, 3, 942–962 RSC.
- R. H. Baughman, A. A. Zakhidov and W. A. De Heer, Science, 2002, 297, 787–792 CrossRef CAS.
- Q. Cao, J. Tersoff, D. B. Farmer, Y. Zhu and S. J. Han, Science, 2017, 356, 1369–1372 CrossRef CAS PubMed.
- T. W. Ebbesen, H. J. Lezec, H. Hiura, J. W. Bennett, H. F. Ghaemi and T. Thio, Nature, 1996, 382, 54–56 CrossRef CAS.
- P. Poncharal, C. Berger, Y. Yi, Z. L. Wang and W. A. de Heer, J. Phys. Chem. B, 2002, 106, 12104–12118 CrossRef CAS.
- R. Sundaram, T. Yamada, K. Hata and A. Sekiguchi, Sci. Rep., 2017, 7, 1–11 CrossRef CAS.
- G. S. Tulevski, A. D. Franklin, D. Frank, J. M. Lobez, Q. Cao, H. Park, A. Afzali, S. J. Han, J. B. Hannon and W. Haensch, ACS Nano, 2014, 8, 8730–8745 CrossRef CAS.
- S. Jiang, P.-X. Hou, M.-L. Chen, B.-W. Wang, D.-M. Sun, D.-M. Tang, Q. Jin, Q.-X. Guo, D.-D. Zhang, J.-H. Du, K.-P. Tai, J. Tan, E. I. Kauppinen, C. Liu and H.-M. Cheng, Sci. Adv., 2018, 4, eaap9264 CrossRef.
- A. R. O. Raji, R. Villegas Salvatierra, N. D. Kim, X. Fan, Y. Li, G. A. L. Silva, J. Sha and J. M. Tour, ACS Nano, 2017, 11, 6362–6369 CrossRef CAS PubMed.
- P. Gupta, C. E. Rahm, B. Griesmer and N. T. Alvarez, Anal. Chem., 2021, 93, 7439–7448 CrossRef CAS.
- R. Rao, C. L. Pint, A. E. Islam, R. S. Weatherup, S. Hofmann, E. R. Meshot, F. Wu, C. Zhou, N. Dee, P. B. Amama, J. Carpena-Nuñez, W. Shi, D. L. Plata, E. S. Penev, B. I. Yakobson, P. B. Balbuena, C. Bichara, D. N. Futaba, S. Noda, H. Shin, K. S. Kim, B. Simard, F. Mirri, M. Pasquali, F. Fornasiero, E. I. Kauppinen, M. Arnold, B. A. Cola, P. Nikolaev, S. Arepalli, H.-M. Cheng, D. N. Zakharov, E. A. Stach, J. Zhang, F. Wei, M. Terrones, D. B. Geohegan, B. Maruyama, S. Maruyama, Y. Li, W. W. Adams and A. J. Hart, ACS Nano, 2018, 12, 11756–11784 CrossRef CAS PubMed.
- F. Banhart, Nanoscale, 2009, 1, 201–213 RSC.
- Y. Matsuda, W.-Q. Deng and W. A. Goddard, J. Phys. Chem. C, 2010, 114, 17845–17850 CrossRef CAS.
- Y. Zhang, N. W. Franklin, R. J. Chen and H. Dai, Chem. Phys. Lett., 2000, 331, 35–41 CrossRef CAS.
- G. M. Ilari, F. S. Hage, Y. Zhang, M. D. Rossell, Q. M. Ramasse, M. Niederberger and R. Erni, Micron, 2015, 72, 52–58 CrossRef CAS.
- F. Gao, J. Qu and M. Yao, Appl. Phys. Lett., 2010, 96, 102108 CrossRef.
- A. Fediai, D. A. Ryndyk, G. Seifert, S. Mothes, M. Schroter, M. Claus and G. Cuniberti, Appl. Phys. Lett., 2016, 109, 103101 CrossRef.
- J.-Y. Raty, F. Gygi and G. Galli, Phys. Rev. Lett., 2005, 95, 096103 CrossRef.
- A. Fediai, D. A. Ryndyk and G. Cuniberti, Phys. Rev. B, 2015, 91, 165404 CrossRef.
- F. Gao, J. Qu and M. Yao, Appl. Phys. Lett., 2010, 97, 242112 CrossRef.
- J. A. Rodríguez-Manzo, F. Banhart, M. Terrones, H. Terrones, N. Grobert, P. M. Ajayan, B. G. Sumpter, V. Meunier, M. Wang, Y. Bando and D. Golberg, Proc. Natl. Acad. Sci. U. S. A., 2009, 106, 4591–4595 CrossRef.
- N. Yu, M. Nakajima, Q. Shi, Z. Yang, H. Wang, L. Sun, Q. Huang and T. Fukuda, Scanning, 2017, 2017, 1–11 CrossRef.
- G. Zhong, J. Yang, H. Sugime, R. Rao, J. Zhao, D. Liu, A. Harutyunyan and J. Robertson, Carbon, 2016, 98, 624–632 CrossRef CAS.
- B. R. Lettiere, C. A. C. Chazot, K. Cui and A. John Hart, ACS Appl. Nano Mater., 2020, 3, 77–83 CrossRef CAS.
- K. Z. Milowska, M. Ghorbani-Asl, M. Burda, L. Wolanicka, N. Ćatić, P. D. Bristowe and K. K. K. Koziol, Nanoscale, 2017, 9, 8458–8469 RSC.
- J. A. Rodríguez-Manzo, A. Tolvanen, A. V. Krasheninnikov, K. Nordlund, A. Demortière and F. Banhart, Nanoscale, 2010, 2, 901 RSC.
- X. Song, L. Zhao, J. Wang and Y. Qiao, Nanosci. Nanotechnol. Lett., 2017, 9, 2083–2087 CrossRef.
- K. Z. Milowska, M. Burda, L. Wolanicka, P. D. Bristowe and K. K. K. Koziol, Nanoscale, 2019, 11, 145–157 RSC.
- Y. Matsuda, W.-Q. Deng and W. A. Goddard, J. Phys. Chem. C, 2008, 112, 11042–11049 CrossRef CAS.
- M. G. Williams, F. Gao, I. BenDhiab and A. Teplyakov, Langmuir, 2017, 33, 1121–1131 CrossRef CAS PubMed.
- S. Kaur, N. Raravikar, B. A. Helms, R. Prasher and D. F. Ogletree, Nat. Commun., 2014, 5, 3082 CrossRef.
- A. Chou, P. K. Eggers, M. N. Paddon-Row and J. J. Gooding, J. Phys. Chem. C, 2009, 113, 3203–3211 CrossRef CAS.
- O. Arias De Fuentes, T. Ferri, M. Frasconi, V. Paolini and R. Santucci, Angew. Chem., Int. Ed., 2011, 50, 3457–3461 CrossRef CAS PubMed.
- G. Pacchioni, Nat. Rev. Mater., 2019, 4, 226 CrossRef.
- M. S. Inkpen, Z. Liu, H. Li, L. M. Campos, J. B. Neaton and L. Venkataraman, Nat. Chem., 2019, 11, 351–358 CrossRef CAS.
- K. Boukerma, M. M. Chehimi, J. Pinson and C. Blomfield, Langmuir, 2003, 19, 6333–6335 CrossRef CAS.
- X. T. Le, G. Zeb, P. Jégou and T. Berthelot, Electrochim. Acta, 2012, 71, 66–72 CrossRef CAS.
- A. Berisha, H. Hazimeh, A. Galtayries, P. Decorse, F. Kanoufi, C. Combellas, J. Pinson and F. I. Podvorica, RSC Adv., 2016, 6, 78369–78377 RSC.
- D. Bélanger and J. Pinson, Chem. Soc. Rev., 2011, 40, 3995 RSC.
- N. Shao, S. Dai and D. Jiang, in Aryl Diazonium Salts, Wiley, Weinheim, Germany, 2012, pp. 37–52 Search PubMed.
- D. Jiang, B. G. Sumpter and S. Dai, J. Am. Chem. Soc., 2006, 128, 6030–6031 CrossRef CAS.
- C. Combellas, D. Jiang, F. Kanoufi, J. Pinson and F. I. Podvorica, Langmuir, 2009, 25, 286–293 CrossRef CAS.
- C. P. Nawarathne, A. Hoque, C. K. Ruhunage, C. E. Rahm and N. T. Alvarez, Appl. Sci., 2021, 11, 9529 CrossRef.
- N. T. Alvarez, P. Miller, M. Haase, N. Kienzle, L. Zhang, M. J. Schulz and V. Shanov, Carbon, 2015, 86, 350–357 CrossRef CAS.
- N. T. Alvarez, P. Miller, M. R. Haase, R. Lobo, R. Malik and V. Shanov, Carbon, 2019, 144, 55–62 CrossRef CAS.
- J. P. Perdew, K. Burke and M. Ernzerhof, Phys. Rev. Lett., 1996, 77, 3865 CrossRef CAS PubMed.
- M. Ropo, K. Kokko and L. Vitos, Phys. Rev. B: Condens. Matter Mater. Phys., 2008, 77, 195445 CrossRef.
- P. Giannozzi, S. Baroni, N. Bonini, M. Calandra, R. Car, C. Cavazzoni, D. Ceresoli, G. L. Chiarotti, M. Cococcioni, I. Dabo, A. Dal Corso, S. De Gironcoli, S. Fabris, G. Fratesi, R. Gebauer, U. Gerstmann, C. Gougoussis, A. Kokalj, M. Lazzeri, L. Martin-Samos, N. Marzari, F. Mauri, R. Mazzarello, S. Paolini, A. Pasquarello, L. Paulatto, C. Sbraccia, S. Scandolo, G. Sclauzero, A. P. Seitsonen, A. Smogunov, P. Umari and R. M. Wentzcovitch, J. Phys.: Condens.Matter, 2009, 21, 395502 CrossRef PubMed.
- M. J. Frisch, G. W. Trucks, H. B. Schlegel, G. E. Scuseria, M. A. Robb, J. R. Cheeseman, G. Scalmani, V. Barone, G. A. Petersson, H. Nakatsuji, X. Li, M. Caricato, A. V. Marenich, J. Bloino, B. G. Janesko, R. Gomperts, B. Mennucci, H. P. Hratchian, J. V. Ortiz, A. F. Izmaylov, J. L. Sonnenberg, D. Williams-Young, F. Ding, F. Lipparini, F. Egidi, J. Goings, B. Peng, A. Petrone, T. Henderson, D. Ranasinghe, V. G. Zakrzewski, J. Gao, N. Rega, G. Zheng, W. Liang, M. Hada, M. Ehara, K. Toyota, R. Fukuda, J. Hasegawa, M. Ishida, T. Nakajima, Y. Honda, O. Kitao, H. Nakai, T. Vreven, K. Throssell, J. A. Montgomery Jr, J. E. Peralta, F. Ogliaro, M. J. Bearpark, J. J. Heyd, E. N. Brothers, K. N. Kudin, V. N. Staroverov, T. A. Keith, R. Kobayashi, J. Normand, K. Raghavachari, A. P. Rendell, J. C. Burant, S. S. Iyengar, J. Tomasi, M. Cossi, J. M. Millam, M. Klene, C. Adamo, R. Cammi, J. W. Ochterski, R. L. Martin, K. Morokuma, O. Farkas, J. B. Foresman and D. J. Fox, Gaussian 16, Revision C.01, Gaussian Inc., Wallingford CT, 2016 Search PubMed.
- J. P. Perdew and K. Burke, Phys. Rev. B, 1996, 54, 16533 CrossRef CAS.
- A. D. Becke, J. Chem. Phys., 1998, 98, 5648 CrossRef.
- W. J. Hehre, K. Ditchfield and J. A. Pople, J. Chem. Phys., 2003, 56, 2257 CrossRef.
- M. M. Francl, W. J. Pietro, W. J. Hehre, J. S. Binkley, M. S. Gordon, D. J. DeFrees and J. A. Pople, J. Chem. Phys., 1998, 77, 3654 CrossRef.
- A. V. Marenich, C. J. Cramer and D. G. Truhlar, J. Phys. Chem. B, 2009, 113, 6378–6396 CrossRef CAS.
- B. Mennucci, Wiley Interdiscip. Rev.: Comput. Mol. Sci., 2012, 2, 386–404 CAS.
- J. Tomasi, B. Mennucci and R. Cammi, Chem. Rev., 2005, 105, 2999–3093 CrossRef CAS.
- L. H. Al-Wahaibi, Y. S. Mary, Y. Shyma Mary, A. A. Al-Mutairi, H. M. Hassan, A. A. El-Emam and R. Yadav, J. Mol. Liq., 2022, 348, 118061 CrossRef CAS.
- Z. Bin Ding, M. Tommasini and M. Maestri, Chempluschem, 2017, 82, 924–932 CrossRef.
- G. Henkelman, A. Arnaldsson and H. Jónsson, Comput. Mater. Sci., 2006, 36, 354–360 CrossRef.
- W. Tang, E. Sanville and G. Henkelman, J. Phys.: Condens.Matter, 2009, 21, 084204 CrossRef CAS PubMed.
- J. Svensson and E. E. B. Campbell, J. Appl. Phys., 2011, 110, 111101 CrossRef.
- T. Ketolainen, V. Havu, E. Ö. Jónsson and M. J. Puska, Phys. Rev. Appl., 2018, 9, 034010 CrossRef CAS.
- A. Savin, R. Nesper, S. Wengert and T. F. Fässler, Angew. Chem., Int. Ed. Engl., 1997, 36, 1808–1832 CrossRef CAS.
- M. Kohout, F. R. Wagner and Y. Grin, Theor. Chem. Acc., 2002, 108, 150–156 Search PubMed.
- A. Savin, J. Mol. Struct.: THEOCHEM, 2005, 727, 127–131 CrossRef CAS.
- K. Koumpouras and J. A. Larsson, J. Phys.: Condens.Matter, 2020, 32, 315502 CrossRef CAS.
- V. Vitale, A. Curioni and W. Andreoni, J. Am. Chem. Soc., 2008, 130, 5848–5849 CrossRef CAS.
- C. Yi, S. Bagchi, C. M. Dmuchowski, F. Gou, X. Chen, C. Park, H. B. Chew and C. Ke, Carbon, 2018, 132, 548–555 CrossRef CAS.
- A. Sengupta, Appl. Phys. A: Mater. Sci. Process., 2017, 123, 227 CrossRef.
- R. Dennington, T. Keith and J. Millam, Gauss View, Version 5, Semichem Inc., Shawnee Mission, 2009 Search PubMed.
- N. M. O’boyle, A. L. Tenderholt and K. M. Langner, J. Comput. Chem., 2008, 29, 839–845 CrossRef PubMed.
- N. Piergies, E. Proniewicz, Y. Ozaki, Y. Kim and L. M. Proniewicz, J. Phys. Chem. A, 2013, 117, 5693–5705 CrossRef CAS PubMed.
- L. Benitez and J. M. Seminario, J. Phys. Chem. C, 2016, 120, 17978–17988 CrossRef CAS.
- P. A. Derosa and J. M. Seminario, J. Phys. Chem. B, 2001, 105, 471–481 CrossRef CAS.
- L. Yan and J. M. Seminario, Int. J. Quantum Chem., 2007, 107, 440–450 CrossRef CAS.
- L. A. Jauregui and J. M. Seminario, IEEE Sens. J., 2008, 8, 803–814 CAS.
- J. C. Sotelo, L. Yan, M. Wang and J. M. Seminario, Phys. Rev. A, 2007, 75, 022511 CrossRef CAS.
- R. Dovesi, F. Pascale, B. Civalleri, K. Doll, N. M. Harrison, I. Bush, P. D'Arco, Y. Noel, M. Rera, P. Carbonniere, M. Causa, S. Salustro, V. Lacivita, B. Kirtman, A. M. Ferrari, F. S. Gentile, J. Baima, M. Ferrero, R. Demichelis and M. De La Pierre, J. Chem. Phys., 2020, 152, 204111 CrossRef CAS.
- B. L. Hurley and R. L. McCreery, J. Electrochem. Soc., 2004, 151, B252 CrossRef CAS.
- G. D. Waddill and L. L. Kesmodel, Phys. Rev. B, 1985, 31, 4940–4946 CrossRef CAS.
- M. Delamar, R. Hitmi, J. Pinson and J. M. Saveant, J. Am. Chem. Soc., 1992, 114, 5883–5884 CrossRef CAS.
- M. Mooste, E. Kibena-Põldsepp, M. Marandi, L. Matisen, V. Sammelselg, F. I. Podvorica and K. Tammeveski, J. Electroanal. Chem., 2018, 817, 89–100 CrossRef CAS.
- F. Adel-Mehraban, K. Raeissi, F. Karimzadeh, S. U. Pedersen, H. Salehzadeh and K. Daasbjerg, Prog. Org. Coat., 2021, 154, 106185 CrossRef CAS.
- G. Chamoulaud and D. Bélanger, J. Phys. Chem. C, 2007, 111, 7501–7507 CrossRef CAS.
- J. Lyskawa and D. Bélanger, Chem. Mater., 2006, 18, 4755–4763 CrossRef CAS.
- A. Mesnage, X. Lefèvre, P. Jégou, G. Deniau and S. Palacin, Langmuir, 2012, 28, 11767–11778 CrossRef CAS.
- K. A. Wepasnick, B. A. Smith, K. E. Schrote, H. K. Wilson, S. R. Diegelmann and D. H. Fairbrother, Carbon, 2011, 49, 24–36 CrossRef CAS.
- R. Malik, C. McConnell, N. T. Alvarez, M. Haase, S. Gbordzoe and V. Shanov, RSC Adv., 2016, 6, 108840–108850 RSC.
- N. T. Alvarez, P. Miller, M. R. Haase, R. Lobo, R. Malik and V. Shanov, Carbon, 2019, 144, 55–62 CrossRef CAS.
- A. Felten, C. Bittencourt, J. J. Pireaux, G. Van Lier and J. C. Charlier, J. Appl. Phys., 2005, 98, 074308 CrossRef.
- B. Mahjour, Y. Shen, W. Liu and T. Cernak, Nature, 2020, 580, 71–75 CrossRef CAS.
- I. Amer and S. Brandt, Cogent Eng., 2018, 5, 1499701 CrossRef.
- H. M. Badawi, W. Förner and S. A. Ali, Spectrochim. Acta, Part A, 2013, 112, 388–396 CrossRef CAS.
- E. Akalin and S. Akyüz, Vib. Spectrosc., 2000, 22, 3–10 CrossRef CAS.
- R. Malik, C. McConnell, N. T. Alvarez, M. Haase, S. Gbordzoe and V. Shanov, RSC Adv., 2016, 6, 108840–108850 RSC.
- V. Datsyuk, M. Kalyva, K. Papagelis, J. Parthenios, D. Tasis, A. Siokou, I. Kallitsis and C. Galiotis, Carbon, 2008, 46, 833–840 CrossRef.
- C. Guiderdoni, E. Pavlenko, V. Turq, A. Weibel, P. Puech, C. Estournès, A. Peigney, W. Bacsa and C. Laurent, Carbon, 2013, 58, 185–197 CrossRef CAS.
- M. De Volder, S. H. Tawfick, S. J. Park, D. Copic, Z. Zhao, W. Lu and A. J. Hart, Adv. Mater., 2010, 22, 4384–4389 CrossRef CAS PubMed.
- M. X. Chen, X. H. Song, Z. Y. Gan and S. Liu, Nanotechnology, 2011, 22, 345704 CrossRef CAS PubMed.
- A. Huseinov, C. P. Nawarathne and N. T. Alvarez, ACS Appl. Nano Mater., 2023, 6, 20082–20088 CrossRef CAS.
- S. Ho Choi, B. Kim and C. D. Frisbie, Science, 2008, 320, 1482–1486 CrossRef PubMed.
Footnote |
| † Electronic supplementary information (ESI) available. See DOI: https://doi.org/10.1039/d3na00500c |
| This journal is © The Royal Society of Chemistry 2024 |