DOI:
10.1039/D3MA00730H
(Paper)
Mater. Adv., 2024,
5, 1264-1283
A novel Ni–Schiff base complex for motivating glucose electrooxidation in alkaline solutions
Received
19th September 2023
, Accepted 1st December 2023
First published on 4th January 2024
Abstract
Many Schiff-base complexes of metal ions display enhanced catalytic activities toward redox reactions of many organic compounds; accordingly, application in electrocatalysis is a crucial issue. In this regard, a novel Ni–Schiff base complex (Ni(II)–SB) is synthesized by condensation of 4-(dimethylamino) benzaldehyde with amoxicillin and coordinated with Ni(II). Then, it is ink-cast onto a commercial carbon electrode to be used for electrooxidation of glucose in 0.5 M NaOH solution. Ni(II)–SB is inspected using an FTIR spectrometer and transmission electron microscopy (TEM). The elemental analysis and mapping for the Ni(II)–SB/C electrode surface are carried out using energy dispersive X-ray analyses (EDX) and scanning electron microscopy (SEM), respectively, and the phase structure is investigated using X-ray diffraction (XRD). Different electrochemical techniques are used to evaluate its electrochemical performance. The Ni(II)–SB/C electrode exhibits superior performance towards glucose electrooxidation due to its improved electron transfer ability, and the availability of its intrinsic redox couple of Ni2+/Ni3+. The cyclic voltammetric results indicate an electrochemically active surface area (ECSA) of 15.6 cm2 mg−1 and a surface coverage value of 4.4 × 10⁻⁷ mol cm−2 for the Ni(II)–SB/C electrode in 0.5 M NaOH. An appreciable catalytic activity of 91 mA mg−1 at 0.72 V is estimated for glucose electrooxidation. Moreover, a diffusion coefficient (D) of 1.34 × 10⁻⁵ cm2 s−1 and heterogeneous rate constant (K°) of 1.53 × 105 cm3 mol−1 s−1 with a transfer coefficient (α) of 0.29 were determined for glucose oxidation on the Ni(II)–SB/C electrode. It displays a considerable stability with repeated cycling and with time due to its oxygen affinity. In addition, it shows a good reproducibility and sensitivity value of 42.3 μA cm−2 mM−1 in the linear range from 1.0 mM to 100 mM with a detection limit of 4 μM  . A low charge transfer resistance value of 4.01 Ω cm2 is achieved for glucose electrooxidation on the Ni(II)–SB/C electrode which confirms the fast electron transfer reaction compared with that in 0.5 M NaOH. The optimized geometry, molecular orbital and ground state properties of the SB and Ni(II)–SB catalyst were studied using Density Functional Theory (DFT). The spontaneity of the glucose adsorption on the Ni(II)–SB/C electrode surface is predicted from the values of Einteraction (−34105.4 eV) and Ebinding (34105.4 eV).
1. Introduction
For many years, the glucose oxidation reaction (GOR) has been of crucial importance due to its usage in wide potential applications such as in the development of direct glucose fuel cells (DGFCs),1 implantable glucose fuel cells that use glucose and oxygen existing in body fluids to produce electricity and glucose electrochemical sensors.2,3 In addition, the detection of glucose in analytical applications is a vital issue, such as in clinical diagnostics, the food industry, the treatment of wastewater, and industrial and environmental applications. Glucose as a fuel has many excellent properties such as being carbon neutral, safe for storage, non-toxic and able to release 2.87 × 10³ kJ mol−1 energy by transferring 24 electrons in the complete glucose oxidation to carbon dioxide according to the following reactions:4–7| | | C6H12O6 + 24OH− → 6CO2 + 18H2O + 24e− (anodic reaction) | (1) |
| | | 6O2 + 12H2O + 24e− → 24OH− (cathodic reaction) | (2) |
| | | C6H12O6 + 6O2 → 6CO2 + 6H2O (overall reaction) | (3) |
But, to date, on most noble catalysts the electrooxidation of glucose occurs through a partial oxidation reaction with the release of two electrons producing gluconic acid (gluconate in alkaline solution) according to the following reactions:1,8,9| | | C6H12O6 + 2OH− → C6H12O7 + H2O + 2e− (anodic reaction) | (4) |
| | | ½O2 + H2O + 2e− → 2OH− (cathodic reaction) | (5) |
| | | C6H12O6 + ½O2 → C6H12O7 (overall reaction) | (6) |
Furthermore, glucuronic, oxalic, glyoxylic, and tartaric acids were detected, and traces of glycolic and formic acid were detected via HPLC (high pressure liquid chromatography) analysis.9–11
From the literature, it was found that glucose electrooxidation strongly depends on the electrode materials. Earlier work showed that platinum, gold, palladium and alloys of Pt, Pd, Au and Ag are highly efficient anode catalysts for glucose electrooxidation, but they still suffer from the high cost and high susceptibility to the poisoning effect.12–17 Moreover, non-noble catalysts such as copper, nickel, iron and cobalt have been tested as electrocatalytic materials for the GOR. Different catalytic activity, stability and oxidation products were found depending on the electrode materials.18–24 Focusing on non-noble catalysts, nickel and nickel hydroxide exhibited a promising electrocatalytic performance in alkaline medium due to their low cost, high activity and the possibility of stimulating electron transfer reactions at lower overpotentials.25–31 Moreover, the literature reported that nickel complexes as catalysts showed excellent catalytic activity for oxidation of alcohols in alkaline medium due to the formation of NiOOH species.32–34 The glucose oxidation products were studied and well established on Ni based electrodes in the literature by many authors, where gluconolactone was formed as an oxidation product in alkaline solution.35–37
Nowadays, many interesting studies are being carried out for the development of new Schiff-base complexes of high catalytic activity and stability for electrooxidation processes. Schiff-bases are a group of compounds formed by condensation of primary amine with aldehyde or ketones under specific conditions. They can be prepared easily and they have the ability to form complexes with transition metal ions such as Ni(II), Zn(II), Cu(II), … etc.38 Recently, several investigations were carried out on Schiff-bases compounds and their complexes derived from antibiotics and those which derived from amoxicillin, and they have good antibacterial activity compared to amoxicillin.39,40 To the best of our knowledge, few publications reported the involvement of Schiff-base complexes of metal ions in electrooxidation and electrosensing applications. Recently, Schiff-base complexes displayed appreciable catalytic activities toward many reactions. They are efficient catalysts to increase the reaction yield and selectivity in homogenous and heterogeneous reactions such as oxidation and hydroxylation.41 Due to their oxygen affinity, some Schiff-base complexes are used as catalysts in several reactions such as polymerization, reduction and oxidation of organic compounds. Moreover, due to their high thermal and moisture stability, Schiff-base complexes are used as catalysts in reactions at high temperatures. For example, a self-assembly Pd–Schiff base complex was synthesized and used as an electrochemical sensor towards paracetamol detection.42 Furthermore, complexes based on palladium metal were reported as catalysts for electrochemical sensors, and polybithiophene-palladium, and 3,4-ethylenedioxythiophene (EDOT)-substituted bis(2-pyridylimino)isoindolato-palladium complexes were used as a glucose sensor.43,44 A Ni–Schiff base complex modified carbon paste electrode (MCPE) was prepared and used as anode catalysts for thiosulphate electrooxidation in alkaline medium.45 It showed enhanced electrocatalytic performance due to the electro-generated Ni(III) mediator on the electrode surface with good stability and negligible poisoning effect. Furthermore, quaternized poly(4-vinylpyridine-co-divinylbenzene) material containing a Ni(II)–Schiff base complex was synthesized and used for heterogeneous electrooxidation of ethanol in alkaline solutions.46 The mechanism for the electrooxidation of ethanol was studied on this electrode from cyclic voltammetric results. Additionally, carbon paste containing polystyrene functionalized by a pentadentate Ni(II)–Schiff base complex was prepared and used for the electrooxidation reaction of methanol and its aliphatic analogs.47 It revealed a good electrocatalytic activity towards methanol, ethanol and isopropanol. The Schiff base of the Ni complex, NiII-(N,N′-bis(2,3-dihydroxybenzylidene)-1,2-diaminobenzene)(Ni(II)-2,3dhS) was prepared and used as a sensor for the determination of glucose and fructose in honey.48 It showed a strong electrocatalytic activity towards the oxidation of glucose and fructose in alkaline solutions. In addition, a conductive metallopolymer (Co(III)-Schiff base) on fluorine-doped tin oxide (FTO) electrodes was prepared and used as an efficient glucose sensor using cyclic voltammetry and amperometry.49 It exhibited excellent reproducibility in the manufacturing process, and showed good reproducibility of the measurements for two weeks.
However, further investigations of the catalytic activity and stability of the Schiff-base complex of metal ions are still required. In this regard, the aim of the present work is to synthesize and investigate the electrocatalytic activity of the Ni(II)–Schiff base complex based on amoxicillin and 4-N,N-dimethylaminobenzaldehyde towards glucose electrooxidation in alkaline solutions for possible applications in direct glucose fuel cells and electrochemical glucose sensing. This material is conductive and characterized by a highly conjugated and delocalized π-bond in the ligand that could facilitate the electron transfer and sensing properties. Additionally, it is expected that reasonable electrochemical catalytic activity will be detected for this material and that we will find an explanation for its role in motivating the electrooxidation process by calculating some heterogeneous electron transfer kinetics, such as transfer coefficient (α), standard electron transfer rate constant (k°), diffusion coefficient (D), and charge transfer resistance (Rct). Estimation of these parameters will shed light on the nature of the electron transfer reaction process on the electrode surface, in addition to density functional theory (DFT) calculations.
2. Experimental techniques
2.1. Materials purity and purchasing
All chemicals were of analytical grade and used as received without further purification. D-(+)-Glucose (C6H12O6, 99.5%), sodium hydroxide (NaOH, 99.9%), nickel chloride (NiCl2·6H2O, 99.9%), dimethylformamide (DMF, C3H7NO, 99.5%), amoxicillin (C16H19N3O5S, 95%), 4-N,N-dimethylaminobenzaldehyde (C9H11NO, 99%), paracetamol (C8H9NO2, 98%), ascorbic acid (C6H8O6, 99%), and potassium chloride (KCl, 99.9%) were purchased from Sigma-Aldrich. The solutions were prepared using triple-distilled water of electrical conductivity 17.5 μS cm−1, and dilutions were prepared from stock solutions.
 |
| | Fig. 1 Structure of [Ni(II)(SB)2]2Cl·3H2O. | |
2.2. Preparation of a Schiff-base (SB) and its nano Ni–Schiff base (Ni(II)–SB)
The Schiff base was prepared as reported previously.42 Briefly, to prepare a Schiff-base, in a vessel 10 mmol of amoxicillin trihydrate is dissolved in 25 mL of ethanol. In another vessel 10 mmol of 4-N,N-dimethylaminobenzaldehyde is dissolved in 25 mL ethanol. Both solutions are stirred and heated gently, then, the two solutions are mixed and the obtained mixture is left under a reflux-condition system for 4 h, and finally, the yellowish-orange Schiff-base is filtered, washed, recrystallized and dried. In order to prepare the Ni–Schiff base chelate, the yellowish-orange precipitate product is mixed with nickel(II) chloride drop by drop in a molar ratio of 1![[thin space (1/6-em)]](https://www.rsc.org/images/entities/char_2009.gif) :2 (Ni:SB). The mixture is left under ultrasonic irradiation for a period of 60 min, and the yellow nanoscale precipitate obtained is separated and dried. The elemental analysis is carried out for SB and Ni(II)–SB and the results are as follows:
:2 (Ni:SB). The mixture is left under ultrasonic irradiation for a period of 60 min, and the yellow nanoscale precipitate obtained is separated and dried. The elemental analysis is carried out for SB and Ni(II)–SB and the results are as follows:
C25H28N4O5S: (SB): color: yellowish-orange; found: C, 60.51; H, 5.58; N, 10.99; calcd: C, 60.47; H, 5.68; N, 11.28; Yield: 80%.
C50H62Cl2N8NiO13S2: (Ni(II)–SB): color: yellow; found: C, 50.88; H, 5.20; N, 9.15; calcd.: C, 51.03; H, 5.31; N, 9.52; Yield: 77%.
2.3. Characterization of the prepared materials
The synthesized Schiff-base (SB) material and Ni–Schiff base complex (Ni(II)–SB) are characterized using a FTIR spectrometer (Shimadzu), Vario automatic elemental CHN analyzer, conductivity meter (ORION) model 150, automated UV/Vis-NIR 3101 PC Shimadzu spectrophotometer, and magnetic susceptibility (Cambridge England Sherwood Scientific). Thermogravimetric analysis was done using a Shimadzu TG-50 thermogravimetric analyzer. The microstructure and the elemental mapping are inspected using a scanning electron microscope (SEM) (Quanta FEG 250 (USA) instrument) and the elemental analysis is carried out using Energy Dispersive X-ray Analyses (EDX) with an accelerating voltage of 30 kV, and magnification 14× up to 1000000×. Moreover, the particle size is investigated using a transmission electron microscope (TEM) (model Jeol jem 1400 made in Japan working under 80 V). The phase structure is investigated by X-ray diffraction (XRD) Analytical X’Pert using Cu-Kα radiation (λ = 1.5406 Å). X-ray photoelectron spectroscopy (XPS) was used for investigation of the catalyst chemical composition. It was performed on K-ALPHA (Thermo Fisher Scientific, USA) with monochromatic X-ray Al K-alpha radiation −10 to 1350 eV, spot size 400 μm at pressure 10−9 mbar with a full-spectrum pass energy of 200 eV and at narrow-spectrum 50 eV.
2.4. Measurements
Electrochemical measurements are carried out using a conventional three-electrode conventional cell, consisting of commercial carbon (obtained from spent batteries) as working electrodes, each has a surface area of 0.132 cm2 loaded using a Ni–Schiff base complex. Before the loading process, the carbon electrodes are mechanically polished using metallurgical papers of various grades, then they are subsequently degreased with acetone, rinsed with triply distilled water and dried with soft tissue paper, before being subjected to electrochemical cleaning by cycling in 1.0 M H2SO4 at 0.1 V s−1 for 50 cycles from −1.0 to 1.4 V (Ag/AgCl/Cl−). The Ni–Schiff base complex electrode is prepared using the evaporation method by dissolving 10 mg of the prepared (Ni(II)–SB) complex in 1.0 mL of dimethylformamide (DMF). Then, the solution is stirred using a magnetic stirrer for about 24 hours to obtain homogenous complex catalyst ink. About 10 μL of the complex ink is cast onto the carbon electrode surface and the DMF is left to dry completely under ambient air for 24 hours. The reference electrode is the [Ag/AgCl/Cl−] E° = [197 mV vs. NHE] and the counter electrode is a Pt sheet separated from the working electrode compartment by glass fritt. Measurements are carried out at room temperature of 25 ± 2 °C in 0.5 M NaOH solution. Electrochemical measurements are performed using cyclic voltammetry, choronoamperometry, Tafel plots, and electrochemical impedance spectroscopy (EIS). EIS measurements are recorded within a frequency range from 1.0 to 100 kHz at an alternating current amplitude of 5 mV. All electrochemical studies are performed using a potentiostat (CHI 660 Potentiostat/Galvanostat).
For the computational studies, Density Functional Theory (DFT) is used to study the geometry optimization for SB and Ni(II)–SB chelate at the B3LYP/6-311G and B3LYP/LANL2DZ levels of theory, respectively, using the Gaussian 09 program.50
3. Results and discussion
3.1. Characterization
The elemental analysis reported above in the preparation section confirms the formation of the Ni(II)-chelate with a molar ratio of (Ni:2SB) and the obtained results have a satisfactory agreement with the calculated data. The molar conductance measurement (125 μs m2 mol−1) reveals the electrolytic behavior of the formed chelate which supports the presence of ionic chloride in its outer coordination sphere. Moreover, several techniques are used to evaluate the chemical structure of the synthesized chelate. The FTIR technique provides important characteristic bands through Fig. 2 and Table 1. The parent amoxicillin starting drug displays four characteristic bands at 3442, 3200, 1775 and 1688 cm−1 related to υ(OH), υ(NH2), υ(C![[double bond, length as m-dash]](https://www.rsc.org/images/entities/char_e001.gif) O) β-lactam and υ(CO) amide groups, respectively, as discussed previously by Safaa et al.42 After the Ni–Schiff base formation, the new band is observed at 1613 cm−1 corresponding to the stretching vibration of the (CN) group, and the bands related to the υ(CO) amide and υ(CO) β-lactam are slightly shifted to 1770 and 1685 cm−1, respectively. The bands that are responsible for the coordination of the Schiff-base to the Ni(II) ion are shifted to lower values as presented in Table 1, as the azomethine and the υ(CO) groups are shifted to 1604 cm−1 and 1658 cm−1, respectively. The previous coordination forms new bands due to the bonding between Ni(II) ion with the carbonyl oxygen and nitrogen imine groups. The new bands that are observed at 408 and 308 cm−1 are related to υ(Ni–O) and υ(Ni–N) bonds, respectively.51–53 Finally, the hydrated water molecule of the chelate is observed at 3471 cm−1.
O) β-lactam and υ(CO) amide groups, respectively, as discussed previously by Safaa et al.42 After the Ni–Schiff base formation, the new band is observed at 1613 cm−1 corresponding to the stretching vibration of the (CN) group, and the bands related to the υ(CO) amide and υ(CO) β-lactam are slightly shifted to 1770 and 1685 cm−1, respectively. The bands that are responsible for the coordination of the Schiff-base to the Ni(II) ion are shifted to lower values as presented in Table 1, as the azomethine and the υ(CO) groups are shifted to 1604 cm−1 and 1658 cm−1, respectively. The previous coordination forms new bands due to the bonding between Ni(II) ion with the carbonyl oxygen and nitrogen imine groups. The new bands that are observed at 408 and 308 cm−1 are related to υ(Ni–O) and υ(Ni–N) bonds, respectively.51–53 Finally, the hydrated water molecule of the chelate is observed at 3471 cm−1.
 |
| | Fig. 2 FTIR spectrum for SB and Ni(II)–SB. | |
Table 1 Infrared spectral data of “Schiff base (SB)” and its (Ni(II)–SB) complex (cm−1)
| Compound |
υ(CN) |
υ(CO) |
υ(Ni–O) |
υ(Ni–N) |
| SB |
1613 |
1685 |
— |
— |
| [Ni(SB)2]Cl2 |
1604 |
1658 |
408 |
308 |
Thermogravimetric analysis (TGA) is used to investigate the thermal stability of the prepared material ([Ni(II) (SB)2]2Cl·3H2O) complex (its structure is presented in Fig. 1) under different temperatures. The TGA profile for the Ni(II)–SB catalyst is given in Fig. 3. The scan rate of heating is 10 °C min−1, the organic ligand decomposed in fast consequence steps and finally gave the stable residual precipitate. Obvious three decomposition steps with the final residual precipitate of Ni metal at high temperature are observed. In the first step, evaporation of the hydrated water molecules occurred with mass loss (obs. = 5.38%, calcd = 4.68%) at a temperature ∼<100 °C. The following step represents the degradation of [2Cl + 2(OH) + 2(C8H13N)] at a weight loss of (obs. = 29.62%, calcd = 30.31%). Finally, the decomposition of all remaining organic moieties reveals a weight percentage drop (obs. = 59.55%, calcd = 59.91%) to give Ni metal as a final residual precipitate as mentioned before with residual percentage (obs. = 5.45%, calcd = 5.09%). The magnetic moment value of Ni(II)–SB chelate is equal to 0.0 B.M. which corresponds to its diamagnetic nature and supports the square planar geometry shape. The SB and its Ni(II) complex electronic absorptions are screened at room temperature. The absorption spectra show transitions at 230 and 356 nm. These two bands can be interpreted as being due to the transition of intraligand aromatic ring π → π* and n → π* of (CN) and (CO) groups as reported previously.54 The two previous transitions are observed at 288 and 339 nm within the Ni(II) chelate and the weak band at 418 nm could be attributed to a (1Alg→ lA2g) transition which is expected for the absorption by square planar species.55,56 The Ni(II)–SB and its parent ligand (SB) structure are shown in Fig. 1. Finally, the different techniques used in this work support its suggested chemical structure.
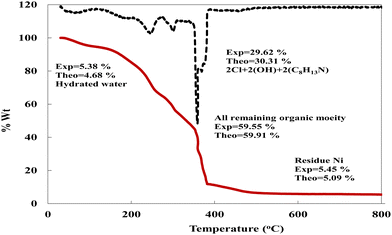 |
| | Fig. 3 TG curve of the prepared Ni(II)–SB complex. | |
The shape, surface morphology and particle size of the prepared Schiff-base complex of Ni are inspected using a TEM image (Fig. 4a). It is clear from the image that a collected rod shaped structure interconnected with each other is observed. The individual nanoparticle diameter ranges from ∼39.8 to 60.6 nm. Moreover, the surface morphology of the ink-cast Ni-complex is characterized using a scanning electron microscope (SEM) (Fig. 4b). Rectangular leaf-shapes intertwined with each other appear on the electrode surface. Additionally, an X-ray diffractogram for Ni(II)–SB/C is recorded with a 2θ value from 5° to 80° (Fig. 4c). It indicates peaks at about 2θ of 26.5° and 54.5° corresponding to carbon (0 0 2) and (0 0 4), respectively, according to JCPDS file No. [01-082-9928]. Another broad peak at 2θ of 44.5° is detected corresponding to Ni (0 1 1) according to JCPDS file No. [00-045-1027], and the crystallite size of Ni is about 5.2 nm as estimated from the XRD data based on Scherer's equation.52,53 Moreover, the broad peak of Ni and its lower intensity indicates the nanocrystalline nature of the prepared material.
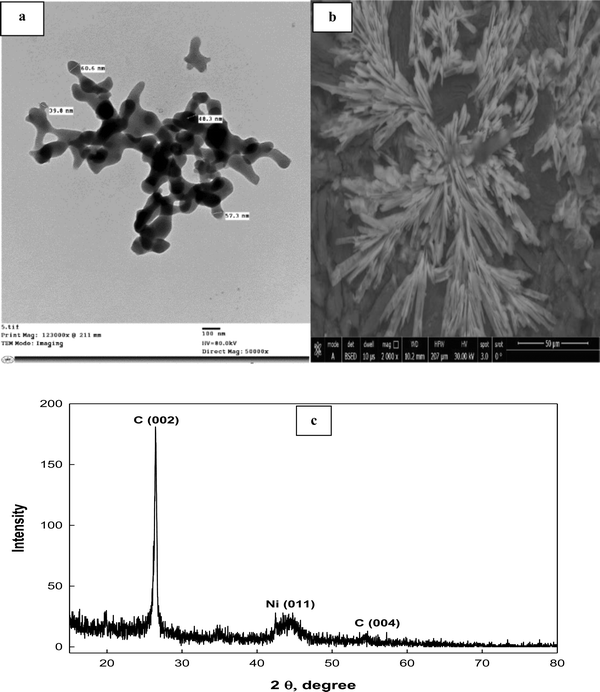 |
| | Fig. 4 (a) TEM, (b) SEM images, and (c) XRD pattern of the Ni(II)–SB/C complex. | |
The elemental analysis and elemental mapping are performed using EDX and SEM, respectively (Fig. 5). EDX analysis shows different elements present in the Ni(II)–SB/C electrode with different wt% and at% of each element as shown in the inset data of EDX (Fig. 5a). It is found that the prepared Ni(II)–SB/C complex contains about 1.99 wt% Ni. Fig. 5(b)–(g) represents the elemental distribution of Ni, N, C, O, Cl, and S on the electrode surface. Homogenous distribution of each element on the electrode surface is observed.
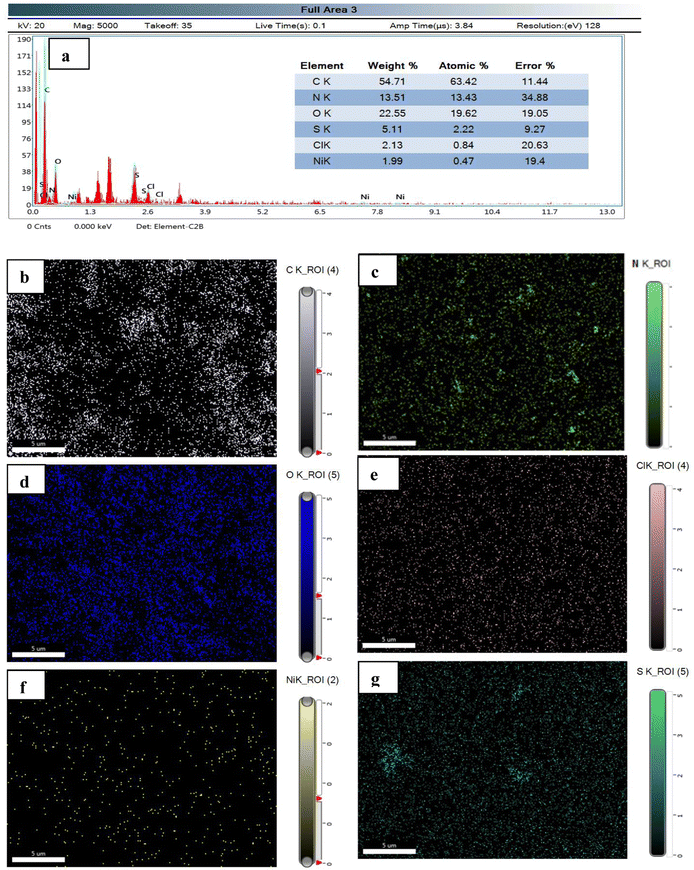 |
| | Fig. 5 (a) EDX analysis with the inset data of wt% and at% of each element, and (b)–(g) elemental mapping of each element of the prepared Ni(II)–SB complex. | |
3.2. DFT calculations
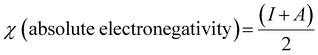
Density functional theory (DFT) calculations can give affirmation of the coordination process and the structure of Ni(II) chelate through measuring the bond lengths and angles with the evaluation of the electron density distribution. The calculations are performed using the Gaussian09 program using the basis set 6-311G for SB and LANL2DZ for Ni(II) chelate as observed in Fig. 6a. The optimization involved changes in the bond lengths and angles to help the formation of the chelate as tabulated in Table 2. The most important bond lengths that are changed by lengthening and shortening are (C12–O22) and (N14–C27) which involve the donor centers of donation; this may support the chelate formation by changing the double bond behavior of the carbonyl and azomethine groups with the formation of new bonds which represent the chelation sphere that are Ni–O and Ni–N bonds. Also, several bond angles are changed as (C27–N14–C13), (C13–C12–C22) and (N11–C12–O22). The bond angle values confirm the square planar geometry shape of the studied Ni(II)–SB chelate. Many ground state parameters are estimated for each SB and its Ni(II)–SB chelate that are mentioned in Table 3 and can be calculated using the formulas below:| | | I (ionization potential of the compound) = −EHOMO, | (7) |
| | | A (electron affinity of the compound) = −ELUMO | (8) |
| |  | (9) |
| |  | (10) |
| |  | (11) |
| |  | (12) |
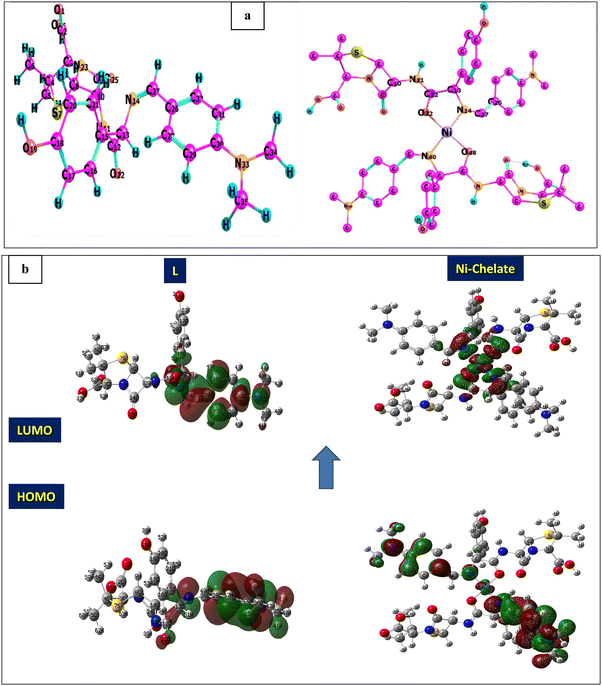 |
| | Fig. 6 (a) Optimization geometry, and (b) (HOMO and LUMO) graphs of SB and the Ni(II)–SB complex. | |
Table 2 Some of the optimized bond lengths in Å and bond angles in degrees, for ligand SB and its Ni(II)–SB complex
| Bond length (Å) |
SB |
Ni(II)–SB |
Bond angles (Deg.) |
SB |
Ni(II)–SB |
|
R(C13–N14) |
1.47618 |
1.48498 |
A(C27–N14–C13) |
120.558 |
124.140 |
|
R(N14–C27) |
1.30404 |
1.33290 |
A(C13–C12–C22) |
120.269 |
118.684 |
|
R(C12–C13) |
1.54256 |
1.53515 |
A(N11–C12–O22) |
120.274 |
119.933 |
|
R(C12–O22) |
1.25124 |
1.29172 |
A(N14–Ni–O22) |
— |
84.893 |
|
R(C12–N11) |
1.37189 |
1.33817 |
A(N14–O22–N40) |
— |
90.709 |
|
R(Ni–O22) |
— |
1.87230 |
|
|
|
|
R(Ni–N14) |
— |
1.91455 |
|
|
|
Table 3 Ground state properties of the SB and its Ni(II)–SB complex
| Parameter |
SB |
Ni(II)–SB complex |
|
E
T, Hartree |
−1924.58595 |
−3317.94441 |
|
E
HOMO, eV |
−5.47 |
−9.54 |
|
E
LUMO, eV |
−1.83 |
−6.92 |
| ΔE, eV |
3.64 |
2.62 |
|
I = −EHOMO, eV |
5.47 |
9.54 |
|
A = −ELUMO, eV |
1.83 |
6.92 |
|
χ, eV |
3.65 |
8.23 |
|
η, eV |
1.82 |
1.31 |
|
S, eV−1 |
0.27 |
0.38 |
|
μ, eV |
−3.65 |
−8.23 |
| Dipole moment (Debye) |
2.51 |
8.2968 |
At first, after chelation, the energy value becomes more negative which enhances the chelate formation. The energy gap of the chelate is lower than that in its parent ligand indicating its higher activity in forming the investigated Ni(II)–SB chelate. The generated energy diagrams of the molecular orbitals (HOMO and LUMO) are introduced in Fig. 6b. Both HOMO and LUMO electron densities of the (SB) ligand are distributed along the dimethylaminobenzylidene moiety with similar distribution in the HOMO's chelate, while in the case of the LUMO' Ni(II)–SB chelate are located over the coordination sphere. Fig. 6b shows that, the high electron density is found at the hetero atoms as the oxygen O22 and nitrogen N14 atoms in the geometrical structure of the (SB) ligand with atomic charges in approximately −0.428 and −0.364, respectively. These charges are decreased after chelation to values of −0.375 and −0.344, respectively, with increasing the electron density of the Ni ion from +2 to +0.530 that supports the chelation process.
3.3. Electrochemical characterization
The electrochemical catalytic activity of the Ni(II)–SB/C electrode is estimated in 0.5 M NaOH solution using cyclic voltammetry at a scan rate of 0.02 V s−1 in the potential range from 0 to 1.0 V (Ag/AgCl/Cl−) (Fig. 7). Two well defined peaks are observed in both anodic and cathodic half cycles (black lines) at 0.55 and 0.38 V, probably due to the formation of the NiOOH and Ni(OH)2 redox couple, respectively,31,57,58 according to eqn (13) and (14):| | | [Ni(II)–SB] + OH− → [Ni(II)–SB(OH)]− | (13) |
| | | [Ni(II)–SB(OH)]− = [Ni(III)–SB(OH)] + e− | (14) |
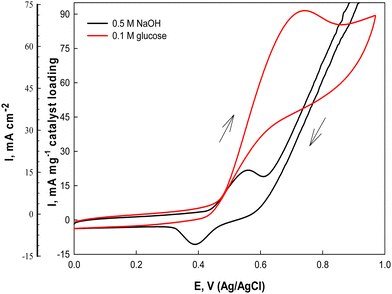 |
| | Fig. 7 Cyclic voltammograms of the Ni(II)–SB/C electrode in 0.5 M NaOH and in the presence of 0.1 M glucose at 0.02 V s−1. | |
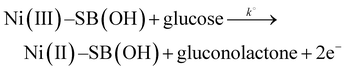
The on-set potential of NiOOH formation is at about 0.45 V, the oxidation peak potential of NiOOH formation is at about 0.55 V and the oxidation peak current density of NiOOH is 15.7 mA cm−2 and 22.6 mA mg−1 for the Ni(II)–SB/C electrode in 0.5 M NaOH. Additionally, the electrocatalytic activity of the Ni(II)–SB/C is inspected in the presence of 0.1 M glucose in the same potential range at 0.02 V s−1. By adding 0.1 M glucose, an increment of the peak current in the anodic direction corresponds to the irreversible oxidation of glucose starting from 0.45 V reaching its maximum value at the peak in the anodic direction at 0.72 V (the red line of Fig. 7). Another re-oxidation peak at 0.65 V is observed in the reverse direction but with relatively small oxidation current probably due to the oxidation of glucose or the intermediates formed during the forward oxidation.48,59,60Eqn (15) represents the reaction between the catalytic Ni(III) species and a glucose molecule in solution, where k° is the heterogeneous reaction rate of this reaction. The oxidation process of glucose starts in conjunction with the formation of a nickel oxyhydroxide [Ni(III)] compound at about +0.45 V according to the following reaction (15):
| |  | (15) |
Gluconolactone is the main oxidation product of glucose in alkaline solution on Ni-based electrodes which is confirmed in the literature by many authors.
35–37 It is worth noting that the fabricated Ni(
II)–SB/C electrode shows an appreciable catalytic activity for the anodic oxidation of glucose in 0.5 M NaOH with an oxidation current density value of 69.5 mA cm
−2 and 91 mA mg
−1 catalyst loading at a potential value of 0.72 V. By comparing our results with Ni-based catalysts reported in the literature [
Table 4], it is clear that the catalytic activity of our Ni(
II)–SB/C electrode is better than those electrodes.
Table 4 A comparison of the efficiency of the synthesized Ni(II)–SB/C catalyst with those of Ni-modified electrodes reported in the literature in terms of the oxidation peak potential and oxidation peak current density
| Electrode |
Electrolyte |
E
p (V) |
I
p, mA cm−2 |
I
p, mA mg−1 |
Ref. |
| Ni(II)–SB/C |
0.5 M NaOH + 0.1 M glucose |
0.72 V (Ag/AgCl) |
69.5 |
91 |
This work |
| Ni(II)-2,3dhS/CNTSPE |
0.1 M NaOH + 0.1 mM glucose |
0.55 V (Ag) |
2.5 × 10⁻⁶ A |
— |
48
|
| Metallopolymer (cobaltate (III)-SB)/FTO |
0.1 M KOH + 1.0 mM glucose |
0.36 V (Ag/AgCl) |
20 |
— |
49
|
| Ni (99.99%) |
0.1 M NaOH + 1 mM glucose |
0.48 V (SCE) |
3.4 |
— |
66
|
| Ni-P-TiO2 |
0.5 M NaOH + 0.1 M glucose |
0.86 V (MMO) |
55 |
— |
67
|
| NiO nanosheet |
1 M KOH + 5.0 mM glucose |
1.5 V (RHE) |
3.1 |
— |
68
|
| GC/MWNT/NiO |
0.1 M NaOH + 0.05 M glucose |
0.58 V (Ag/AgCl) |
10.5 |
|
69
|
| NiCuO/ITO |
1.0 M KOH + 30 mM glucose |
0.72 V (Ag/AgCl) |
22.6 |
|
70
|
| Nickel/porous carbon silica |
0.1 M KOH + 1.0 mM glucose |
0.65 V |
— |
2.6 |
71
|
| (Ni/AB) Ni6/acetelene black |
0.1 M KOH + 5.0 mM glucose |
1.47 V RHE |
|
5 |
72
|
| –Ni–Gr/GCE |
0.5 M NaOH + 1 mM glucose |
0.45 Ag/AgCl |
— |
0.176 |
|
| –Ni–NGr/GCE |
|
|
— |
0.8 |
73
|
| NiO |
0.5 M NaOH + 1 mM glucose |
0.5 V |
— |
1.5 |
74
|
| –Ni/rGO/GC |
0.1 M KOH + 1 mM glucose |
1.3 V (RHE) |
4.6 |
|
|
| –Cu–Ni/rGO/GC |
|
1.3 |
5.3 |
|
|
| –Pd–Ni/rGO/GC |
|
1.2 V (RHE) |
8.7 |
|
|
| –Pd–Cu–Ni/rGO/GC |
|
0.7 V (RHE) |
14.2 |
— |
75
|
XPS is a good tool that is used for estimation of the chemical compositions and states of catalysts. Fig. 8a indicates the XPS survey spectra of Ni(II)–SB/C catalyst before and after glucose oxidation. Peaks of carbon, oxygen, nitrogen, sulfur, chlorine, and nickel appear in the survey which additionally confirms the structure of Ni(II)–SB/C. It is noticeable that the intensity of peaks after glucose oxidation is higher than those obtained before glucose oxidation and the slight shift in binding energy could be due to the electronic interaction between the catalyst species and the glucose oxidation products. The peaks situated at 163.03, 200. 2, 285.51, 400.85, 532.13, and 857.17 eV are for S 2p, Cl 2p, C 1s, N 1s, O 1s, and Ni 2p, respectively. For the Ni(II)–SB/C catalyst before the glucose oxidation, the XPS spectra of Ni 2p (Fig. 8b) show seven peaks at binding energies of 855.91, 859.75, 863.23, 867.3, 872.66, 875.6, and 880.05 eV. The peaks that appeared at 855.91 and 859.75 eV are assigned to Ni2+ 2p3/2 of Ni(OH)2 and Ni3+ 2p3/2 of NiOOH,31,61 respectively. The peak at 863.23 eV is a satellite peak of Ni2+ 2p3/2 and the peak at 867.3 eV is a satellite peak of Ni3+ 2p3/2. The peaks at 872.66 and 875.6 eV are due to Ni2+ 2p1/2 and Ni3+ 2p1/262,63 and the peak at 880.05 eV is a satellite peak for the nickel complex. For the catalyst after glucose oxidation (Fig. 8b′), the same seven peaks appeared but with a slight shift in binding energy as shown at 855.97, 857.95, 862.38, 867.59, 873.61, 877.49, and 880.36 eV. Accordingly, it can be concluded that the formation of Ni(OH)2 and NiOOH species is responsible for the catalytic activity of the Ni–Schiff base catalyst. So, the oxidation of glucose on the Ni(II)–SB/C electrode is proposed to occur via a reaction with Ni(III) species that formed on the electrode surface, where Ni(III) acts as an electron transfer mediator for the oxidation process of organic compounds such as glucose and alcohols, where the adsorption of the glucose molecule occurs before the oxidation reaction takes place.24,64,65 A reaction rate of 3.60 × 10⁻⁷ mol cm−2 s−1 is estimated for the glucose oxidation reaction on the Ni(II)–SB/C electrode using eqn (16).
| | | Electrochemical reaction rate = i/nF | (16) |
where
i is the oxidation current in A cm
−2 and
n is the number of electrons transferred which equals 2 and
F is the Faraday constant which equals 96
500 C mol
−1.
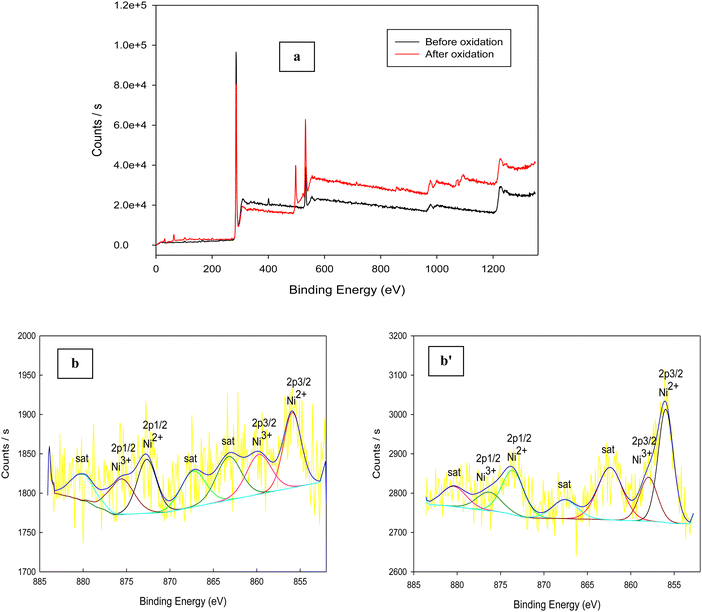 |
| | Fig. 8 XPS survey of (a) Ni(II)–SB/C electrode in 0.5 M NaOH: before and after glucose oxidation and (b) and (b′) XPS spectra for Ni before and after glucose oxidation, respectively. | |
The Schiff-base is considered as a platform for homogenous distribution of Ni and it can be demonstrated from the mapping images (Fig. 5f). Moreover, based on the principle that nanomaterials increase the specific surface area, our sample is prepared in the nano-size to increase the activity performance. Furthermore, a Schiff base provides a larger surface area for NiOx as well as for glucose adsorption and accordingly, the number of redox active sites increases, as reported in other work.76 The crucial factor for the high catalytic activity of Ni(II)–SB/C is the small particle size of the Ni(II)–SB/C catalyst as shown in the TEM results (see Fig. 4a), the average particle size of the catalyst is about 50 nm, and the intrinsic formation of Ni2+/Ni3+ redox couples. Moreover, the crystallite size of Ni is about 5.2 nm as estimated from XRD data (Fig. 4c). Furthermore, the electrochemical active surface areas (ECSAs) of nickel based electrocatalyst can be estimated from the cyclic voltammogram (Fig. 7) and the following eqn (17):70,77–82
| |  | (17) |
where, the charge
Q (mC) represents the reduction peak of Ni(
III)/Ni(
II) and it can be obtained by integrating the area under the reduction peak of the cyclic voltammogram (
Fig. 7) divided by the scan rate (
υ). A charge of 0.257 mC cm
−2 is required for the formation of a monolayer of Ni(
II) and
m is the loading amount of the catalyst which equals 0.1 mg. A value of 15.6 cm
2 mg
−1 is estimated for the electrochemical active surface area of the Ni(
II)–SB/C electrode, so, its high catalytic activity is attributed to its relatively high active surface area.
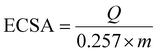
To determine the surface coverage Γ* of the Ni(II)–SB/C electrode by NiOOH species, the electrode is subjected to a cyclic mode at different scan rates from 0.01 to 0.5 V s−1 in 0.5 M NaOH. Fig. 9(a) and (b) illustrates typical cyclic voltammograms of Ni(II)–SB/C electrode in 0.5 M NaOH in the potential range from 0 to 1.0 V (Ag/AgCl/Cl−). It is worth noting that with increasing the scan rate from 0.005 to 0.5 V s−1, the cyclic voltammograms display a continuous increasing of both anodic and cathodic peak currents accompanied by an anodic peak potential shift towards the positive direction and a cathodic peak potential shift towards a less positive direction that makes the peak-to-peak difference ΔEP greater. The ratio between Ipa and Ipc does not equal unity and indicates a slow electrochemical process of the Ni(II)/Ni(III) redox couple.
 |
| | Fig. 9 (a) and (b) Cyclic voltammograms of the Ni(II)–SB/C electrode at different scan rates in 0.5 M NaOH. (c) and (d) The dependence of anodic (the solid dots) and cathodic (the open dots) peak currents on the scan rates. (e) Ipa,cvs. square root of scan rates and (f) dependence of peak potentials on the natural logarithm of the scan rates. | |
It is clear that the anodic and cathodic peak currents are proportional to the scan rates especially in the range from 0.005 to 0.1 V s−1 (Fig. 9c and d) which illustrates the electrocatalytic activity of the surface Ni redox species.83 Also, from this relationship (Fig. 9d), the surface coverage of the Ni redox species can be determined from the slopes of the straight lines using the following eqn (18):
where
Ip is the oxidation peak current density in amperes,
Γ* is the surface coverage of the redox species in mol cm
−2,
υ is the potential scan rate in V s
−1,
A is the surface area of the electrode (0.132 cm
2),
R is the general gas constant which equals 8.314 J K
−1 mol
−1,
n is the number of transferred electrons which equals 1 for the Ni(
II)/Ni(
III) redox reaction and
F is the Faraday constant which equals 96
500 C mol
−1. Taking the average of both cathodic and anodic results, a
Γ* value of around 4.4 × 10
−7 mol cm
−2 is estimated for the Ni(
II)–SB/C electrode, which is close to that reported for NiO/GC which is 4.5 × 10
−7 mol cm
−2,
27 and it is less than that obtained on Ni/Cr nanoparticles which is 1.4 × 10
−6 mol cm
−2.
84
A linear relationship is found between the square root of the scan rates (0.005–0.5 V s−1) and the anodic and cathodic peak currents (Fig. 9e) illustrating diffusion controlled processes. By monitoring the Ep variation over a wide range of scan rates (Fig. 9f), the rate constant (k) and transfer coefficient (α) for reaction (13) can be calculated using the slope and intercept values of the linear plot given in Fig. 9f based on the following expression (eqn (19))85
| | | Ep − E° = (RT/αnF)ln(RT/αnF) + (RT/αnF)lnK − (RT/αnF)lnυ | (19) |
where,
υ is the potential scan rate in V s
−1,
R is the general gas constant which equals 8.314 J K
−1 mol
−1,
n is the number of transferred electrons (
n = 1 for Ni(
II)/Ni(
III) redox reaction),
F is the Faraday constant which equals 96
500 C mol
−1 and
E° is the standard electrode potential of Ni(
II)/Ni(
III).
86 The behavior shows a quasi-reversible system with an electron transfer coefficient value of 0.22 and an electron transfer rate constant
K value of 0.76 s
−1 is determined for the Ni(
II)/Ni(
III) redox
reaction (14). This value is less than that reported for the NiO/GC electrode which is 2.57 s
−1 as determined elsewhere.
27
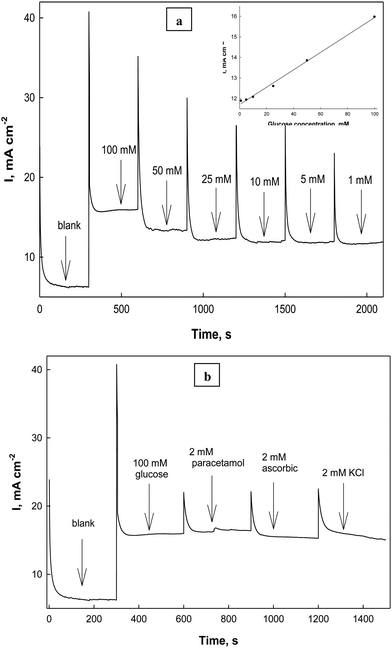
To study the effect of changing the glucose concentrations on the oxidation current densities, Fig. 10 illustrates the electrode responses as a function of glucose concentrations in the electrolyte solution (0.5 M NaOH) at a scan rate 0.02 V s−1. The anodic oxidation peak current increases as the bulk concentration of glucose increases starting from 1.0 mM up to 100 mM glucose as a fraction of the active sites of the Ni(II)–SB/C electrode is occupied by glucose molecules and it shows a linear relationship in this range. At 100 mM, complete saturation of active sites takes place and beyond 100 mM glucose, a deviation from linearity occurs, which could be due to the passivation of the electrode surface or adsorption of the oxidation products of glucose at the electrode active sites.65 So, the oxidation peaks current decreases probably due to decreasing the number of sites for glucose adsorption, along with the poisoning of the electrode surface by intermediate products at high concentrations of glucose and consequently a decrease in the overall rate of the glucose oxidation. A slope of approximately 453 μA cm−2 mM−1 can be computed from Fig. 10. From the logarithmic relationship (the inset plot of Fig. 10) between the oxidation peak current densities and the concentrations of glucose, the order of the reaction with respect to glucose can be obtained from the slope of this plot and it is equal to 0.45.
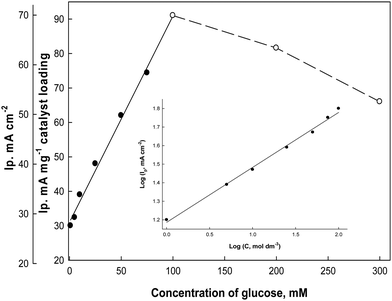 |
| | Fig. 10 Effect of glucose concentrations on the oxidation peak current densities of glucose in 0.5 M NaOH at 0.02 V s−1 (from cyclic voltammograms, not presented), and the inset plot represents the logarithmic relationship between the concentrations and the oxidation peak current densities. | |
Investigation of glucose electrooxidation at different scan rates in 0.5 M NaOH in the presence of 0.1 M glucose (Fig. 11a) indicates that the cathodic current of the NiOOH peak decreases, which indicates the rate-determining step involves glucose and that it is incapable of reducing the whole Ni(III) species formed in the oxidation cycle. Fleishmann et al.65 reported that the oxidation reaction of organic compounds with oxides of high valences is usually the rate-determining step. According to this assumption the above eqn (14) is the slow step for glucose oxidation. The value of electron transfer coefficient for the reaction which is totally irreversible-diffusion controlled can be obtained from the slope of Fig. 11b and eqn (20):87
| | | Ep = (RT/αnF)lnυ + constant | (20) |
where,
α is the transfer coefficient,
υ is the potential scan rate in V s
−1,
n is the number of transferred electrons (
n = 2),
R is the general gas constant which equals 8.314 J K
−1 mol
−1,
F is the Faraday constant which equals 96
500 C mol
−1 and
T is the absolute temperature (298 K). Using the dependency of anodic peak potential on the natural logarithm of the potential scan as shown in
Fig. 11b, the slope of this straight line equals 0.044 V and the electron transfer coefficient (
α) for glucose oxidation at the Ni(
II)–SB/C electrode is 0.29, which is close to that reported elsewhere for glucose electrooxidation catalyzed by transition metal ions (Ni ions) in alkaline solution that is 0.209.
88Fig. 11c shows the function (
Ip/
υ1/2) dependency with
υ obtained at the Ni(
II)–SB/C electrode. It is clear that
Ip/
υ1/2 decreases with increasing the scan rate and at high scan rate it does not change significantly with the scan rate. This behavior is reported as a feature of catalytic reactions,
65i.e., the EC mechanism, represented by
eqn (14) and (15).
 |
| | Fig. 11 (a) Cyclic voltammograms of Ni(II)–SB/C electrode in 0.5 M NaOH + 0.1 M glucose at different scan rates, (b) the relationship between the natural logarithms of scan rates and the peak potentials, and (c) the Ip/v0.5vs. scan rates relationship for glucose electrooxidations obtained at the Ni(II)–SB/C electrode. | |
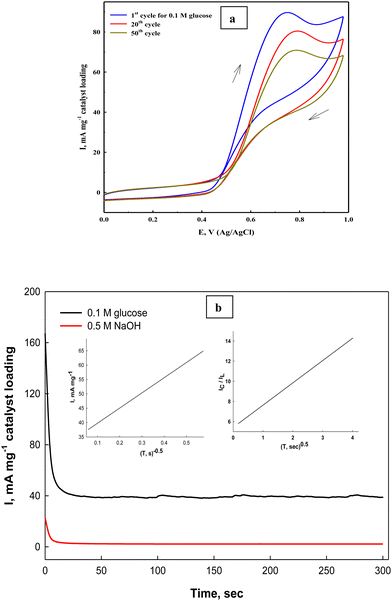
The stability of the fabricated Ni(II)–SB/C electrode is studied by cyclic voltammetry and chronoamperometry. The prepared Ni(II)–SB/C electrode displays appreciable stability with repeated cycling in 0.5 M NaOH + 0.1 M glucose at a scan rate of 0.02 V s−1 (Fig. 12a), and the efficiency after 50 cycles reaches about 82% on the studied Ni(II)–SB/C electrode. The partial loss of the electrode catalytic activity could be due to the adsorption of reaction intermediates on its active sites, which is probably CO. Bae et al.89,90 demonstrated by Fourier transform IR spectroscopy that the main absorbed intermediate in glucose oxidation in both acidic and alkaline solutions is CO, similar to the oxidation of small organic molecules such as CH3OH, HCOOH, and HCHO.
 |
| | Fig. 12 (a) Repeated cyclization of the Ni(II)–SB/C electrode in 0.5 M NaOH +0.1 M glucose, and (b) chronoamperometry of the same electrode at 0.72 V and the inset plots represent I and 1/square root of time (left) and the relationship of IC/IL and square root of time (right). | |
On the other hand, the stability of the electrode towards glucose electrooxidation is studied by applying a chronoamperometeric technique at a constant potential of 0.72 V for 300 s. in 0.5 M NaOH + 0.1 M glucose (Fig. 12b). It can be seen that at the beginning of the oxidation process, the oxidation current density is high due to the fast oxidation of glucose adsorbed on the electrode surface, and the active sites of the catalyst are free and available to bind and oxidize the glucose molecules, and after a while the oxidation products are formed and could be accumulated on the surface of the electrode. This could partially block the active sites along with decreasing the number of sites available for glucose adsorption and the overall rate of glucose oxidation. Consequently, the oxidation current decreased, then it reaches nearly a constant steady state current after a short time indicating its considerable stability, and this behavior is confirmed by other authors.91 Moreover, the kinetics of the process becomes mainly a diffusion controlled one. As mentioned in the introduction section,42 the Ni–Schiff base complex has some oxygen affinity that could help in complete oxidation of glucose and/or the intermediate products of its oxidation and lead to regeneration of the electrode surface from any poisoning species resulting from the oxidation process and therefore, it could increase its stability with time. Moreover, the nanostructure of the Schiff-base complex could increase the stability and enhance the long-term stability towards the oxidation process. On the other hand, the Ni(II)–SB/C electrode's operative durability is tested by examining the same electrode in 0.5 M NaOH in the presence of 0.1 M glucose ten times and measuring the electrode response. Approximately the same response with a slight decrease in the oxidation current is observed (RSD = 0.923%, SD = 0.834, n = 10), which reflects the considerable reproducibility of the prepared Ni(II)–SB/C electrode.
In addition, the diffusion coefficient of glucose on Ni(II)–SB/C is calculated from Cottrell eqn (21)83 assuming that the oxidation process of glucose is a diffusion controlled process.
| | | I = nFAD0.5Cπ−0.5t−0.5 | (21) |
where,
I is the oxidation current in amperes,
n is the number of electrons exchanged in glucose electrooxidation (
n = 2),
C is the concentration of glucose (0.1 mol L
−1),
A is the geometrical electrode area which equals 0.132 cm
2,
F is Faraday's constant which equals 96
500 C mol
−1,
D is the diffusion coefficient (cm
2 s
−1) and
t is the time in seconds. Using the slope of the straight line between the net current after removing the background current and the inverse of the square roots of time (the inset plot (left) of
Fig. 12b), a diffusion coefficient value of 1.34 × 10
−5 cm
2 s
−1 is found for glucose on the Ni(
II)–SB/C electrode in 0.5 M NaOH. By comparing the diffusion coefficient for glucose electrooxidation on our Ni(
II)–SB/C electrode and some reported electrodes, it was found that the diffusion coefficient of the glucose on the Ni(
II)–SB/C electrode is higher than that obtained on graphene/Ni that was 3.16 × 10
−6 cm
2 s
−1.
92 The catalytic rate constant of glucose oxidation reaction on the Ni(
II)–SB/C electrode can be calculated from the slope of the inset plot (right) of
eqn (12b) and
eqn (22) according to Pariente
et al.93| | | Icat/IL = π1/2γ1/2 = π1/2(kC*t)1/2 | (22) |
where,
Icat and
IL are the steady-state oxidation currents of each catalyst in the presence (
Icat) and in the absence (
IL) of glucose,
γ is the argument of the error function,
k° is the heterogeneous catalytic rate constant,
C* is the bulk concentration of glucose and
t is the elapsed time (s). Using the slope of the straight line of the relationship between
Icat/
ILvs. t1/2 (inset plot of
Fig. 12b) and according to
eqn (19), the value of
k° is 1.53 × 10
5 cm
3 mol
−1 s
−1 that supports the quickness and easiness of the glucose oxidation reaction on the Ni(
II)–SB/C electrode surface. This value is less than that reported for GC/Ni (5.4 × 10
5 cm
3 mol
−1 s
−1)
94 and higher than 57.65 M
−1·s
−1 which was reported for NiO.
95
Moreover, the reproducibility of the synthesized Ni(II)–SB/C electrode is investigated by measuring the cyclic voltamograms of five electrodes (independently synthesized) in 0.5 M NaOH in the presence of 0.1 M glucose giving oxidation peak current densities of 89, 90, 91, 91.5, and 92 mA mg−1, and the average oxidation peak current density, standard deviation (SD), and relative standard deviation are 90.7 mA mg−1, 1.204, and 1.33%, respectively. For studying the long term stability of the prepared Ni(II)–SB/C electrode, it is kept at room temperature and checked every 10 days through one month for oxidation of glucose, the response signal retained 96% of the initial value after 10 days and 92% after 30 days. Accordingly, it illustrates that the Ni(II)–SB/C shows favorable stability and good reproducibility for glucose electrooxidation.
For further investigation of the electrooxidation process, the Tafel plot of E vs. logI is constructed from the rising part of the cyclic voltammogram at 0.005 V s−1 in the potential range from 0.36 to 0.62 V as shown in Fig. 13 in a 0.5 M NaOH containing 0.1 M glucose. A Tafel slope of 0.244 V dec−1 is obtained for glucose electrooxidation on Ni(II)–SB/C, which is less than that reported for glucose electrooxidation catalyzed by transition metal Ni ions in solution and GC electrode in alkaline solution (0.285 V dec−1).88 This clarifies that the glucose electrooxidation is enhanced on the Ni(II)–SB/C electrode and the process proceeds via a common rate-determining step on Ni–based electrodes including one electron transfer as suggested in eqn (14).
 |
| | Fig. 13 Tafel line of Ni(II)–SB/C in 0.5 M NaOH + 0.1 M glucose at 5 mV s−1. | |
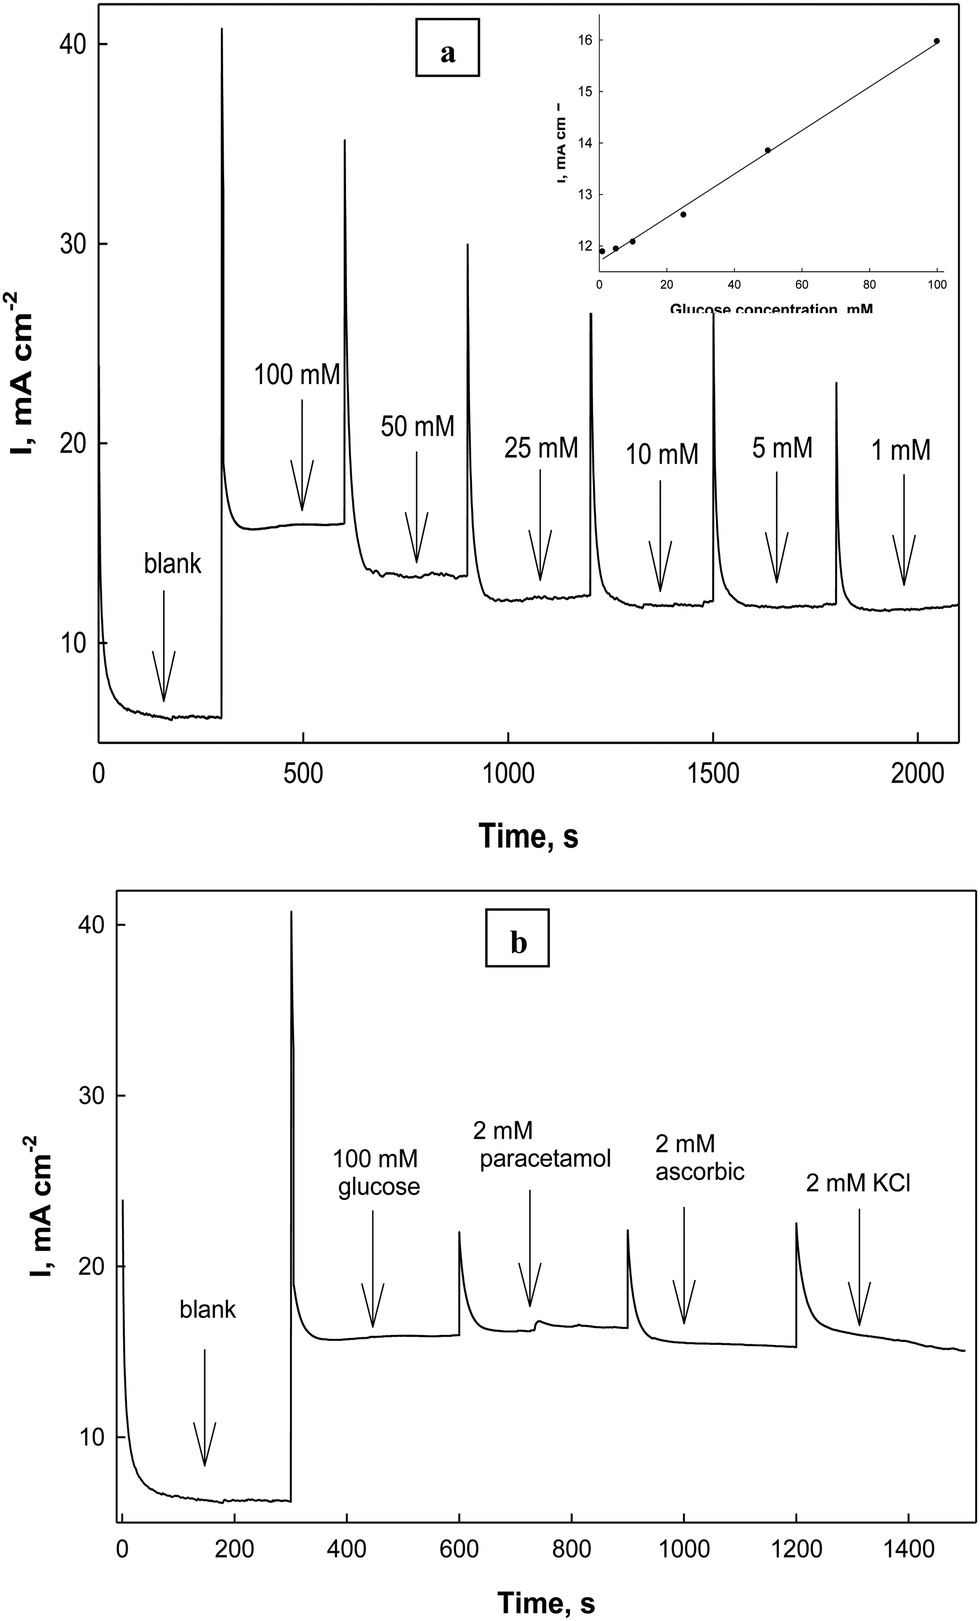
Application of the prepared Ni(II)–SB/C electrode for glucose sensing is carried out through chronoamperometry. An I–t curve is constructed at 0.72 V in 0.5 M NaOH and different glucose concentrations from 1 mM to 100 mM as shown in Fig. 14a. The current density of the experimental I–t curve increases step by step with the successive addition of glucose into the electrolyte. This indicates the rapid-response ability and high sensitivity of Ni(II)–SB/C electrode towards glucose. The inset plot of Fig. 14a represents the data fitting calibration plot between the oxidation current densities and the concentrations of glucose that exhibit a linear range (LDR) from 1 mM to 100 mM glucose with a sensitivity of 42.3 μA cm−2 mM−1 as in the linear eqn (23) at the optimum oxidation potential of 0.72 V and the signal-to-noise ratio is  .
.
| | | Ip (μA cm−2) = 42.3C mM glucose + 11.7 (R2 = 0.996) | (23) |
The limit of detection (LOD) and the limit of quantization (LOQ) are determined from the calibration plot slope (inset of
Fig. 14a). The limit of detection of the Ni(
II)–SB/C electrode is the minimum amount of glucose in a sample that can be detected and it can be estimated from
eqn (24), while, the limit of quantization reflects the lowest glucose concentration that can be detected quantitatively using a stated accuracy and precision (LOQ) that is calculated according to
eqn (25):
96,97where,
s is the standard deviation of the background current obtained without glucose and
m is the slope of the calibration plot (
I–
Cglucose). The LOD is 4 μM and is close to that obtained on the NiSe-NW electrode which is about 5 μm
98 and the LOQ is equal to 12 μM. By comparing the sensitivity of the Ni(
II)–SB/C electrode to that reported in the literature, it is found that its sensitivity is slightly higher than that obtained on Ni powder modified electrode (40 μA cm
−2 mM
−1),
99 NiO electrode which has 24 μA cm
−2 mM
−1 at 0.52 V (SCE),
100 Ni(OH)
2 electrode which has a sensitivity of 12.09 μA cm
−2 mM
−1 at 0.52 V (SCE)
101 or Ni(
II) ions of 10 mM at 0.55 V
vs. SCE and sensitivity is 38.9 μA cm
−2 mM
−1.
88
 |
| | Fig. 14 Chronoamperometry of electroxidation of glucose at 0.72 V in 0.5 M NaOH in the presence of (a) different concentrations of glucose from 1 mM to 100 mM, with the inset calibration plot and (b) different interfering species. | |
It is well known that some biological interfering species such as KCl, ascorbic acid and paracetamol, etc. can interfere with and disturb the detection of glucose in biological fluids. To investigate the selectivity of Ni(II)–SB/C electrode, a solution of 0.5 M NaOH and 100 mM glucose is detected at 0.72 V, then 2 mM of KCl, ascorbic acid and paracetamol are introduced individually into the above electrolyte. As shown in Fig. 14b, the three analytes did not show any observable current signals under the same conditions, which indicates that the glucose sensing current is not affected by these disturbing substances on the Ni(II)–SB/C electrode. Meanwhile, it is worth noting that the healthy physiological concentration of glucose is much higher than that from the interfaces species in the human body,102 which indicates the high selectivity of the Ni(II)–SB/C electrode towards glucose sensing and its possible application in glucose electrochemical sensors.
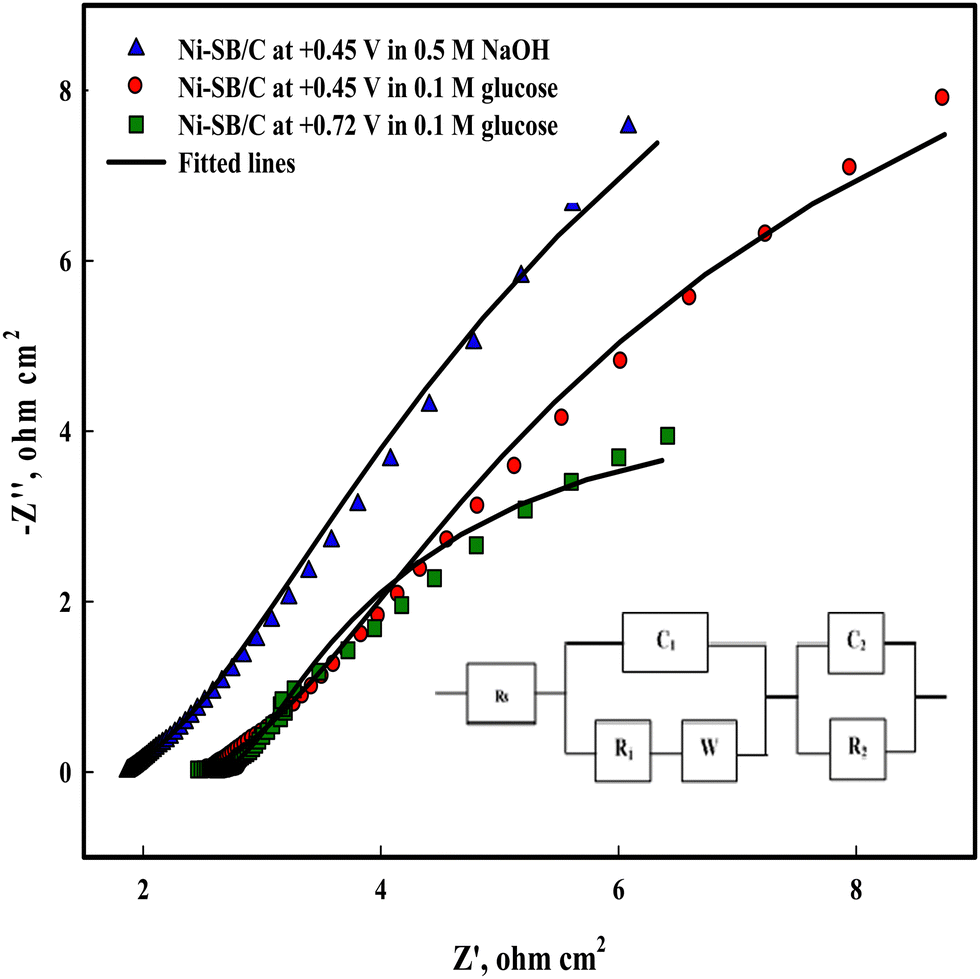
To study the charge transfer process on Ni(II)–SB/C, electrochemical impedance spectroscopy (EIS) is carried out on the Ni(II)–SB/C electrode in 0.5 M NaOH and in the presence of 0.1 M glucose at the potential of +0.45 V that corresponds to the formation of NiOOH and at the oxidation peak potential of glucose at +0.72 V. Fig. 15 shows the Nyquist plot of the Ni(II)–SB/C electrode in both solutions which represents semicircles with different diameters, and a smaller diameter is obtained at +0.72 V. The EIS data is fitted to the equivalent circuit (the inset of Fig. 15), where Rs is attributed to the solution resistance, R1 is the resistance due to the adsorption of glucose or intermediate products of its oxidation on the electrode surface, and R2 is the charge transfer resistance, C1 is the capacitance of the outer layer due to the adsorption process, C2 is the capacitance element of the inner layer of electrode due to the charge transfer process, and W is a Warburg impedance parameter that represents the diffusion of the analyte to the electrode surface. The EIS parameters of the fitted data are presented in Table 5. In the presence of glucose, the semicircle diameter becomes smaller than that in the absence of glucose and the charge transfer resistance of the electrode decreases due to the faradaic process of glucose electrooxidation. A charge transfer value of 4.01 Ω cm2 is recorded for the electrooxdation of glucose on the Ni(II)–SB/C electrode. This clearly indicates that the electron charge transfer is more facile on the Ni(II)–SB/C electrode due to the high dispersion of Ni on its surface and its smaller particle size. In addition, the low resistance and high conductivity of the Schiff-base nanomaterials can promote the electron transfer and the catalytic process on the electrode surface.
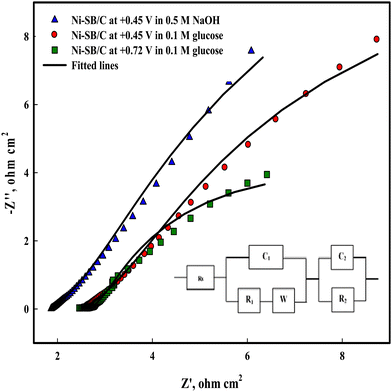 |
| | Fig. 15 Electrochemical impedance spectroscopy of Ni(II)–SB/C in 0.5 M NaOH and in the presence of 0.1 M glucose at +0.45 and 0.72V and the inset represents its equivalent circuit. | |
Table 5 EIS parameters derived from the equivalent circuit for the Ni(II)–SB/C electrode in 0.5 M NaOH and in the presence of 0.1 M glucose
| Item |
R
s (Ω cm2) |
C
1 (F cm−2) |
R
1 (Ω cm2) |
W (Ω cm2) |
R
2 (Ω cm2) |
C
2 (F cm−2) |
Error |
| Ni(II)–SB/C in 0.5 M NaOH at 0.45 V |
1.87 |
2.58 × 10⁻⁴ |
0.033 |
0.002 |
14.59 |
3.21 × 10⁻² |
0.014 |
| Ni(II)–SB/C in 0.1 M glucose at 0.45 V |
2.55 |
3.04 × 10⁻⁴ |
0.102 |
0.001 |
8.27 |
2.98 × 10⁻² |
0.016 |
| Ni(II)–SB/C in 0.1 M glucose at 0.72 V |
2.55 |
9.20 × 10⁻⁵ |
0.144 |
0.003 |
4.01 |
3.90 × 10⁻² |
0.028 |
To investigate the applicability of the prepared Ni(II)–SB/C electrode in real physiological fluid, real samples are collected from our research team and tested using the conventional method to determine the glucose concentration in each sample. A physiological fluid (20 mL) is added to 5 mL of 0.5 M NaOH solution and the voltammetric current response is recorded at +0.72 V and the results of three real samples are represented in Table 6.
Table 6 Voltammetric determination of glucose in real samples of physiological fluid at the Ni(II)–SB/C electrode
| Sample |
Added (mM L−1) |
Concentration found (mM L−1) |
Recovery (%) |
RSD (%) |
| 1 |
3.9 |
3.87 |
99.2 |
0.546 |
| 2 |
5.6 |
5.61 |
100.2 |
0.126 |
| 3 |
6.9 |
6.87 |
99.6 |
0.308 |
3.4. Theoretical study of the adsorption process
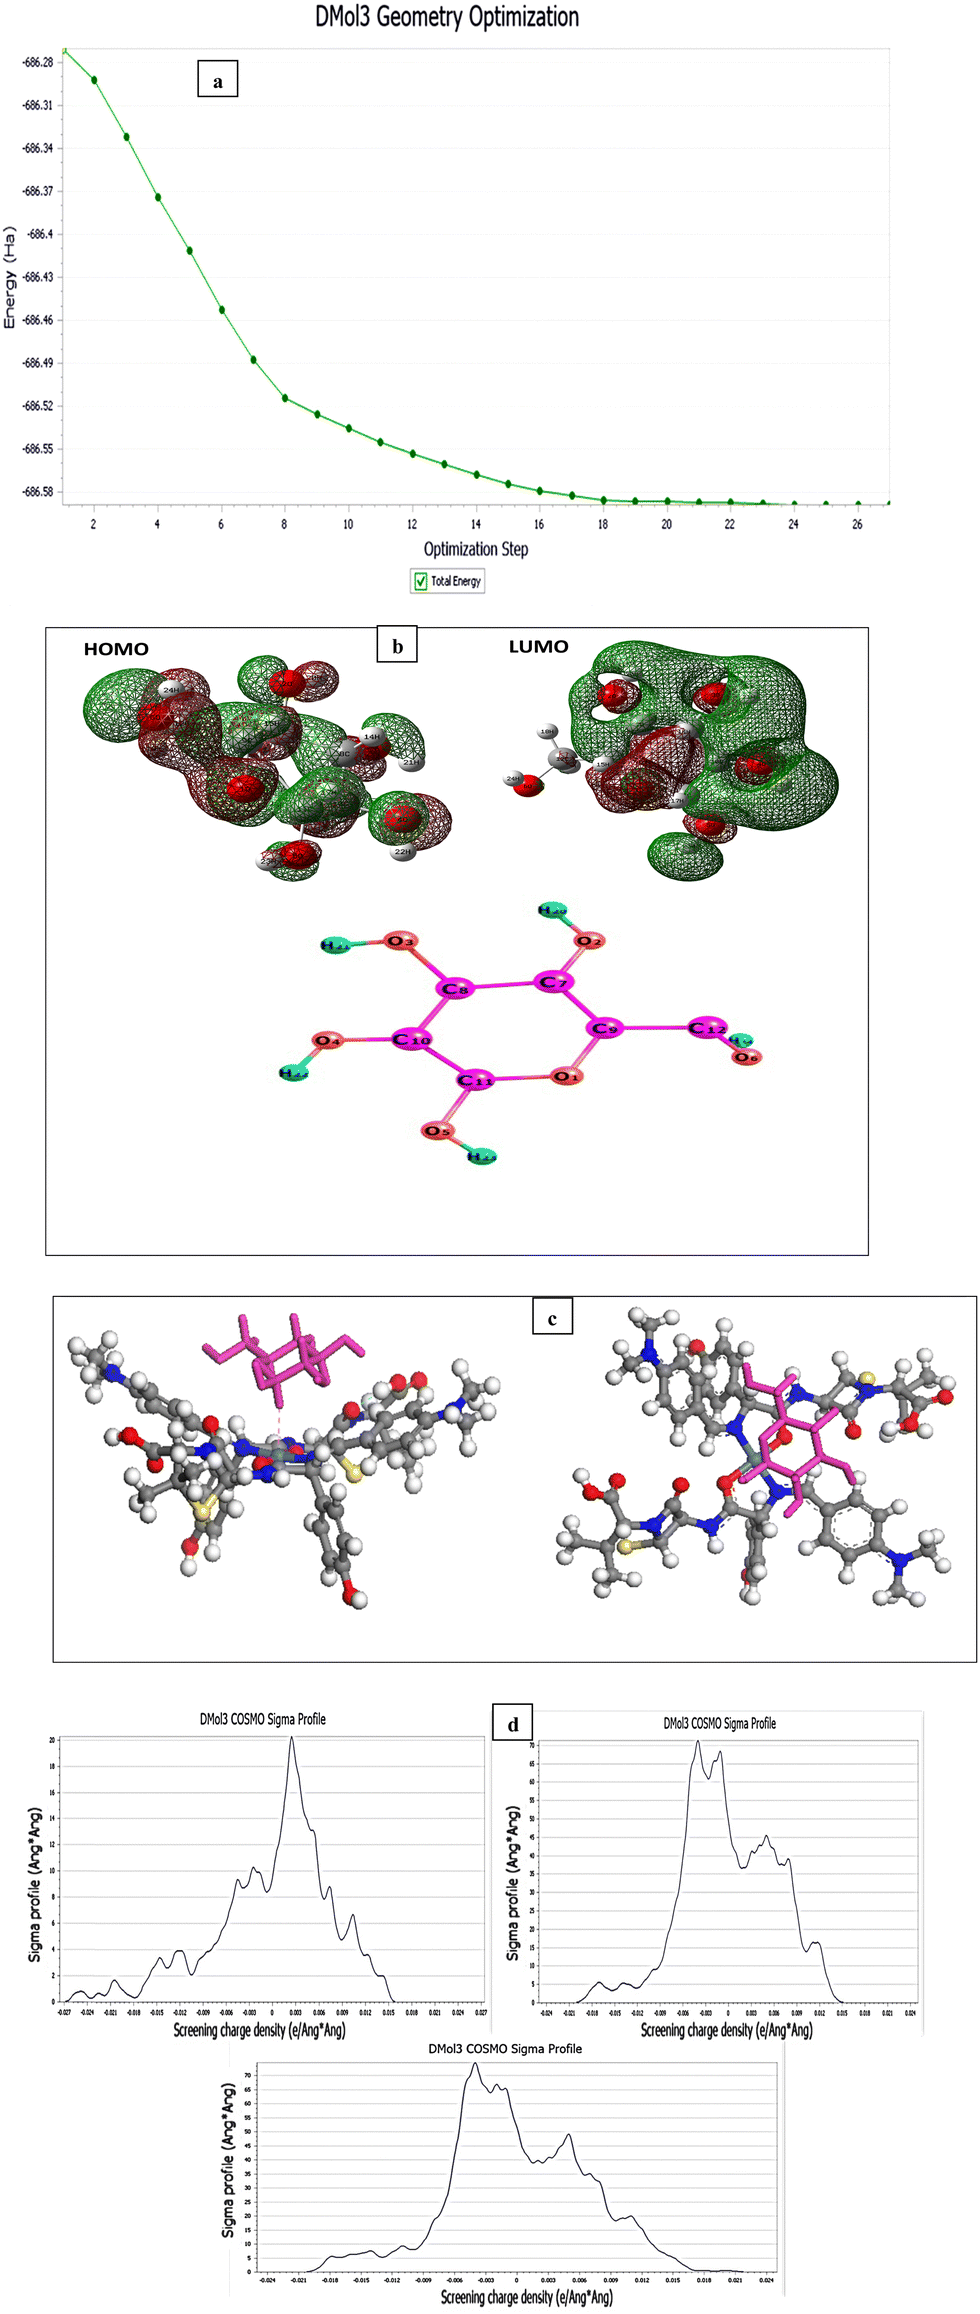
The theoretical method based on DMol3 is used to determine the electron density of frontier molecular orbitals (FMO) in order to determine the main quantum chemical descriptors namely the energy of the highest molecular orbital (EHOMO) and the lowest molecular orbital (ELUMO), the energy gap (E = ELUMO − EHOMO), the number of electrons transferred (ΔN), and the total energy (TE).103–108 This will hopefully shed light on the facility of the interaction between the Ni(II)–SB/C surface and the organic molecule (glucose). The theory of Dmol3 is chosen with the method of BLYP/GGA and DNP as the base set. This is carried out using Material Studio 8.0. The interaction (Einteraction) and binding (Ebinding) energies of Ni chelate–glucose are determined as follows:| | | Einteraction = Etotal − (Esurface,Ni complex + Eglucose) | (26) |
| | | Ebinding = −Einteraction | (27) |
where, Etotal is the total energy of the whole studied system. Fig. 16a shows the optimized structures of the glucose with the minimum energy reflecting the stabilized state of the molecule. It is noticed that the optimization steps number is 26. In general, for an organic molecule, the regions covered by the electronic densities of FMO (HOMO or LUMO) are capable of reacting with the nickel atoms existing on the chelate.109 These regions which have a HOMO electron density are available to share their electrons with the vacant orbitals located on the metal surface, leading to the formation of covalent bonds.110 Indeed, this behavior favors the adsorption of the studied molecule (glucose) on the surface of the substrate and facilitates the charge transfer via its oxidation reaction. In this context, Fig. 16b shows the special electron density distribution of the FMOs of the glucose molecule. It is interesting to note that the electron density of the FMOs is localized on the same part that carries oxygen atoms and heterocycles. This shows that this motif is responsible for the donor–acceptor property and the majority of the active sites are located in this part, while the carbon chain carries no electronic trend. This result allows us to conclude that the part recovered by the electronic density HOMO is possibly adsorbed on the contact surface. Table 7 compiles the main quantum chemical descriptors molecule of the glucose interaction efficiency. The facility of the adsorption mechanism and the high chemical reactivity of the glucose molecule on the Ni-chelate could be due to the large value of the energy difference (ΔEgap) (2.158 eV), the high value of EHOMO (−3.585 eV), and lowest value of ELUMO (−1.427 eV), and the high value of electron number transferred (ΔN) (0.336) according to Lukovit.111 These results show that the glucose adsorbed well on the metal surface by blocking the majority of the active sites existing in the substrate surface, in order to increase the oxidation rate of this metal. The theoretical calculation data obtained are completely supported by the experimental results, confirming the easier oxidation of glucose on the surface of the metal chelate. Local reactivity is assessed by calculating the Fukui indices; these sites make it possible to determine which atoms are responsible for the electrophilic and nucleophilic attacks of each inhibitor molecule.112 The high values of the condensed Fukui functions Kf+ and Kf− represent the electron acceptor and donor sites, respectively. Often the most relevant sites are located in the HOMO (Kf−) and LUMO (Kf+) electron density distribution.113 Indeed, Table 8 regroups all the values of the Fukui indices. According to this table the C(7), C(8), C(10) and C(12) atoms of two compounds glucose have the high value of Kf+, which means that these sites are available to receive electrons from the electron donor group. These two atoms are located in the active part of the molecule which carries electron density distributed over its skeleton. While, the O(1), O(2) and O(6) atoms of the studied compounds are responsible for the electrophilic attack, permitting the sharing of their electrons with the empty orbitals of the nickel atoms through the formation of the stronger bonds. Oxygen atoms belonging to the active part of the glucose are possibly responsible for the adsorption and facilitates the oxidation process. The active sites located in the carbon chain have very low values of Kf+ and Kf− condensed functions, which shows that this chain is unable to adsorb on the substrate surface. Fig. 16c shows images of two different views of the adsorption configuration of glucose on the nickel chelate surface. From this figure, it is found that glucose adsorbs through the active function which carries heterocyclic, while the carbon chain of two compounds is oriented upwards. The values of energy potentials such as interaction and binding energy of the systems studied are −34105.4 and 34105.4, respectively. It is noticed that the negative value of the interaction energy clarifies the spontaneity of the adsorption process.114 In addition, the positive values of the adsorption energy reflect the strong adsorption of glucose on the nickel chelate surface.115 These simulation results confirm the oxidation of efficacy that is observed experimentally. The close contact distance with a length 2.316 Å, resulted in glucose adsorbing better on the metal surface by forming a more efficient binding layer. Fig. 16d clarifies the COSMO profiles.
 |
| | Fig. 16 (a) Optimized structures of the glucose, (b) topographic distributions of the electron density of the FMO orbitals of glucose neutral molecule, (c) adsorption configurations of glucose on Ni(II)–SB chelate surface at 298K, and (d) COSMO of glucose, Ni-chelate and complex, respectively. | |
Table 7 Quantum chemical descriptor distributions of the glucose-neutral molecule
| Molecule |
E
HOMO, (eV) |
E
LUMO, (eV) |
ΔE, (eV) |
ΔN |
| Glucose |
−3.585 |
−1.427 |
2.158 |
2.32 |
Table 8 Condensed Fukui functions on C and O atoms of the glucose using GGA/BLYP/DNP
| Atoms |
Kf+ |
Kf− |
| O1 |
0.065 |
0.073 |
| O2 |
0.062 |
0.053 |
| O3 |
0.059 |
0.049 |
| O4 |
0.039 |
0.044 |
| O5 |
0.003 |
-0.001 |
| O6 |
0.051 |
0.087 |
| C7 |
0.102 |
0.07 |
| C8 |
0.098 |
0.073 |
| C9 |
0.05 |
0.048 |
| C10 |
0.069 |
0.064 |
| C11 |
0.122 |
0.084 |
| C12 |
0.094 |
0.144 |
4. Conclusion
A novel Schiff-base complex of a nickel catalyst is fabricated and it is ink-casted on a commercial carbon electrode for glucose electrooxidation. It shows appreciable catalytic activity, stability, reproducibility and anti-poisoning ability. The relationship between the Ip/v1/2 function and scan rates indicates that glucose reaction is a catalytic process, and demonstrates the catalytic role of Ni(III). A facile electron transfer on the Ni(II)–SB/C electrode is due to the high distribution of Ni on its surface and its smaller particle size. Ni(II)–SB/C has a relatively large electrochemically active surface area (ECSA) of 15.6 cm2 mg−1 and a surface coverage value of 4.4 × 10⁻⁷ mol cm−2. A diffusion coefficient value of 1.34 × 10⁻⁵ cm2 s−1 is estimated for glucose on the electrode surface. A relatively high value of heterogeneous rate constant for glucose electrooxidation on Ni(II)–SB/C is 1.53 × 105 cm3 mol−1 s−1. A good sensitivity of Ni(II)–SB/C that is 453 μA cm−2 mM−1 from cyclic voltammetry and from chronoamperometry is 42.3 μA cm−2 mM−1 in the linear range from 1.0 mM to 100 mM with a detection limit of 4 μM. In addition, the low resistance and high conductivity of the Schiff-base nanomaterials can promote the electron transfer and the catalytic process on the Ni(II)–SB/C electrode surface. Density function theory (DFT) demonstrates the equilibrium geometry, molecular orbital and ground state properties of Ni(II)–SB. The theoretical adsorption study indicates that a glucose molecule can be adsorbed better on the Ni moiety by forming a more efficient binding layer. Therefore, Ni(II)–SB/C could be considered as a potential candidate anode catalyst for direct glucose fuel cells and glucose sensors.
Conflicts of interest
The authors declare that there is no conflicts of interest.
References
- S. Kerzenmacher, J. Ducrée, R. Zengerle and F. Von Stetten, J. Power Sources, 2008, 182, 1–17 CrossRef CAS.
- A. Heller and B. Feldman, Chem. Rev., 2008, 108, 2482–2505 CrossRef CAS PubMed.
- N. German, A. Ramanaviciene and A. Ramanavicius, Polymers, 2021, 13, 2173 CrossRef CAS PubMed.
- A. Khoobi and M. Salavati-Niasari, Energy, 2019, 178, 50–56 CrossRef CAS.
- Y. Chen, K. P. Prasad, X. Wang, H. Pang, R. Yan, A. Than, M. B. Chan-Park and P. Chen, Phys. Chem. Chem. Phys., 2013, 15, 9170–9176 RSC.
- M. Irfan, I. U. Khan, J. Wang, Y. Li and X. Liu, RSC Adv., 2020, 10, 6444–6451 RSC.
- H.-W. Lei, B. Wu, C.-S. Cha and H. Kita, J. Electroanal. Chem., 1995, 382, 103–110 CrossRef.
- G. Milazzo, Bioelectrochemistry I Biol. Redox React., 1983, 5–14 CAS.
- K. B. Kokoh, J.-M. Léger, B. Beden and C. Lamy, Electrochim. Acta, 1992, 37, 1333–1342 CrossRef CAS.
- U. Gebhardt, J. R. Rao and G. J. Richter, J. Appl. Electrochem., 1976, 6, 127–134 CrossRef CAS.
- K. B. Kokoh, J.-M. Léger, B. Beden, H. Huser and C. Lamy, Electrochim. Acta, 1992, 37, 1909–1918 CrossRef CAS.
- E. Sairanen, M. C. Figueiredo, R. Karinen, A. Santasalo-Aarnio, H. Jiang, J. Sainio, T. Kallio and J. Lehtonen, Appl. Catal., B, 2014, 148, 11–21 CrossRef.
- C.-C. Chen, C.-L. Lin and L.-C. Chen, Electrochim. Acta, 2015, 152, 408–416 CrossRef CAS.
- Q. Shi, G. Diao and S. Mu, Electrochim. Acta, 2014, 133, 335–346 CrossRef CAS.
- D. Basu, S. Sood and S. Basu, Chem. Eng. J., 2013, 228, 867–870 CrossRef CAS.
- A. Habrioux, E. Sibert, K. Servat, W. Vogel, K. B. Kokoh and N. Alonso-Vante, J. Phys. Chem. B, 2007, 111, 10329–10333 CrossRef CAS PubMed.
- L. Yan, A. Brouzgou, Y. Meng, M. Xiao, P. Tsiakaras and S. Song, Appl. Catal., B, 2014, 150, 268–274 CrossRef.
- M. F. L. De Mele, H. A. Videla and A. J. Arvia, J. Electrochem. Soc., 1982, 129, 2207 CrossRef CAS.
- T. P. Tougas, M. J. Debenedetto and J. M. Demott Jr, Electroanalysis, 1993, 5, 669–675 CrossRef CAS.
- R. R. Adzic, M. W. Hsiao and E. B. Yeager, J. Electroanal. Chem. Interfacial Electrochem., 1989, 260, 475–485 CrossRef CAS.
- A. Stitz and W. Buchberger, Electroanalysis, 1994, 6, 251–258 CrossRef CAS.
- A. Stitz and W. Buchberger, Fresenius’ J. Anal. Chem., 1991, 339, 55–57 CrossRef CAS.
- Y. B. Vassilyev, O. A. Khazova and N. N. Nikolaeva, J. Electroanal. Chem. Interfacial Electrochem., 1985, 196, 127–144 CrossRef.
-
R. M. A. Hameed, M. A. Sultan, M. W. Khalil and M. A. AbdelRahim, ELECTROCHEMISTRY (Basic Science and Key Technology for Future Applications), JOHANNES GUTENBERG – UNIVERSITÄT MAINZ, Germany, 2014, p. 319 Search PubMed.
- S. Berchmans, H. Gomathi and G. P. Rao, Sens. Actuators, B, 1998, 50, 156–163 CrossRef CAS.
- M. Vidotti, C. D. Cerri, R. F. Carvalhal, J. C. Dias, R. K. Mendes, S. I. C. de Torresi and L. T. Kubota, J. Electroanal. Chem., 2009, 636, 18–23 CrossRef CAS.
- S. Berchmans, H. Gomathi and G. P. Rao, J. Electroanal. Chem., 1995, 394, 267–270 CrossRef.
- M. A. Kiani, M. A. Tehrani and H. Sayahi, Anal. Chim. Acta, 2014, 839, 26–33 CrossRef CAS PubMed.
- J. Nai, S. Wang, Y. Bai and L. Guo, Small, 2013, 9, 3147–3152 CrossRef CAS PubMed.
- M. Yao, Z. Hu, Z. Xu, Y. Liu, P. Liu and Q. Zhang, J. Power Sources, 2015, 273, 914–922 CrossRef CAS.
- M. A. Sultan, H. B. Hassan and R. H. Tammam, J. Appl. Electrochem., 2023, 53, 463–486 CrossRef CAS.
- M. Revenga-Parra, T. García, E. Lorenzo and F. Pariente, Sens. Actuators, B, 2008, 130, 730–738 CrossRef CAS.
- A. N. Golikand, S. Shahrokhian, M. Asgari, M. G. Maragheh, L. Irannejad and A. Khanchi, J. Power Sources, 2005, 144, 21–27 CrossRef CAS.
- A. Ciszewski and G. Milczarek, J. Electroanal. Chem., 1996, 413, 137–142 CrossRef.
- R. E. Reim and R. M. Van Effen, Anal. Chem., 1986, 58, 3203–3207 CrossRef CAS.
- G. A. El-Nagar, I. Derr, A. Fetyan and C. Roth, Appl. Catal., B, 2017, 204, 185–199 CrossRef CAS.
- C. Zhao, C. Shao, M. Li and K. Jiao, Talanta, 2007, 71, 1769–1773 CrossRef CAS PubMed.
- A. M. Abu-Dief and I. M. A. Mohamed, Beni-suef Univ. J. basic Appl. Sci., 2015, 4, 119–133 Search PubMed.
- I. H. R. Tomi, A. H. Abdullah, A. H. R. Al-Daraji and S. A. R. Abbass, Eur. J. Chem., 2013, 4, 153–156 CrossRef CAS.
- N. Naz and M. Z. Iqbal, J. Chem. Soc. Pakistan., 2009, 31(3), 440–446 CAS.
- K. C. Gupta and A. K. Sutar, Coord. Chem. Rev., 2008, 252, 1420–1450 CrossRef CAS.
- M. A. Hefnawy, S. S. Medany, S. A. Fadlallah, R. M. El-Sherif and S. S. Hassan, Electrocatalysis, 2022, 13, 598–610 CrossRef CAS.
- T. Y. Tekbaşoğlu, T. Soganci, M. Ak, A. Koca and M. K. Şener, Biosens. Bioelectron., 2017, 87, 81–88 CrossRef PubMed.
- L. Lamiri, O. Belgherbi, C. Dehchar, S. Laidoudi, A. Tounsi, B. Nessark, F. Habelhames, A. Hamam and B. Gourari, Synth. Met., 2020, 266, 116437 CrossRef CAS.
- W. Belbacha, F. Naamoune, H. Bezzi, N. Hellal, L. Zerroual, K. Abdelkarim, M. F. Garcia and D. López, Arab. J. Chem., 2020, 13, 6072–6083 CrossRef CAS.
- A. Bezza, Y. Ouennoughi, B. Bouzerafa, D. Aggoun, H. Bezzi, D. López, M. Fernández-García and A. Ourari, Res.
Chem. Intermed., 2018, 44, 6831–6846 CrossRef CAS.
- A. Ourari, H. Nora, C. Noureddine and A. Djouhra, Electrochim. Acta, 2015, 170, 311–320 CrossRef CAS.
- M. Revenga-Parra, S. N. Robledo, E. Martínez-Periñán, M. M. González-Quirós, A. Colina, A. Heras, F. Pariente and E. Lorenzo, Sens. Actuators, B, 2020, 312, 127848 CrossRef CAS.
- D. M. González, L. A. Hernández, J. Oyarce, A. Alfaro, N. Novoa, J. Cisterna, I. Brito, D. Carrillo and C. Manzur, Synth. Met., 2021, 271, 116633 CrossRef.
-
M. J. Frisch, https://http//www.gaussian.com/.
- S. S. Hassan and P. A. Khalf-Alla, Appl. Organomet. Chem., 2020, 34, e5432 CrossRef CAS.
-
C. N. R. Rao and O. S. U. C. D. O. F. PHYSICS, Infrared Spectroscopy, Academic Press, New York, 1963 Search PubMed.
- A. D. Khalaji, J. Clust. Sci., 2013, 24, 209–215 CrossRef CAS.
- S. S. Hassan, D. H. Hanna and S. S. Medany, Appl. Organomet. Chem., 2023, 37, e7026 CrossRef CAS.
- S. P. Roe, J. O. Hill and R. J. Magee, Monatshefte für Chemie/Chemical Mon., 1991, 122, 467–478 CrossRef CAS.
- M. E. Farago, J. M. James and V. C. G. Trew, J. Chem. Soc. A, 1967, 820–824 RSC.
- M. Vuković, J. Appl. Electrochem., 1994, 24, 878–882 CrossRef.
- M. A. A. Rahim, R. M. A. Hameed and M. W. Khalil, J. Power Sources, 2004, 134, 160–169 CrossRef.
- L. Zheng, J. Zhang and J. Song, Electrochim. Acta, 2009, 54, 4559–4565 CrossRef CAS.
- M. Yousef Elahi, H. Heli, S. Z. Bathaie and M. F. Mousavi, J. Solid State Electrochem., 2007, 11, 273–282 CrossRef CAS.
- M. C. Oliveira and A. M. B. do Rego, J. Alloys Compd., 2006, 425, 64–68 CrossRef CAS.
- I. G. Casella, M. R. Guascito and M. G. Sannazzaro, J. Electroanal. Chem., 1999, 462, 202–210 CrossRef CAS.
- L. M. Moroney, R. S. C. Smart and M. W. Roberts, J. Chem. Soc., Faraday Trans., 1, 1983, 79, 1769–1778 RSC.
- M. A. A. Rahim, H. B. Hassan and R. M. A. Hamid, J. Power Sources, 2006, 154, 59–65 CrossRef.
- M. Fleischmann, K. Korinek and D. Pletcher, J. Chem. Soc., Perkin Trans. 2, 1972, 1396–1403 RSC.
- D. E. Pissinis, L. E. Sereno and J. M. Marioli, J. Electroanal. Chem., 2013, 694, 23–29 CrossRef CAS.
- A. Abdel Aal, H. B. Hassan and M. A. Abdel Rahim, J. Electroanal. Chem., 2008, 619–620, 17–25 CrossRef CAS.
- R. Elakkiya, S. Mathankumar and G. Maduraiveeran, Mater. Chem. Phys., 2021, 269, 124770 CrossRef CAS.
- M. Shamsipur, M. Najafi and M.-R. M. Hosseini, Bioelectrochemistry, 2010, 77, 120–124 CrossRef CAS PubMed.
- M. Cao, H. Cao, W. Meng, Q. Wang, Y. Bi, X. Liang, H. Yang, L. Zhang, M.-F. Lang and J. Sun, Int. J. Hydrogen Energy, 2021, 46, 28527–28536 CrossRef CAS.
- N. Zahmouli, S. Marini, M. Guediri, N. Ben Mansour, M. Hjiri, L. El Mir, C. Espro, G. Neri and S. G. Leonardi, Chemosensors, 2018, 6, 54 CrossRef CAS.
- X. Gao, W. Feng, Y. Xu, Y. Jiang, C. Huang, Y. Yi, A. Guo, X. Qiu and W. Chen, Nanoscale Res. Lett., 2020, 15, 1–9 CrossRef PubMed.
- L. Shabnam, S. N. Faisal, A. K. Roy and V. G. Gomes, ChemElectroChem, 2018, 5, 3799–3808 CrossRef CAS.
- C. Heyser, R. Schrebler and P. Grez, J. Electroanal. Chem., 2019, 832, 189–195 CrossRef CAS.
- G. H. El-Nowihy and M. S. El-Deab, J. Electroanal. Chem., 2022, 925, 116917 CrossRef CAS.
- S. M. A. Shibli and V. S. Dilimon, Int. J. Hydrogen Energy, 2007, 32, 1694–1700 CrossRef CAS.
- D. Yang, L. Yang, L. Zhong, X. Yu and L. Feng, Electrochim. Acta, 2019, 295, 524–531 CrossRef CAS.
- S. Wang, X. Yang, Z. Liu, D. Yang and L. Feng, Nanoscale, 2020, 12, 10827–10833 RSC.
- L. Wang, M. Li, Z. Huang, Y. Li, S. Qi, C. Yi and B. Yang, J. Power Sources, 2014, 264, 282–289 CrossRef CAS.
- P. Basumatary, D. Konwar and Y. S. Yoon, Electrochim. Acta, 2018, 261, 78–85 CrossRef CAS.
- K. Ye, H. Zhang, L. Zhao, X. Huang, K. Cheng, G. Wang and D. Cao, New J. Chem., 2016, 40, 8673–8680 RSC.
- K. Ye, D. Zhang, F. Guo, K. Cheng, G. Wang and D. Cao, J. Power Sources, 2015, 283, 408–415 CrossRef CAS.
-
A. J. Bard and L. R. Faulkner, Electrochemical Methods: Fundamentals and Applications, John Wiley & Sons, New York, 2nd edn, 2001 Search PubMed.
- H. B. Hassan and Z. A. Hamid, Int. J. Hydrogen Energy, 2011, 36, 5117–5127 CrossRef CAS.
- E. Laviron, J. Electroanal. Chem., 1979, 101, 19–28 CrossRef CAS.
-
D. Arvia and A. J. Posadas, Nickel, palladium, and platinum. I. Nickel. In Standard Potentials in Aqueous Solution, ed. A. J. Bard, CRC Press, Boca Raton, FL, USA, 1985, pp. 24–29 Search PubMed.
- J. A. Harrison and Z. A. Khan, J. Electroanal. Chem. Interfacial Electrochem., 1970, 28, 131–138 CrossRef CAS.
- W. Zheng, Y. Li and L. Y. S. Lee, Electrochim. Acta, 2019, 308, 9–19 CrossRef CAS.
- I. T. Bae, E. Yeager, X. Xing and C. C. Liu, J. Electroanal. Chem. Interfacial Electrochem., 1991, 309, 131–145 CrossRef CAS.
- I. T. Bae, X. Xing, C. C. Liu and E. Yeager, J. Electroanal. Chem. Interfacial Electrochem., 1990, 284, 335–349 CrossRef CAS.
- I. Danaee, M. Jafarian, F. Forouzandeh, F. Gobal and M. G. Mahjani, Electrochim. Acta, 2008, 53, 6602–6609 CrossRef CAS.
- A. Eshghi, Int. J. Hydrogen Energy, 2017, 42, 15064–15072 CrossRef CAS.
- F. Pariente, E. Lorenzo, F. Tobalina and H. D. Abruña, Anal. Chem., 1995, 67, 3936–3944 CrossRef CAS.
- I. Danaee, M. Jafarian, F. Forouzandeh and F. Gobal, Int. J. Chem. Kinet., 2012, 44, 712–721 CrossRef CAS.
- S. Vaidyanathan, J.-Y. Cherng, A.-C. Sun and C.-Y. Chen, Int. J. Mol. Sci., 2016, 17, 1104 CrossRef PubMed.
- A. Shrivastava and V. B. Gupta, Chron. Young Sci, 2011, 2, 21–25 CrossRef.
- S. S. Badawy, Y. M. Ahmed and M. A. Sultan, Microchem. J., 2023, 108799 CrossRef CAS.
- S. Kukunuri, M. R. Krishnan and S. Sampath, Phys. Chem. Chem. Phys., 2015, 17, 23448–23459 RSC.
- T. You, O. Niwa, Z. Chen, K. Hayashi, M. Tomita and S. Hirono, Anal. Chem., 2003, 75, 5191–5196 CrossRef CAS PubMed.
-
E. Barsoukov and J. R. Macdonald, Impedance spectroscopy: theory, experiment, and applications, John Wiley & Sons, 2018 Search PubMed.
- N. Pal, S. Banerjee and A. Bhaumik, J. Colloid Interface Sci., 2018, 516, 121–127 CrossRef CAS PubMed.
- M. Liu, R. Liu and W. Chen, Biosens. Bioelectron., 2013, 45, 206–212 CrossRef CAS PubMed.
- M. Khattabi, F. Benhiba, S. Tabti, A. Djedouani, A. El Assyry, R. Touzani, I. Warad, H. Oudda and A. Zarrouk, J. Mol. Struct., 2019, 1196, 231–244 CrossRef CAS.
- H. Tanak, A. Ağar and M. Yavuz, J. Mol. Model., 2010, 16, 577–587 CrossRef CAS PubMed.
- V. S. Sastri and J. R. Perumareddi, Corros. Sci., 1997, 53, 617–622 CrossRef CAS.
- A. Koulou, F. Benhiba, M. Rbaa, N. Errahmany, Y. Lakhrissi, R. Touir, B. Lakhrissi, A. Zarrouk and M. S. Elyoubi, Moroccan J. Chem, 2020, 8, 1–8 Search PubMed.
- A. Chami Khazraji and S. Robert, J. Nanomater., 2013, 2013, 1–12 Search PubMed.
- K. Wang, S. He, B. Zhang, Z. Cao, T. Zhou, J. He and G. Chu, Molecules, 2023, 28, 5834 CrossRef CAS PubMed.
- H. Serrar, M. Galai, F. Benhiba, M. Ouakki, Z. Benzekri, S. Boukhris, A. Hassikou, A. Souizi, H. Oudda and M. E. Touhami, J. Chem. Technol. Metall, 2018, 53, 597–605 CAS.
- L. Y. Reznik, L. Sathler, M. J. B. Cardoso and M. G. Albuquerque, Mater. Corros., 2008, 59, 685–690 CrossRef CAS.
- I. Lukovits, E. Kalman and F. Zucchi, Corrosion, 2001, 57, 3–8 CrossRef CAS.
- T. Laabaissi, F. Benhiba, Z. Rouifi, M. Rbaa, H. Oudda, H. Zarrok, B. Lakhrissi, A. Guenbour, I. Warad and A. Zarrouk, Prot. Met. Phys. Chem. Surfaces, 2019, 55, 986–1000 CrossRef CAS.
- K. Cherrak, F. Benhiba, N. K. Sebbar, E. M. Essassi, M. Taleb, A. Zarrouk and A. Dafali, Chem. Data Collect., 2019, 22, 100252 CrossRef CAS.
- S. K. Saha, P. Ghosh, A. Hens, N. C. Murmu and P. Banerjee, Phys. E, 2015, 66, 332–341 CrossRef CAS.
- M. El Faydy, F. Benhiba, B. Lakhrissi, M. E. Touhami, I. Warad, F. Bentiss and A. Zarrouk, J. Mol. Liq., 2019, 295, 111629 CrossRef CAS.
|
| This journal is © The Royal Society of Chemistry 2024 |

 Open Access Article
 This Open Access Article is licensed under a Creative Commons Attribution-Non Commercial 3.0 Unported Licence
 *a,
Safaa S.
Hassan
a,
K. A.
Omran
b and
H. B.
Hassan
a
*a,
Safaa S.
Hassan
a,
K. A.
Omran
b and
H. B.
Hassan
a
 . A low charge transfer resistance value of 4.01 Ω cm2 is achieved for glucose electrooxidation on the Ni(II)–SB/C electrode which confirms the fast electron transfer reaction compared with that in 0.5 M NaOH. The optimized geometry, molecular orbital and ground state properties of the SB and Ni(II)–SB catalyst were studied using Density Functional Theory (DFT). The spontaneity of the glucose adsorption on the Ni(II)–SB/C electrode surface is predicted from the values of Einteraction (−34105.4 eV) and Ebinding (34105.4 eV).
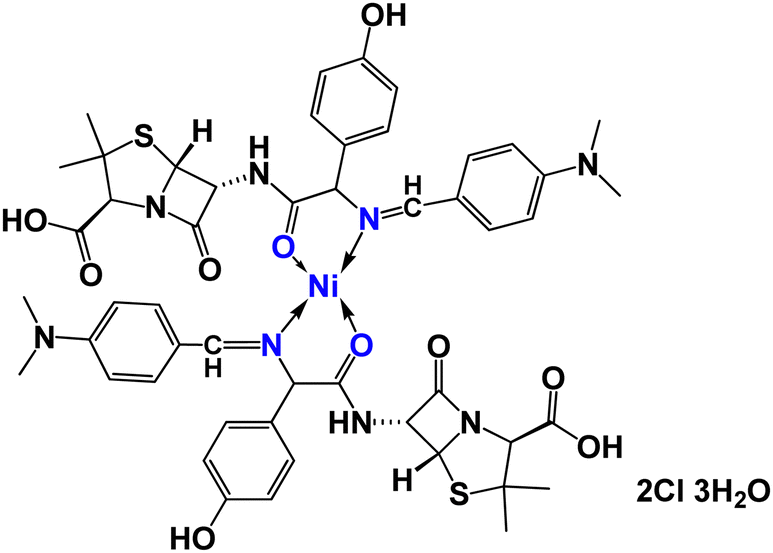
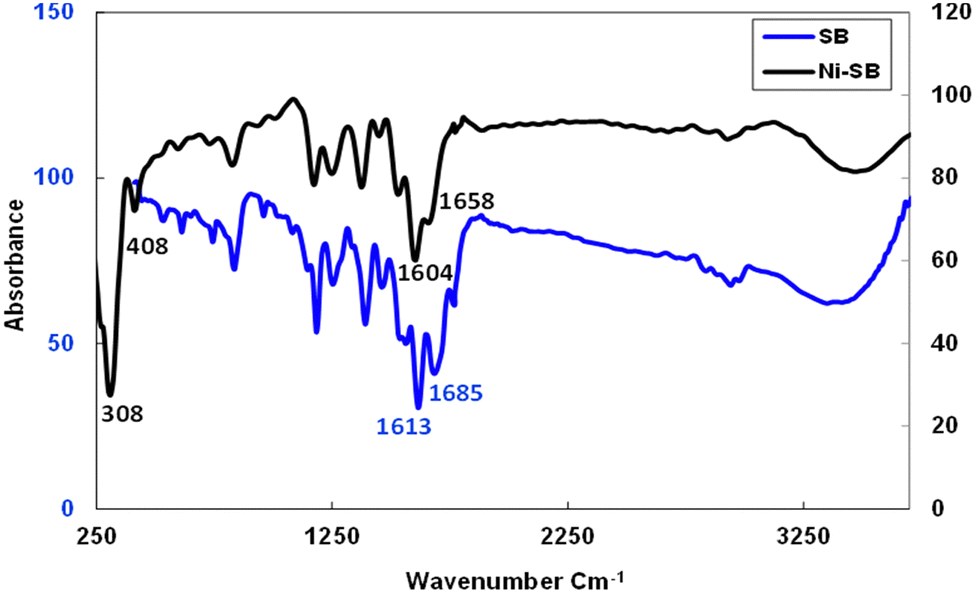
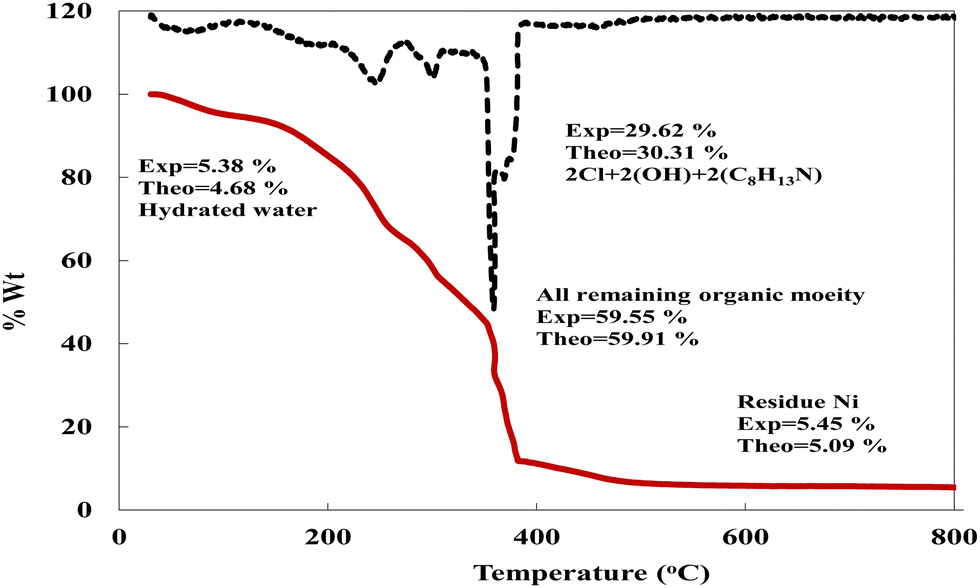
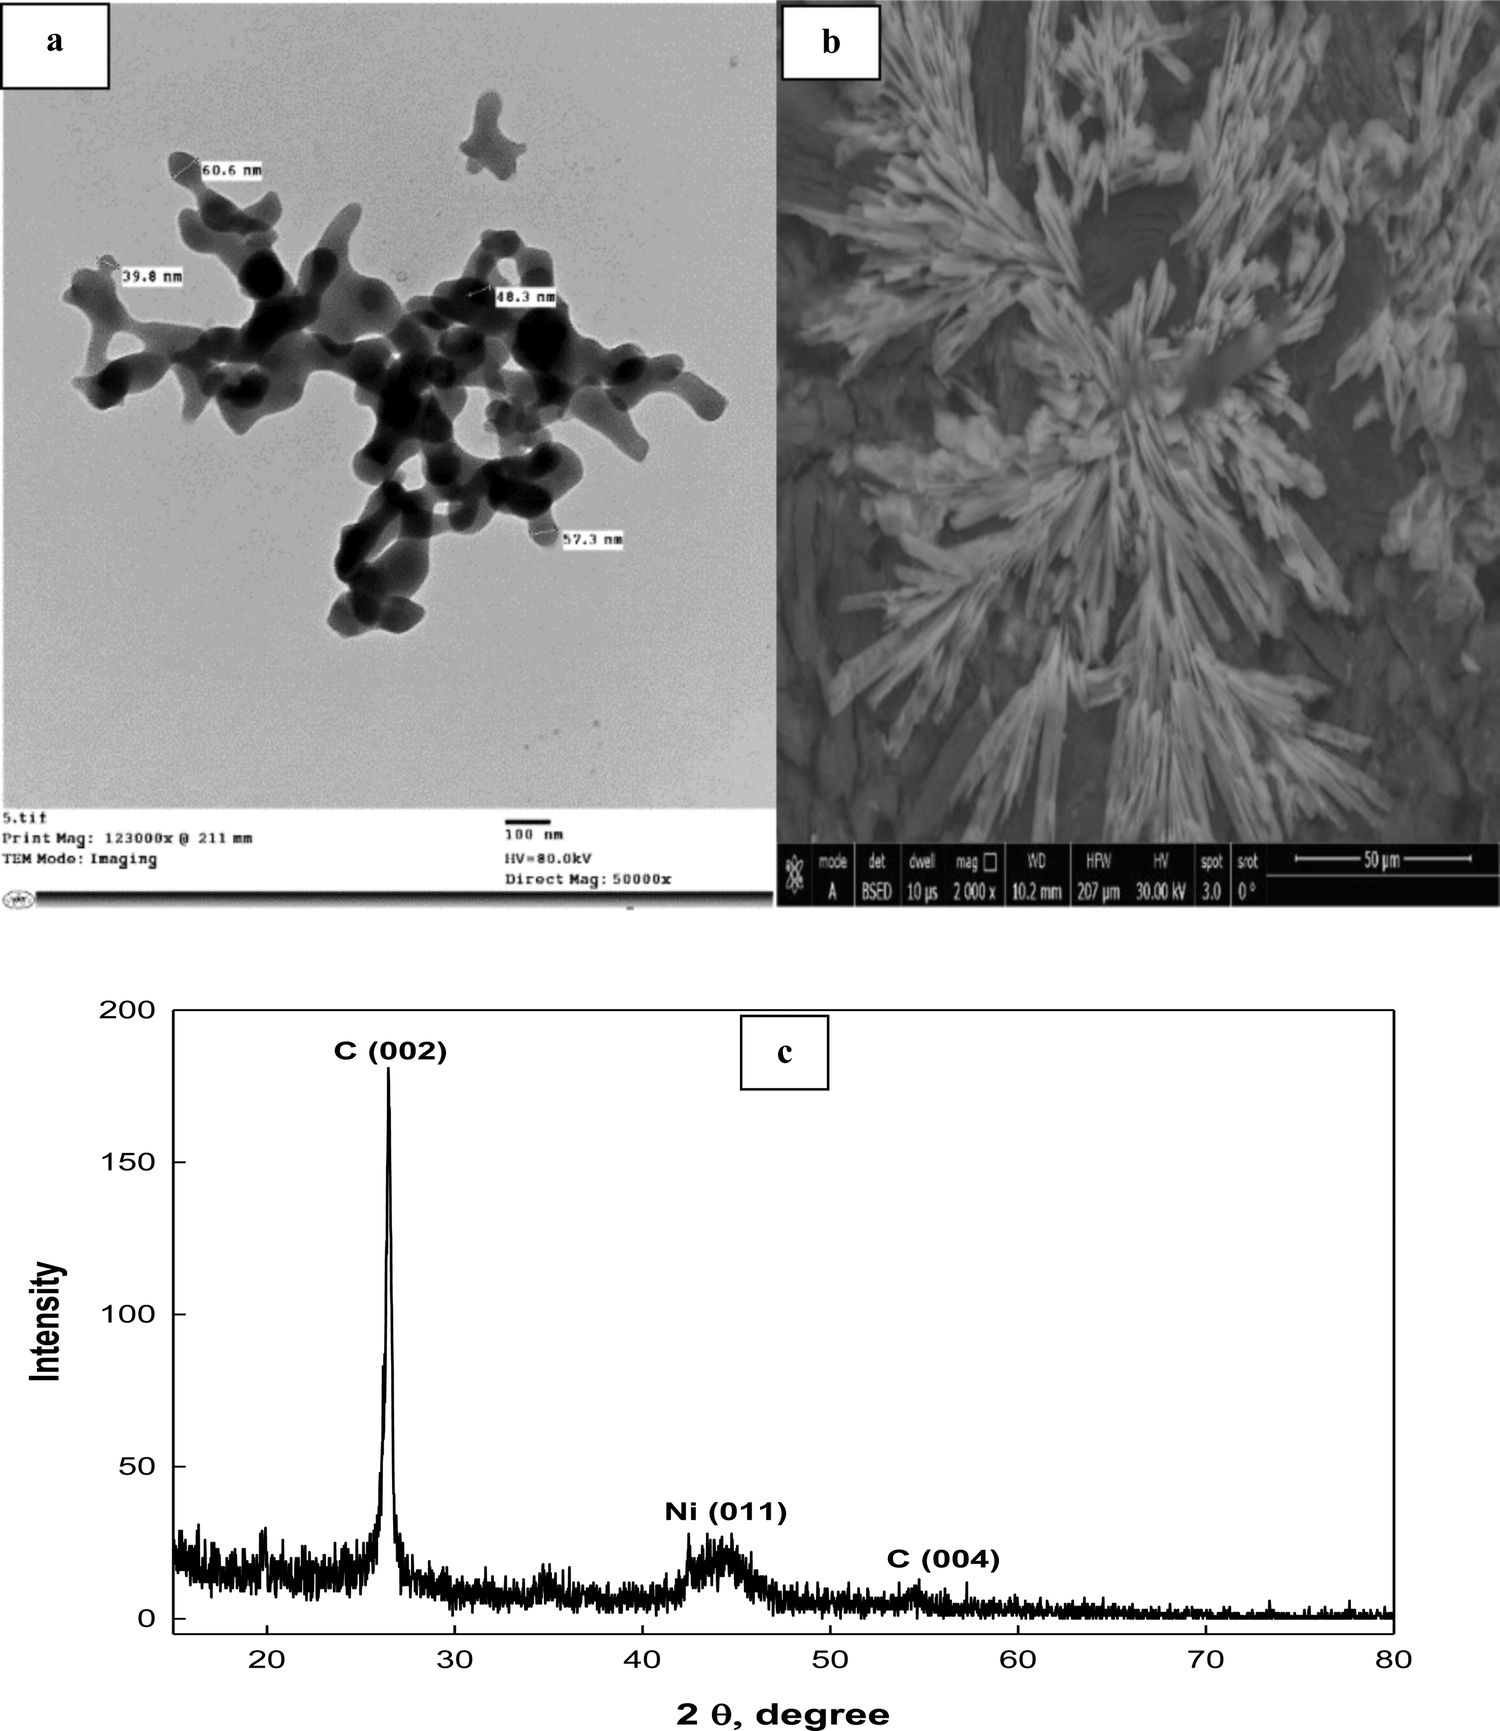
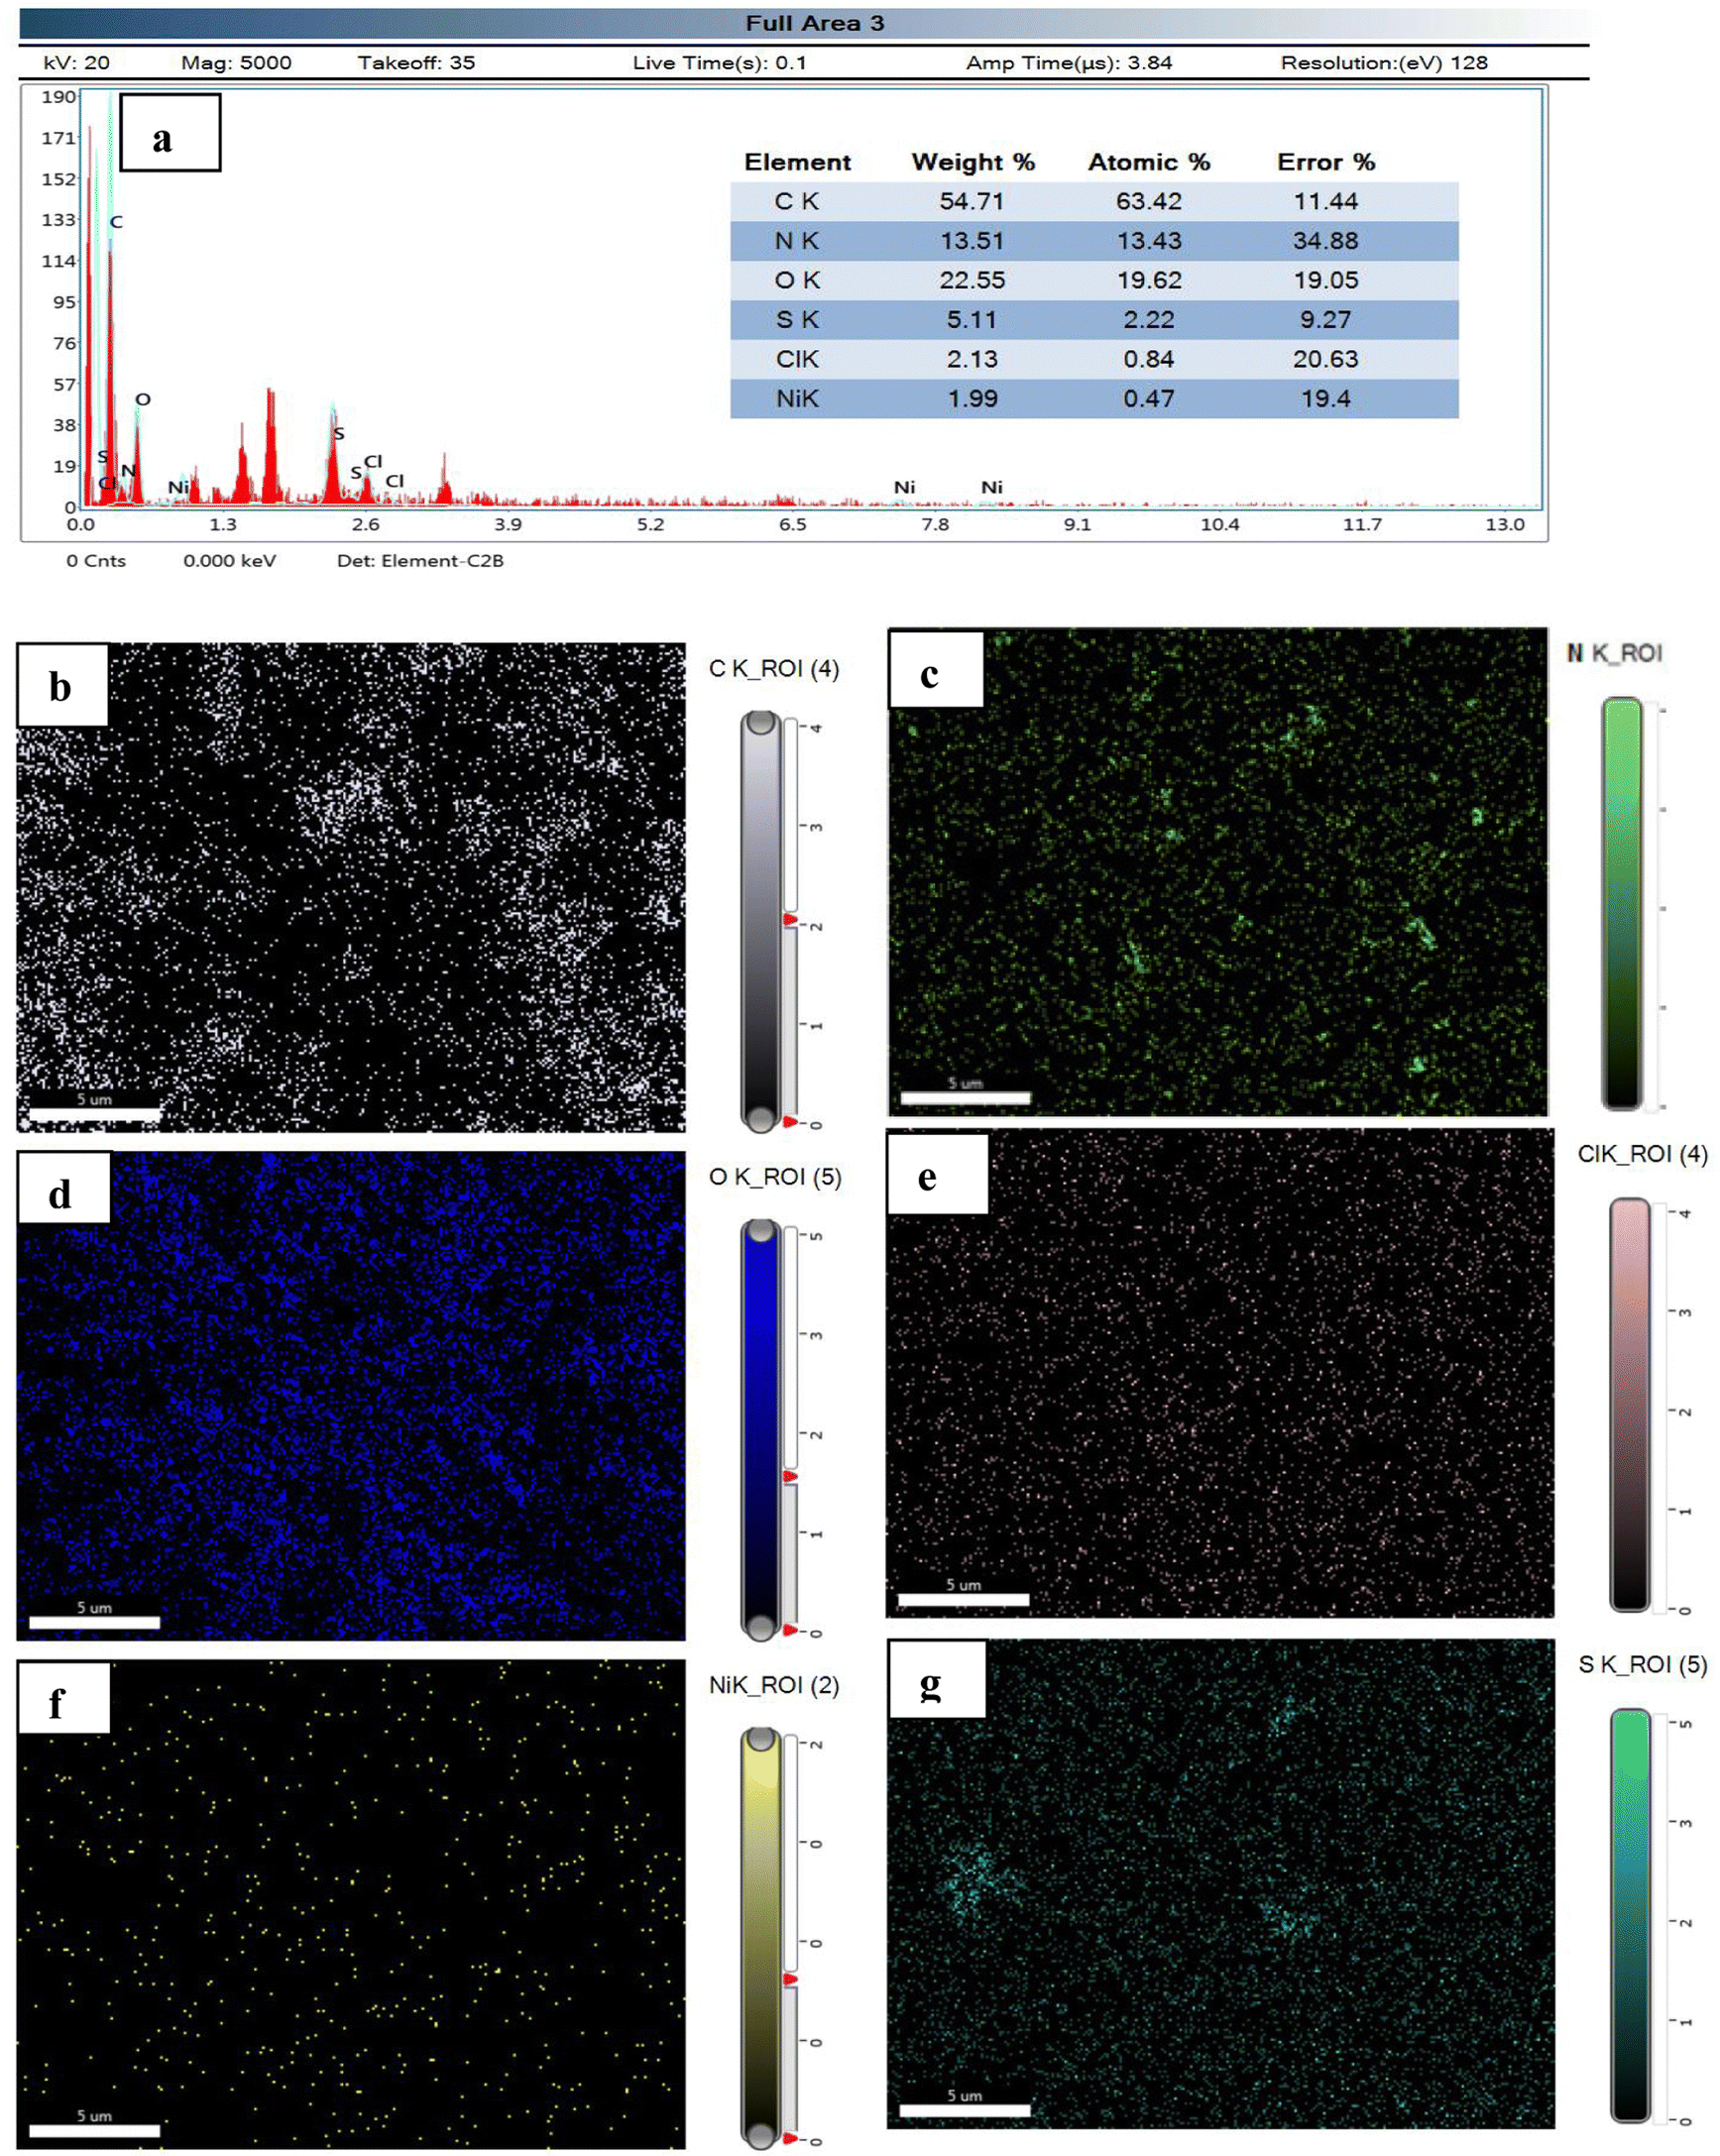
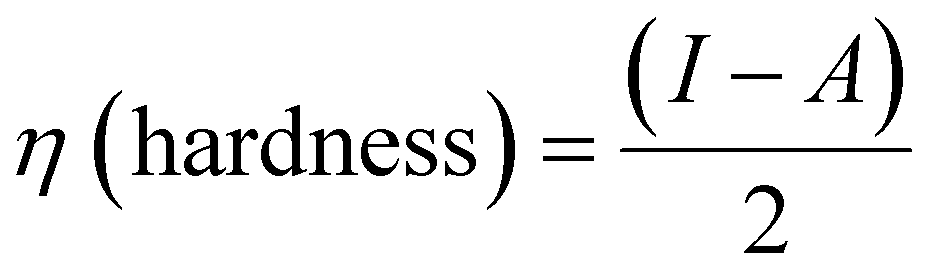
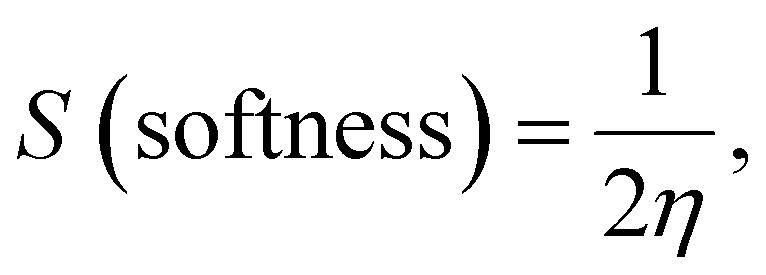
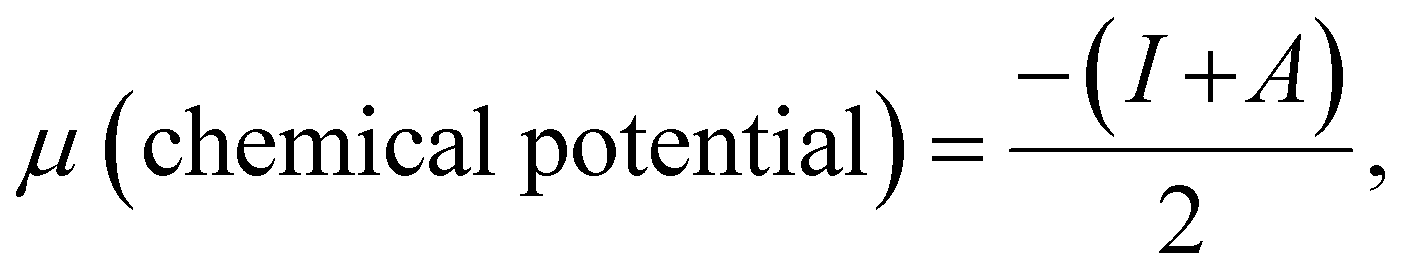

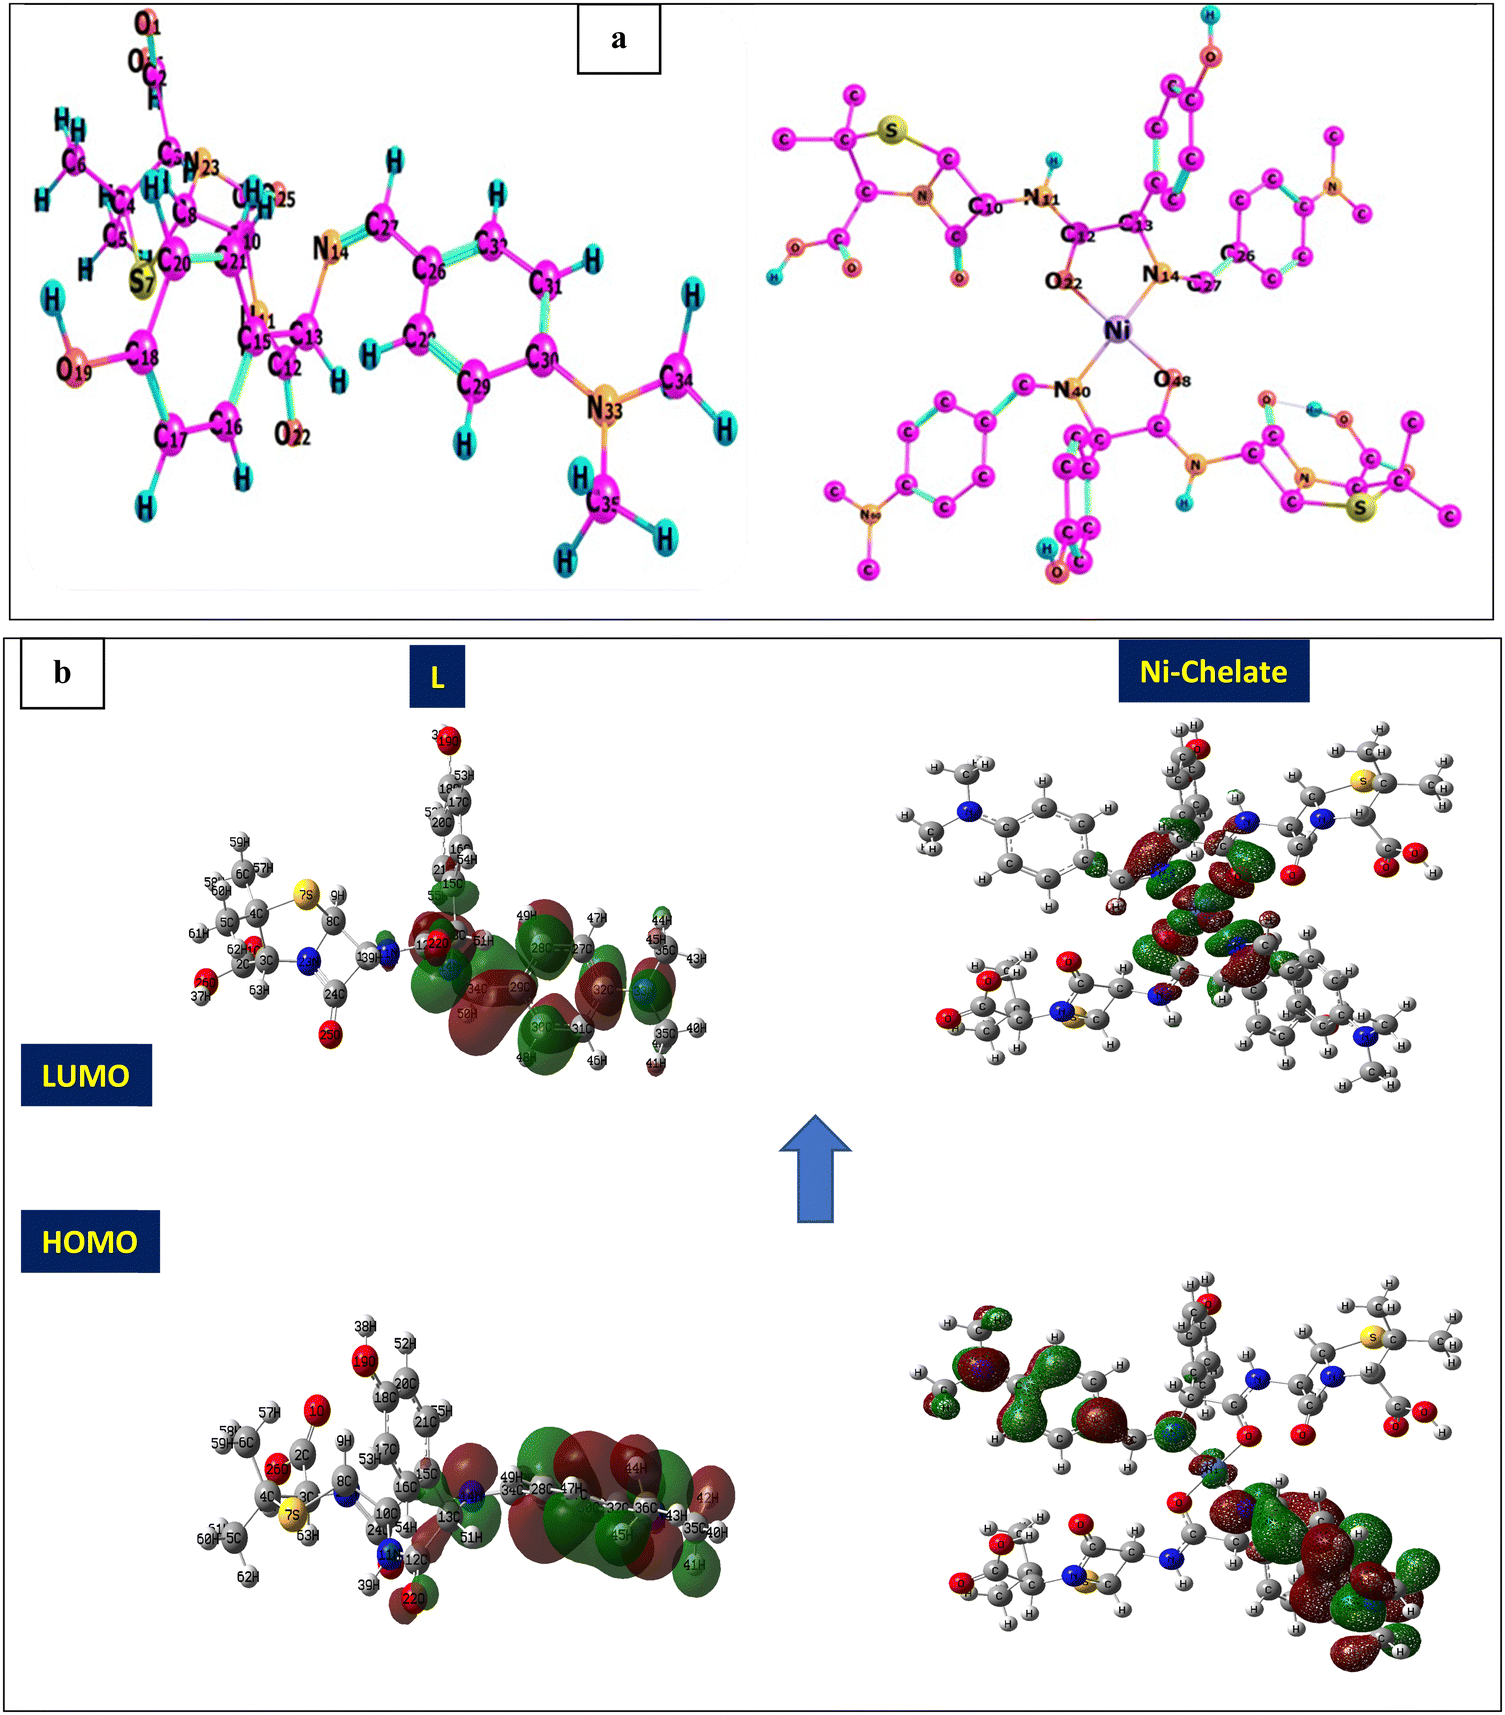
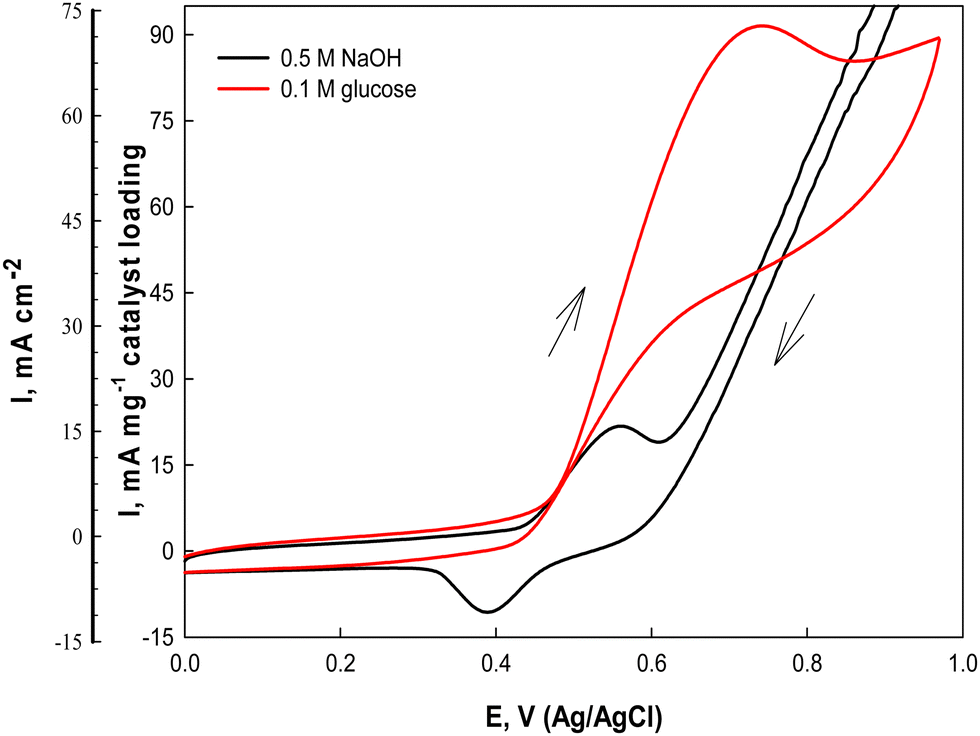
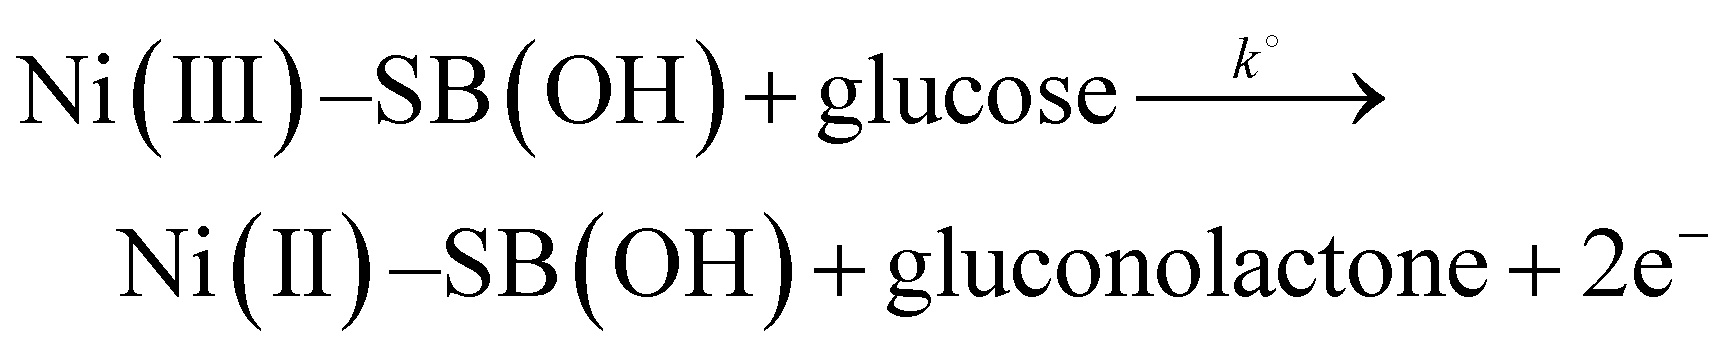
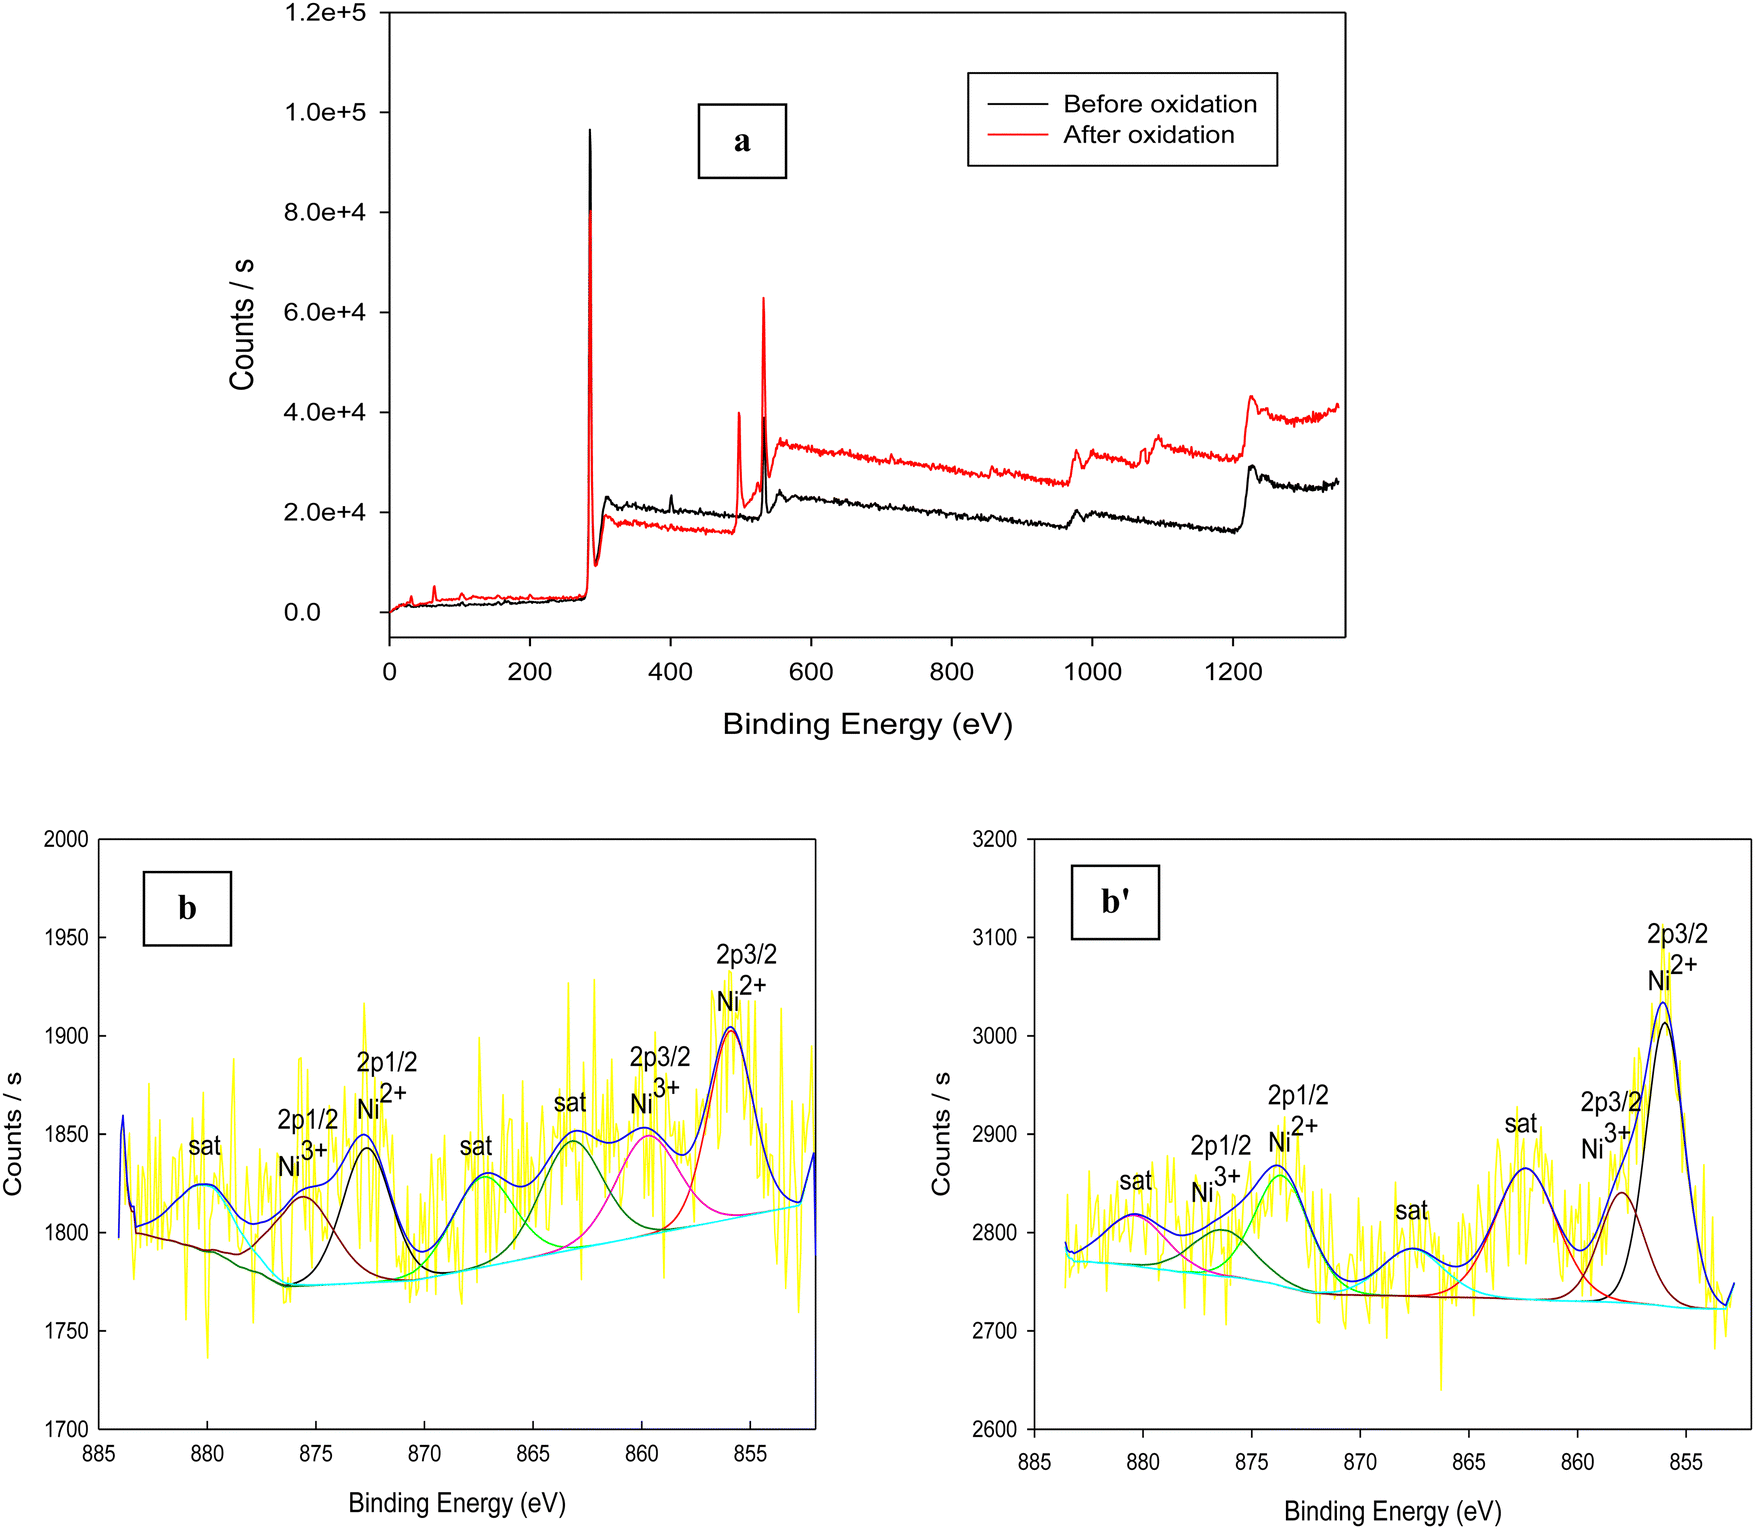

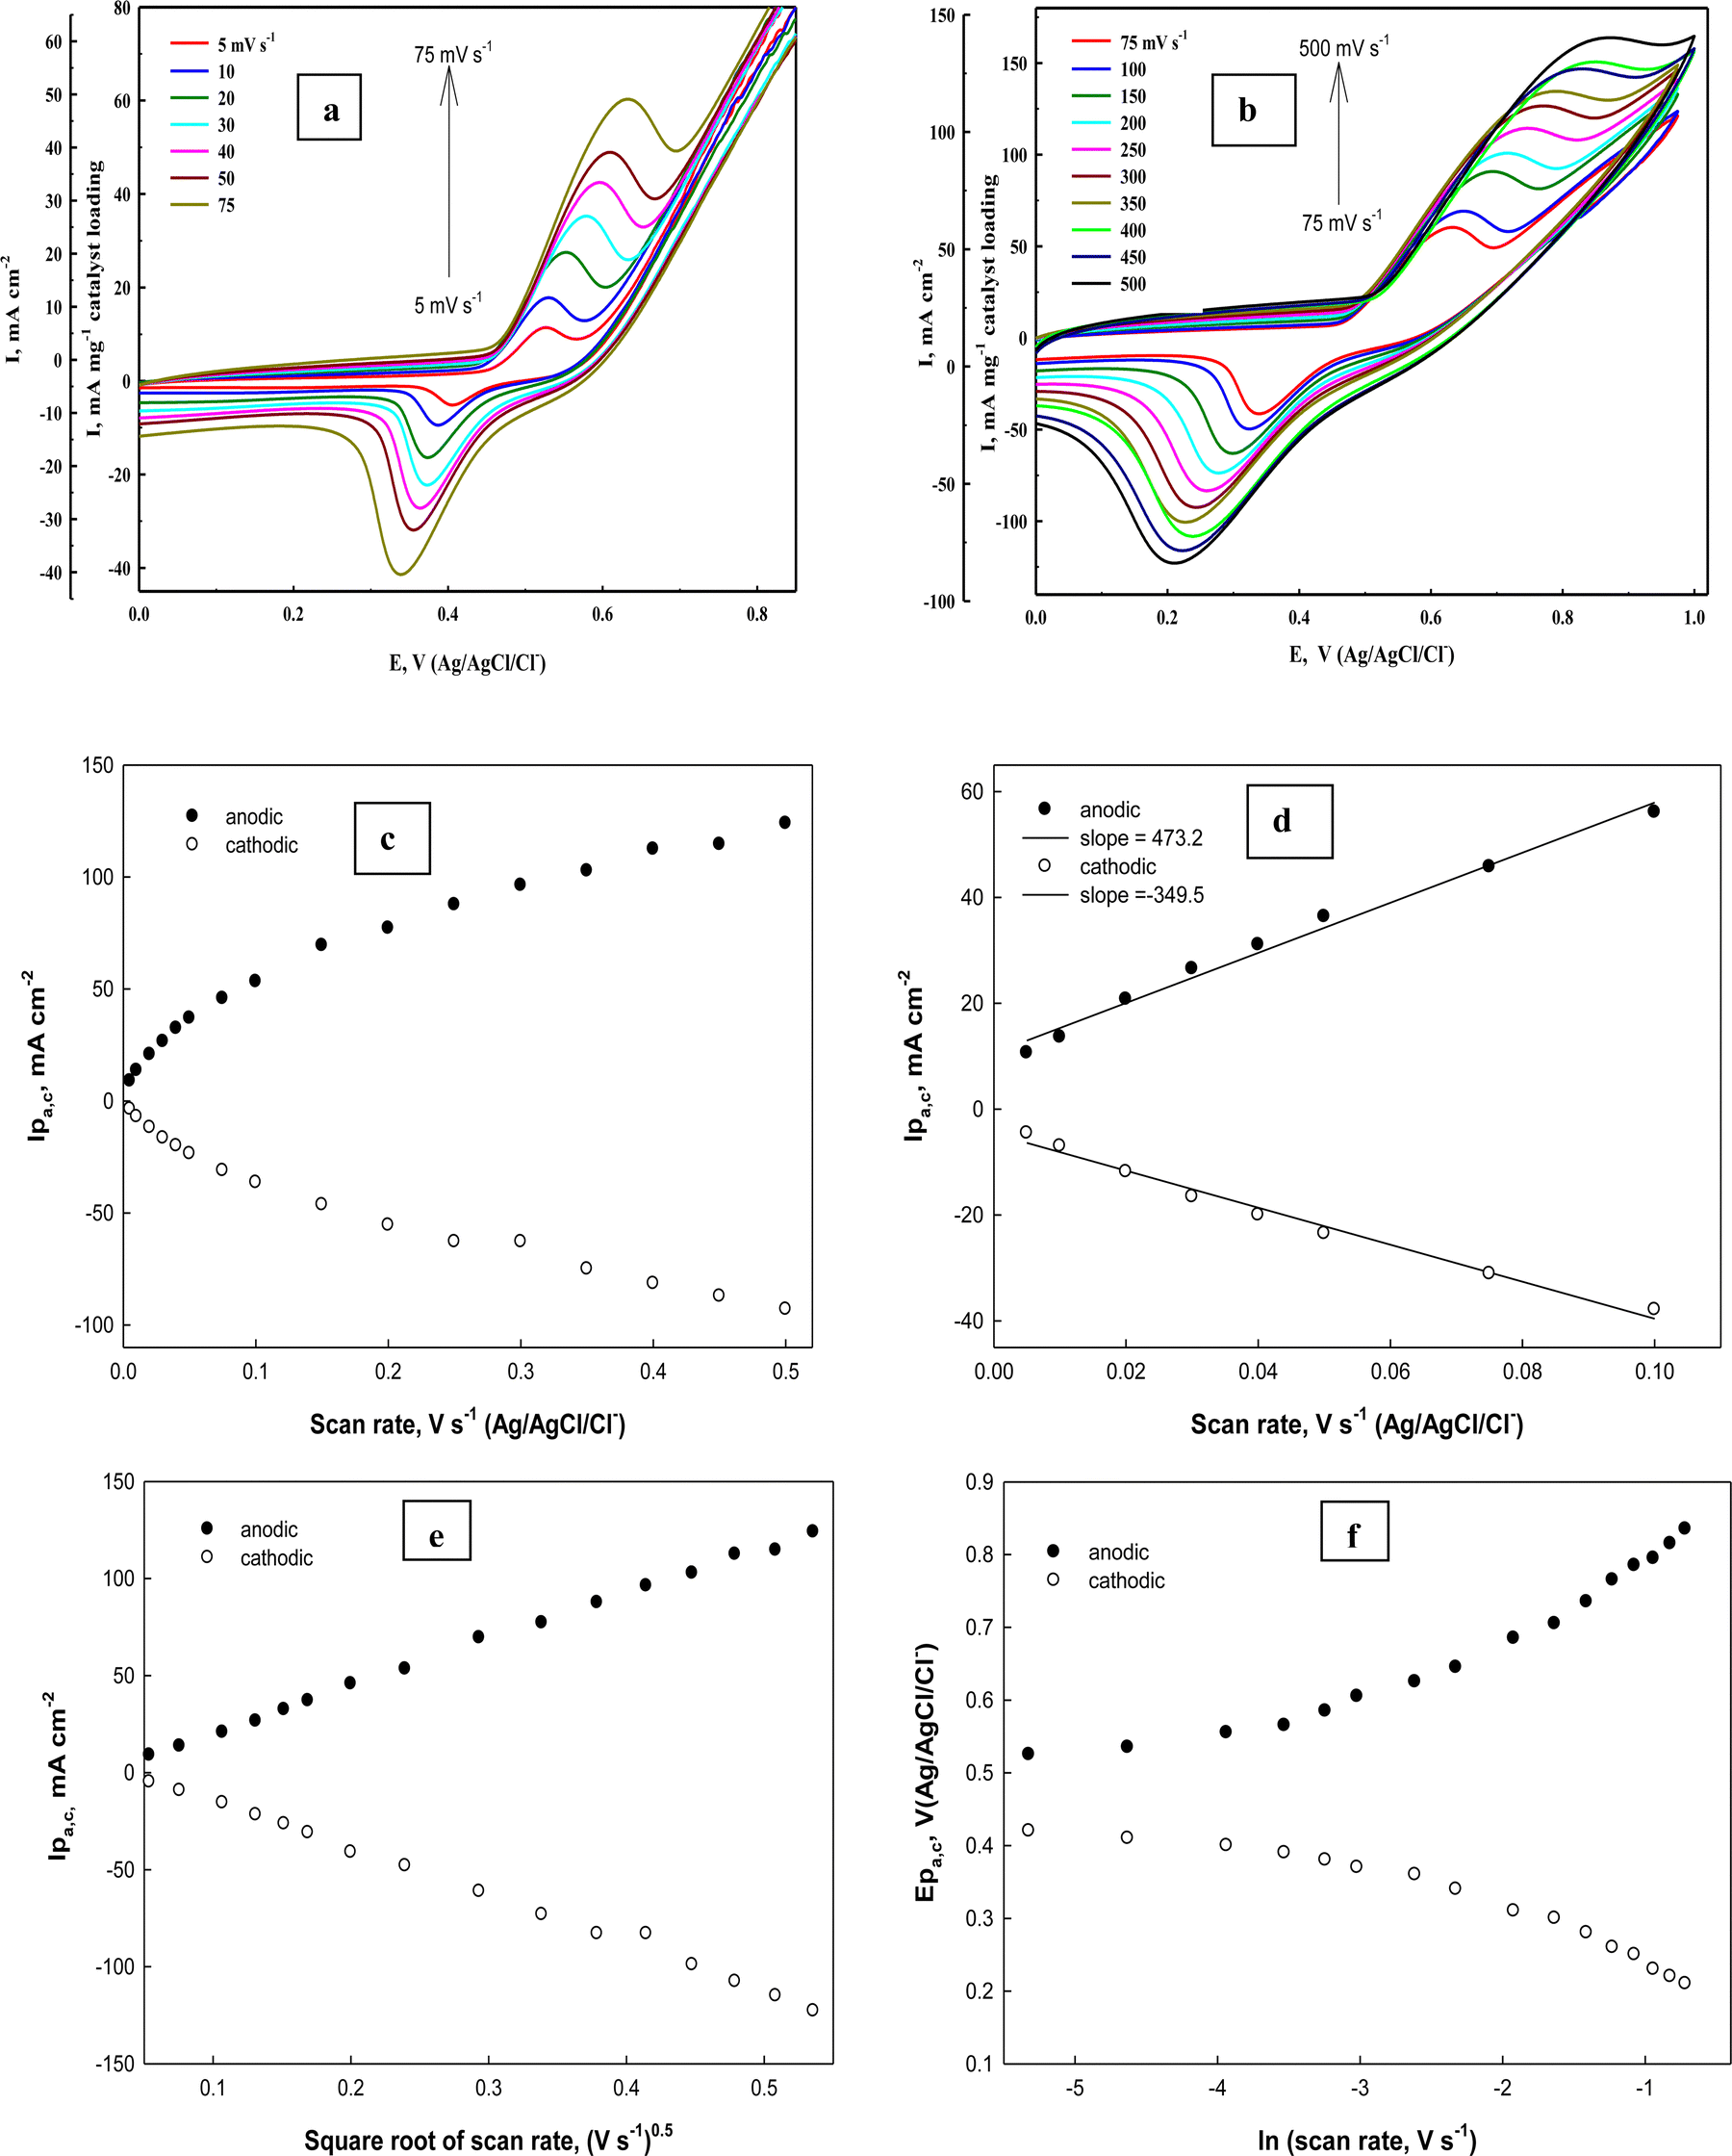
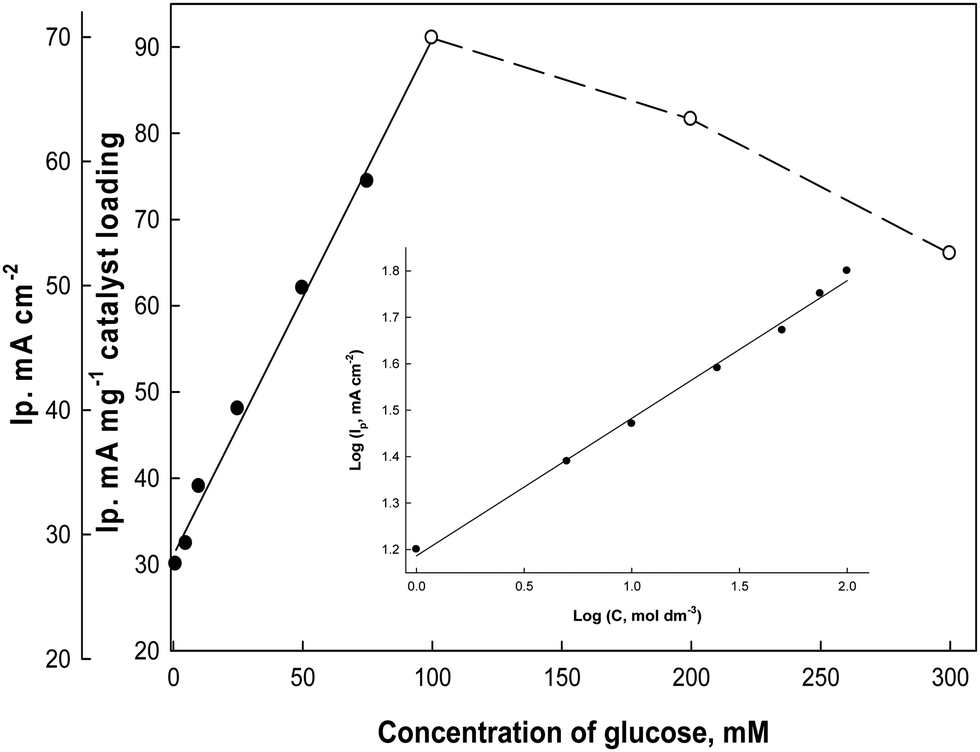
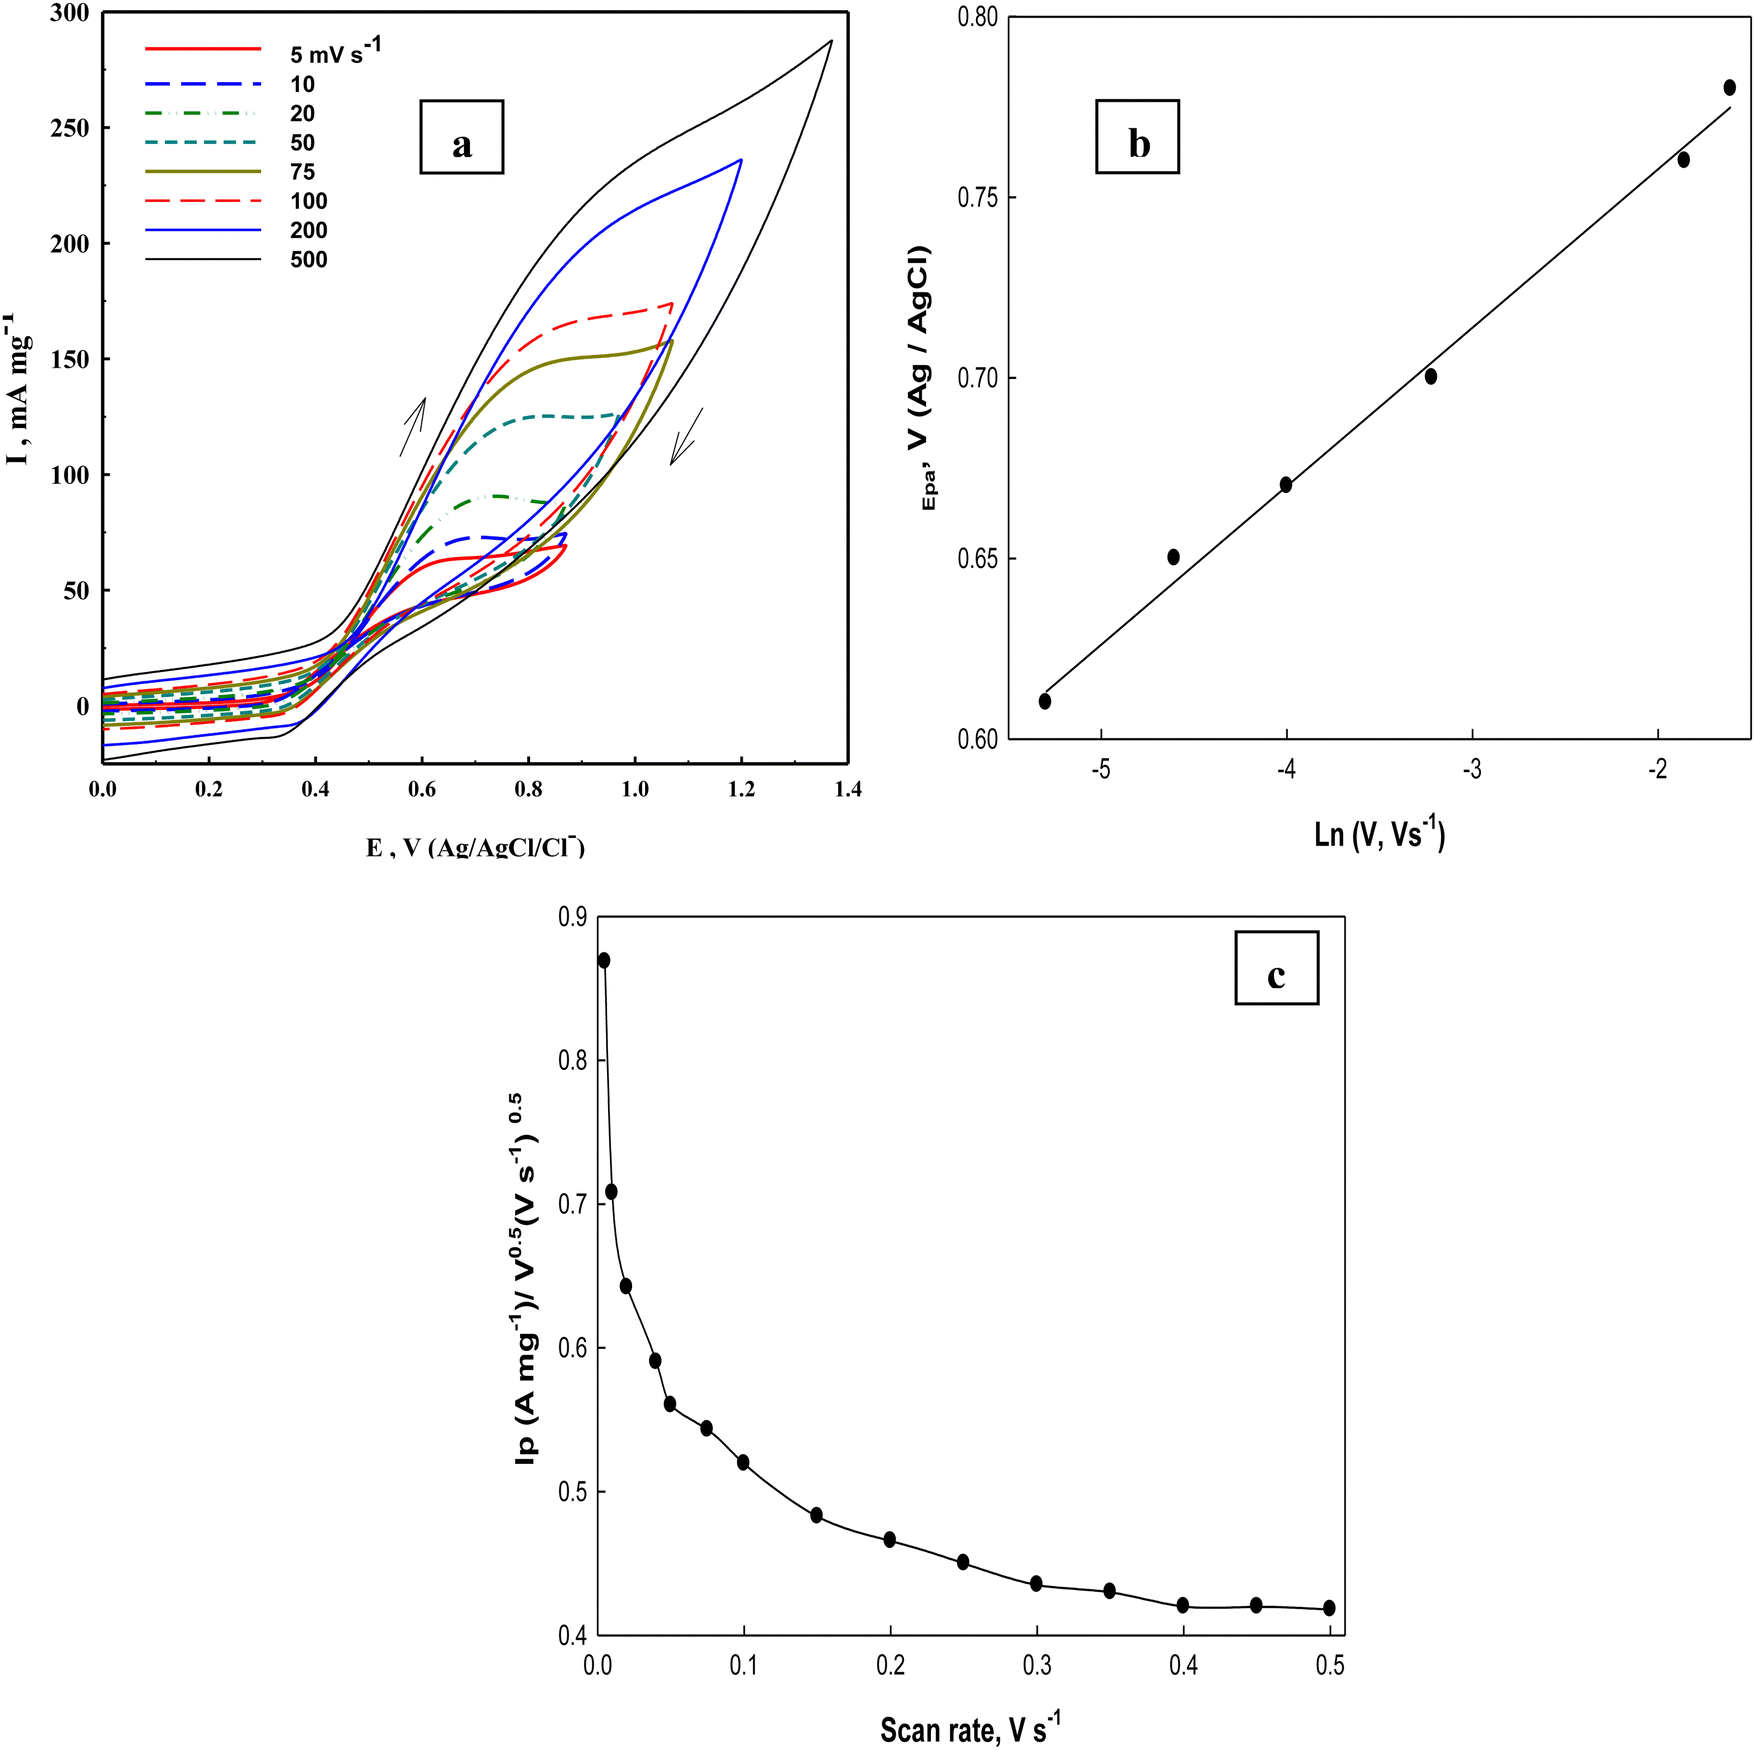
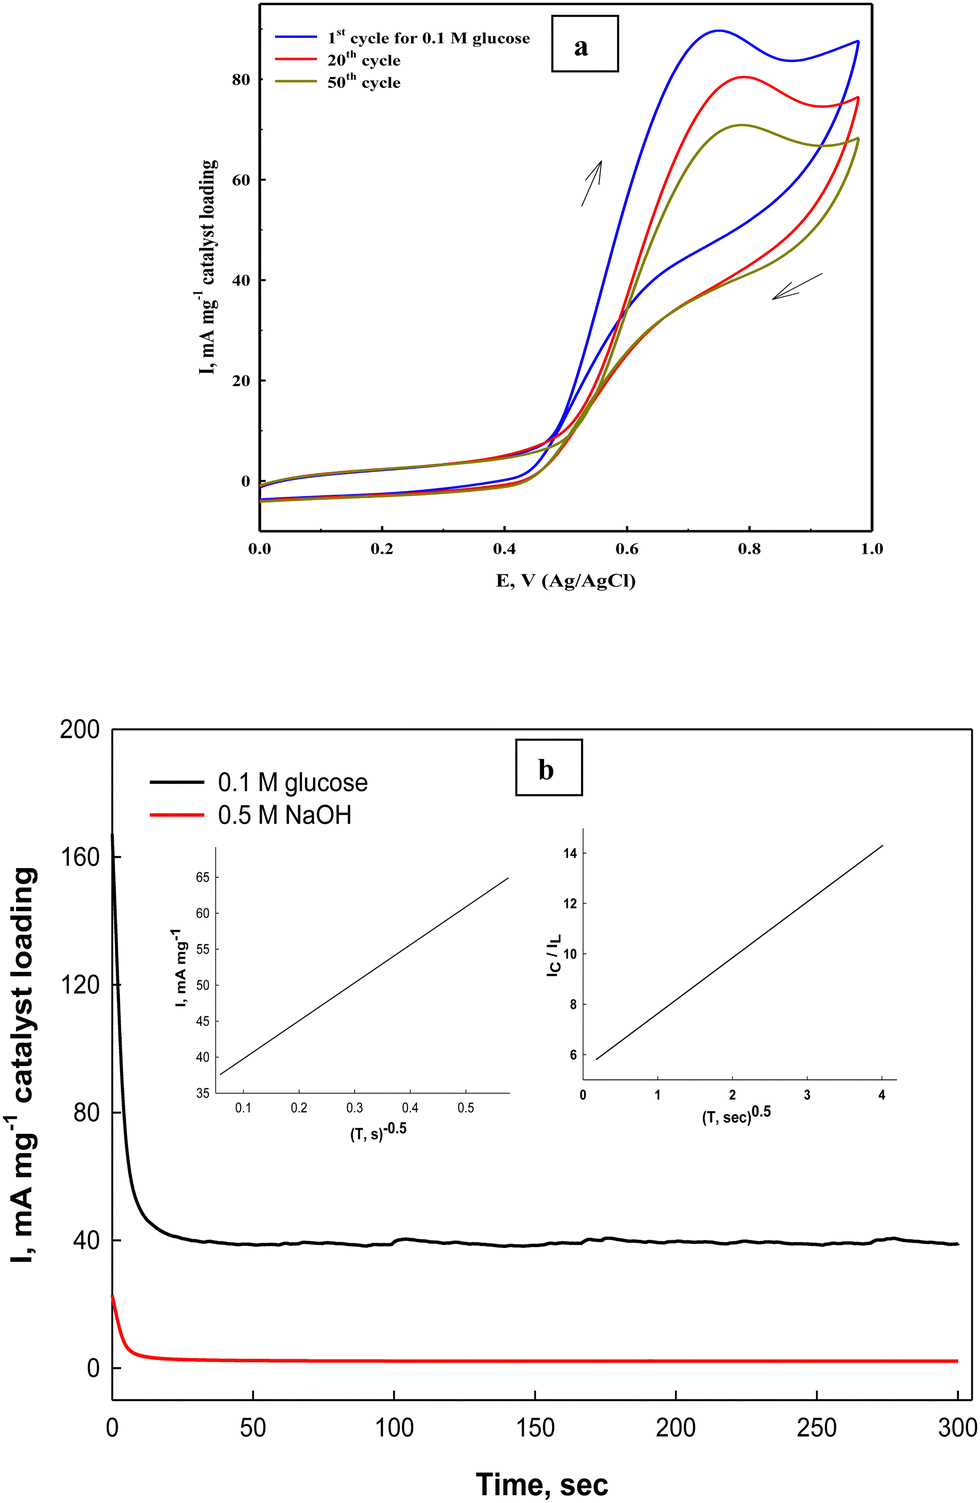
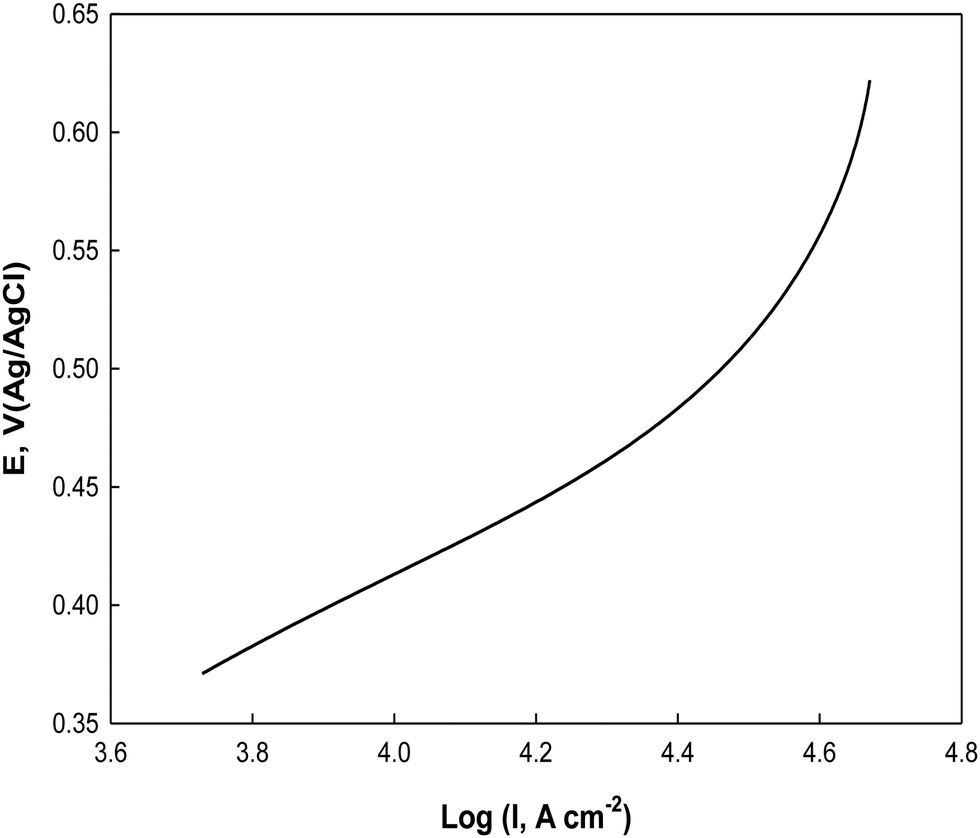
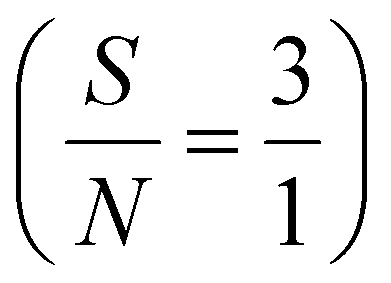 .
.