 Open Access Article
Melanin/PEDOT:PSS blend as organic mixed ionic electronic conductor (OMIEC) for sustainable electronics†
Natan Luis
Nozella
 ab,
João Victor Morais
Lima
 a,
Rafael Furlan
de Oliveira
 *b and
Carlos Frederico de Oliveira
Graeff
 *a
*a
aSão Paulo State University (UNESP), School of Sciences, POSMAT – Post-Graduate Program in Materials Science and Technology, Bauru, SP 17033-360, Brazil. E-mail: carlos.graeff@unesp.br
bBrazilian Nanotechnology National Laboratory (LNNano), Brazilian Center for Research in Energy and Materials (CNPEM), Campinas 13083-100, SP, Brazil. E-mail: rafael.furlan@lnnano.cnpem.br
First published on 13th September 2023
Abstract
Organic mixed ionic–electronic conductors (OMIECs) can efficiently couple and transport ionic and electronic charge species, making them key elements for bioelectronics, neuromorphic computing, soft robotics, and energy storage applications. Here, we have synthesized a water-soluble, bio-inspired ion conductor melanin (Mel) and blended it with benchmark conducting polymer poly(3,4-ethylenedioxythiophene) polystyrene sulfonate (PEDOT:PSS) to form a new OMIEC. We explored the potential of Mel/PEDOT:PSS OMIEC blends in two critical device applications: organic electrochemical transistors (OECTs) and supercapacitors (SuperCaps). Mel incorporation into PEDOT:PSS enhances the ionic–electronic coupling when ions from an electrolyte are injected into the material, increasing the volumetric capacitance of PEDOT:PSS films ten-fold. The addition of Mel in PEDOT:PSS also increases the transconductance of OECTs (from 7 ± 1 to 11 ± 3 mS), and the energy and power densities of SuperCaps, from 0.41 ± 0.02 to 0.62 ± 0.01 W h kg−1 and from 119 ± 14 to 190 ± 6 W kg−1, respectively. This work exploits the fundamental properties, device physics, and technological potential of a new and green OMIEC, ultimately aiming the development of sustainable electronics.
1. Introduction
Organic mixed ionic–electronic conductors (OMIECs) – carbon-based materials that can efficiently couple and transport ionic and electronic charges – are key elements for a variety of novel technologies, such as bioelectronic devices,1 soft robotics,2 neuromorphic computing,2,3 and energy storage applications.4 OMIECs are known to dictate the performance of such applications by presenting a strong influence on the phenomena underlying the device operation and the device figures of merit (FoM).5 For example, the transconductance of organic electrochemical transistors (OECTs) employed in bioelectronics, such as sensors6,7 and memory devices,8 is strongly dependent on the ionic–electronic coupling and electronic conduction, while the OECT response time, e.g., for neuromorphic applications, is mainly dependent on the ionic transport within the material.5,9 In supercapacitors (SuperCaps), the specific energy and capacitance are substantially affected by the efficiency of ionic–electronic coupling in the OMIEC.5,10One challenge to improving the performance of devices is to design new OMIECs with optimized ion/electron coupling and transport. Additional characteristics also appealing for a variety of applications are solution processability and biocompatibility aiming to reduce the costs and environmental impact of novel technologies. In this sense, poly(3,4-ethylenedioxythiophene) polystyrene sulfonate (PEDOT:PSS) is the benchmark OMIEC for several applications, such as light emitting diodes,11 photovoltaics12 and wearable devices.13,14 PEDOT:PSS possess unique characteristics that arise from the combination of a positively charged π-conjugated polymer (PEDOT) chain containing a negatively charged insulating PSS moiety.15 As a result, PEDOT:PSS exhibits excellent processability in water and thin film formation, thermal stability, high transparency,16 elevated electronic conductivity (up to 103 S cm−1),17 and permeability to ions from aqueous media.18,19 The uptake of ions by the PEDOT:PSS film controls its volumetric capacitance (C*) which reflects on the efficiency of the ion penetration, transport, and storage ability of the OMIEC film.18,19 However, PEDOT:PSS shows limited C*, with typical values in the range of 39 to 170 F cm−1.20,21 Tunning the C* of PEDOT:PSS is key to improving the performance of several device aplications.19,22
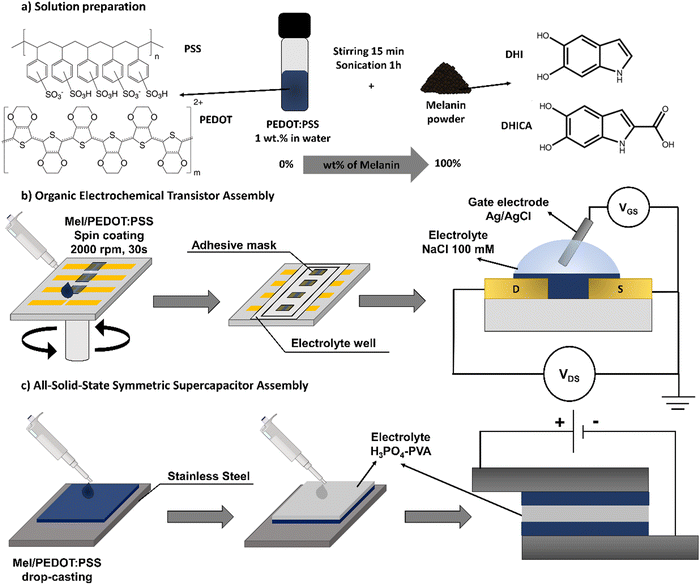
Here, aiming to add new functionalities to PEDOT:PSS we employed melanin, a bio-inspired macromolecule that shows great potential for bioelectronics.23,24 Melanin is a heterogeneous macromolecule mainly composed of 5,6-dihydroxyindole (DHI) and 5,6-dihydroxyindole-2-carboxycil acid (DHICA) monomers (Fig. 1a).25,26 It presents unique properties, such as broadband absorption in the UV-Vis range,27 free radical scavenging,28 metal ion chelation29 and hydration-dependent conductivity.26,30 Melanin is also a biocompatible and biodegradable material,31,32 which makes it suitable for sustainable electronics.33,34 Due to its extensive properties, melanin has been largely employed in a variety of applications, such as electrochemical and humidity sensors,35,36 memory and energy storage devices.37–40
Although the fundamental aspects of the charge transport in melanin films are still unclear, the literature indicates the existence of protonic and electronic current related to the so-called comproportionation equilibrium reaction26,41 (Fig. S1, ESI†). In this mechanism, the change of the state of hydration modulates the charge density of proton released in the form of hydronium (H3O+) and anion in the semiquinone (SQ) free radicals from two other redox forms of melanin, namely quinone and hydroquinone. Recent work proposes an electrochemical mechanism that shows the electrolyte pH plays an important role in the charge transport within melanin.42 Due its limited processability in solution, alternative synthetic methods have proposed aiming to improve the melanin processability and expand its applications.43–46 Bronze-Uhle and collaborators proposed a simple and environmentally friendly synthesis approach to obtain synthetic melanin soluble in water.46 Their method is carried out under elevated oxygen pressure yielding compounds with higher DHICA/DHI ratio, which makes it more similar to natural melanin.
In this work, we blend PEDOT:PSS with different concentrations of water soluble melanin (Mel) in order to improve its ionic transport and ionic–electronic coupling properties. The performance of this newly formed OMIEC is evaluated in two critical device applications, namely OECT and SuperCaps.
2. Experimental procedures
2.1. Chemicals
Poly(3,4-ethylenedioxythiophene) polystyrene sulfonate (PEDOT:PSS) (1% weight in water), 3-(3,4-dihydroxyphenyl)-DL-alanine, DL-3-hydroxytyrosine (DL-DOPA), ammonium hydroxide (NH4OH), sodium chloride (NaCl) and polyvinyl alcohol (PVA, 89–98 g mol−1) were all purchased from Sigma Aldrich and used as received. Ortho-phosphoric acid (H3PO4 85%, 98 g mol−1) was acquired from Êxodo Científica (Brazil).2.2. Melanin synthesis and Mel/PEDOT:PSS blend preparation
Mel was synthesized by mixing 0.3 g of DL-DOPA in 60 mL of Milli-Q water (18.2 MΩ cm) and 400 μL of NH4OH. The solution was placed in a stainless-steel reactor under 6 atm of industrial oxygen (99.5% of purity) for 6 h. The mixture was then extracted and purified using a 3500 MWCO dialysis membrane in Milli-Q water until no color change in the medium was observed. The synthesis was dried in an oven at 90 °C for 6 h. Since Mel is water soluble, the powder was diluted directly in the aqueous commercial PEDOT:PSS solution, producing different ratios of Mel/PEDOT:PSS blend by adding different content of Mel (wt%). The Mel/PEDOT:PSS blend was stirred for 15 min and then sonicated for 1 h before film deposition (Fig. 1a). Mel/PEDOT:PSS blends at 0, 10, 20, 30, 50, and 100 wt% of Mel were produced, here named respectively as pure PEDOT:PSS, 10Mel, 20Mel, 30Mel, 50Mel, and 100Mel. Blends having higher concentrations than 50% of Mel content did not present good film processability.2.3. Mel/PEDOT:PSS solution and thin-film characterization
Mel/PEDOT:PSS solutions were analyzed by ultraviolet-visible (UV-Vis) spectroscopy and Fourier-transform infrared spectroscopy (FTIR). For the UV-Vis measurements, different solutions at concentrations of 0.05 mg mL−1 were analyzed in PerkinElmer equipment (Lambda 1050 model), within the wavelength range from 1100 to 350 nm. FTIR measurements were carried out in attenuated total reflection mode (ATR) directly in Mel/PEDOT:PSS solution samples using a Jasco FTIR-4600 spectrometer (USA). FTIR spectra were registered from 4000 cm−1 to 500 cm−1 with a resolution of 4 cm−1 at room temperature.The morphological characteristics of Mel/PEDOT:PSS films were evaluated by atomic force microscopy (AFM). AFM measurements were carried out in a Bruker Multimode instrument in peak force tapping mode using a ScanAsyst-Air (Bruker) tip with 0.4 N m−1 spring constant operating at room temperature and in a nitrogen-rich atmosphere. Laser Confocal Optical Microscopy (LSCM) was performed using a Keyence VK-X200 microscope. The film thickness was determined by contact profilometry (Dektak DXT S – Bruker) from a step profile created on the surface. The Mel/PEDOT:PSS film thickness and surface roughness are given in the ESI† (Tables S1 and S2).
2.4. OECT fabrication and electrical characterization
Glass slides (15 mm × 25 mm, Olen) were employed as the OECT substrate. Au source (S) and drain (D) electrodes (50 nm thick) were deposited by resistive evaporation through a shadow mask. We fabricated devices having SD channel length (L) of 130 μm and a width (W) of 2 mm. Different Mel/PEDOT:PSS blends were deposited in the channel via spin coating (2000 rpm, 30 s) using 2 μL of solution. The deposited films were annealed on a hot plate at 80 °C for 30 min prior to any electrical measurements. To confine the Mel/PEDOT:PSS on the device channel area and to avoid direct contact between the electrolyte and the SD electrodes, an adhesive mask from Pimaco Ltda was employed. For the OECTs characterization, an Ag/AgCl wire was used as the top gate electrode immersed in a 100 mM of NaCl electrolyte solution prepared in Milli-Q water (18.2 MΩ cm). The OECT fabrication steps are illustrated in Fig. 1b.Prior to the OECT operation, the current–voltage (I–V) characteristics of Mel/PEDOT:PSS films deposited onto a pair of Au electrodes that are 130 μm distant and 2 mm wide were evaluated. I–V curves were recorded in dry condition and as a function of the relativity humidity (RH). The I–V measurements were carried out in a probe station containing a hermetically-sealed chamber to allow precise control of the RH inside. The RH levels were adjusted by controlling the injection of N2 and H2O vapor fluxes in the chamber and monitored using an Akso AK625 humidity sensor. The I–V curves were recorded using Keithley 4200 SCS equipment. The Mel/PEDOT:PSS conductivity (σ) was calculated from the film average resistance (R) obtained from I–V measurements, and the values are given in Table S3 (ESI†).
The C* of hydrated films was evaluated employing low-signal electrochemical impedance spectroscopy (EIS) using a Metrohm Autolab potentiostat/galvanostat PGSTAT302 equipped with a FRA32M impedance module. EIS measurements were performed by short-circuiting the SD electrodes coated with Mel/PEDOT:PSS to act as working electrode (WE). An Au coplanar electrode (2 × 2 mm2) was used as counter electrode (CE). EIS was performed in 100 mM NaCl aqueous electrolyte and within the 10−1–105 Hz frequency range using a sine-wave voltage signal amplitude of 50 mV (root-mean-square, rms). No dc bias offset was employed. The EIS data was analyzed using Autolab Nova 2.1.6 software.
The Mel/PEDOT:PSS OECTs characteristics were assessed by means of the registration of the device output and transfer curves. The device output characteristics were obtained by sweeping the drain-source voltage (VDS) from 0.01 V to −0.8 V for different gate-source (VGS) biases in a step of 0.2 V. The OECT transfer curves were recorded by varying VGS from −0.8 V to 0.8 V at a rate of 0.1 V s−1. Time response curves were obtained at −0.6 V VDS while applying a pulsed VGS bias of 0.8 V for 10 s followed by 10 s rest at 0 V VGS. For all OECT measurements, the S terminal was set to ground and an Ag/AgCl electrode was employed as gate electrode. The data was recorded in a probe station and using a Source Measure Unity Keithley 2636B.
2.5. SuperCap assembly and electrochemical characterization
Symmetrical solid-state SuperCaps were prepared onto stainless steel substrates. An area of 0.64 cm2 (0.8 cm × 0.8 cm) was delimited with an adhesive mask from Pimaco Ltda where 0.6 mg of pure PEDOT:PSS or 10% Mel/PEDOT:PSS was deposited by drop-casting. The electrodes were annealed in a hotplate at 110 °C for 1 h to remove excess water. Two identical stainless steel electrodes were sandwiched with 100 μL of H3PO4-PVA gel electrolyte to form the symmetrical Mel/PEDOT:PSS SuperCaps. The SuperCap assembly is illustrated in Fig. 1c. To produce the gel electrolyte, 0.5 g of PVA was added to 5 mL of deionized water (DI) and kept under magnetic stirring (1500 rpm) at 90 °C for 2 h. Then, 354 μL of H3PO4 was added to the solution under stirring. Finally, the electrolyte solution was stored at room temperature overnight and used to assemble the SuperCaps.The SuperCap electrochemical characterization was performed using a potentiostat Autolab PGSTAT 302 equipped with a FRA32M impedance module in two and three-electrode configurations. In the three-electrode system, the films were deposited onto a glassy carbon WE (15 mm × 10 mm), and Pt and Ag/AgCl electrodes were used as CE and RE, respectively. The measurements were carried out in 1.2 M of H3PO4 employing a voltage range of −0.3 to 0.3 V. In the two-electrode configuration, the measurements were performed in a potential range from 0 to 0.8 V. Cyclic voltammetry (CV) was performed using scan rates varying from 10 to 200 mV s−1. Galvanostatic charge–discharge (GCD) was carried out employing charging and discharging currents from 0.1 to 1.0 A g−1. EIS was performed at the open circuit potential with an amplitude of 10 mV in a frequency range from 100 kHz to 0.1 Hz. All calculations were performed by the Supercapacitor Auto Analyzer software.47
3. Results and discussion
3.1. Mel/PEDOT:PSS blend characteristics
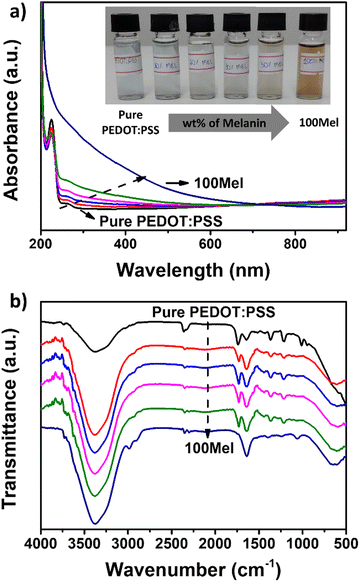
Fig. 2a depicts the UV-vis absorbance spectra of pure PEDOT:PSS and different Mel/PEDOT:PSS solutions. The spectrum of pure PEDOT:PSS solution shows characteristic bands at 225 and 260 nm, which can be ascribed to electronic transitions from the substituted phenyl groups in PSS and from the aromatic EDOT group, respectively.48,49 The region between 600 and 900 nm is attributed to the PEDOT π–π* transition.48 Conversely, the 100Mel solution exhibits a featureless spectrum that is characterized by a broad absorption that decreases exponentially towards the visible and near-infrared spectral regions.50 Such a broad and featureless absorption spectrum is the result of the superposition of bands from the Mel heterogeneous subunits.51As the Mel content within the PEDOT:PSS matrix increases, the UV-vis bands ascribed to the PSS and PEDOT moieties are progressively attenuated, and the absorbance of the broad region at 300–500 nm increases. The UV-vis spectra of Fig. 2a suggest good miscibility between Mel and PEDOT:PSS, which is essential to form uniform films. Such good miscibility can also be noted from eye-distinguishable color change (from blue to brown) in the respective Mel/PEDOT:PSS solutions (Fig. 2a inset).
The FTIR spectra of the Mel/PEDOT:PSS solutions and the respective individual materials are shown in Fig. 2b. The spectrum of pure PEDOT: PSS exhibits a large band at 2900–3500 cm−1 associated with –OH stretching from PSS moieties and –CH2 asymmetric stretching.52,53 The peak around ∼1640 cm−1 and ∼1025 cm−1 are assigned to C![[double bond, length as m-dash]](https://www.rsc.org/images/entities/char_e001.gif) C and C–C stretching of the phenyl side group and quinoid ring in EDOT.54,55 C–O–C bond stretching of ethylenedioxy group are observed at ∼1370 cm−1. The peaks at 1270 cm−1 and 950 cm−1 are due to –SO−3 and S–OH, respectively. A broad band below 800 cm−1 corresponds to a set of peaks attributed mainly to the C–S bond in the PEDOT thiophene ring.55
C and C–C stretching of the phenyl side group and quinoid ring in EDOT.54,55 C–O–C bond stretching of ethylenedioxy group are observed at ∼1370 cm−1. The peaks at 1270 cm−1 and 950 cm−1 are due to –SO−3 and S–OH, respectively. A broad band below 800 cm−1 corresponds to a set of peaks attributed mainly to the C–S bond in the PEDOT thiophene ring.55
For 100Mel, we observed an FTIR spectrum containing a broad band at 2850–3750 cm−1, which can be assigned to –OH and –NH stretching from indole or pyrrole groups derived from intermediate residues from the Mel synthesis.56 The peak at 1640 cm−1 could be the C–N bending mode and the small peak at 1580 cm−1 the ionization of the COO– and C![[double bond, length as m-dash]](https://www.rsc.org/images/entities/char_e001.gif) H. Alcoholic O–H from amino acids is characterized by a peak at 1060 cm−1, as reported in literature.56 Upon the addition of Mel in the PEDOT:PSS matrix, the large band at the ca. 2850–3750 cm−1 region becomes more pronounced. The main PEDOT:PSS bands are preserved in the FTIR spectra of the Mel/PEDOT:PSS blend. No new FTIR band has been identified in Mel/PEDOT:PSS mixture suggesting that no chemical bonding is formed between the two materials.
H. Alcoholic O–H from amino acids is characterized by a peak at 1060 cm−1, as reported in literature.56 Upon the addition of Mel in the PEDOT:PSS matrix, the large band at the ca. 2850–3750 cm−1 region becomes more pronounced. The main PEDOT:PSS bands are preserved in the FTIR spectra of the Mel/PEDOT:PSS blend. No new FTIR band has been identified in Mel/PEDOT:PSS mixture suggesting that no chemical bonding is formed between the two materials.
Such a good homogeneity of Mel/PEDOT:PSS solution leads to the formation of uniform thin films. Fig. 3 shows the AFM topography of films produced from various Mel/PEDOT:PSS %wt ratios. Pure PEDOT:PSS thin films (Fig. 3a) exhibit a network of percolated nanofibers, while films made of 100Mel present a morphology that resembles a collection of compacted nanoparticles (Fig. 3f) with an average diameter of 16 ± 4 nm (see Fig. S2, ESI† for details). The corresponding surface roughness (root mean square, Rq) was found 2.8 ± 0.3 nm for pure PEDOT:PSS and 3 ± 1 nm for 100Mel films over a 2 μm × 2 μm area. The 50Mel sample exhibit the highest Rq (8 ± 3 nm), which could be explained by the particulates present in the film due to the limitation of the dispersion of this amount of Mel in the PEDOT:PSS solution (see Fig. S3, ESI,† that provided the confocal imagens of the films surface). For 10Mel and 20Mel samples (Fig. 3b and c) the characteristic nanofiber morphology of PEDOT:PSS is still evident, while for higher concentrations of Mel, such as 30Mel (Fig. 3d) and 50Mel (Fig. 3e), the PEDOT:PSS fibers are no longer noticeable. As the amount of Mel increases, their compact nanoparticle-like morphology prevails, suggesting that the PEDOT:PSS fibers become progressively wrapped by Mel clusters. It is interesting to note that at all intermediate concentrations (e.g., from 10Mel to 50Mel), no phase segregation of both components is observed. The Rq surface roughness of all film compositions is given in the ESI† (Table S2).
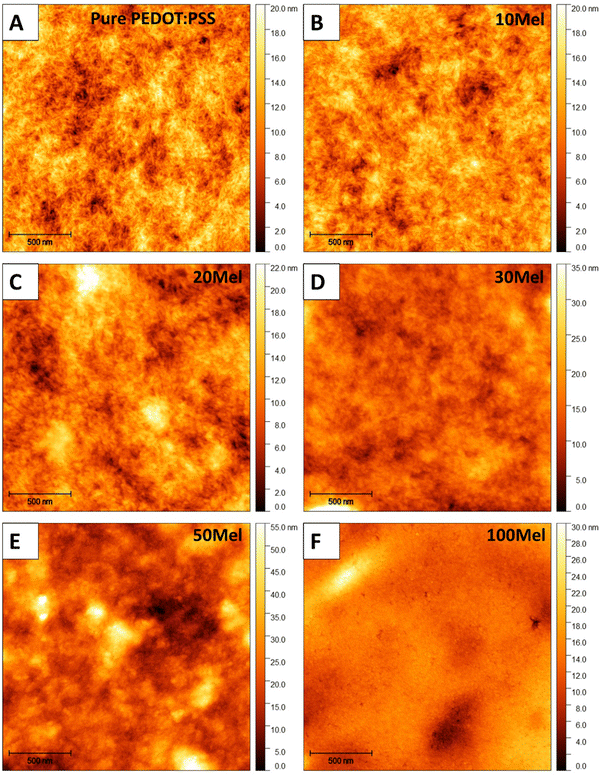 | ||
| Fig. 3 AFM topography of (a) pure PEDOT:PSS, (b) 10Mel, (c) 20Mel, (d) 30Mel, (e) 50Mel, and (f) 100Mel thin films. | ||
Before the application of Mel/PEDOT:PSS films in OECTs and SuperCaps we recorded their I–V characteristics. The electrical properties of Mel are known to be strongly humidity-dependent, for low relative humidity levels (RH) the films have lower conductivity.57 Thus, we measured the I–V response of all films at 50% RH and low voltages (from −0.5 to +0.5 V). Fig. 4a depicts the I–V response of all samples. All I–V curves are symmetrical with respect to 0 V and no rectification is observed. This suggests good charge injection in all films and no significant effects played by charge trapping within the film or at substrate/electrode interfaces.
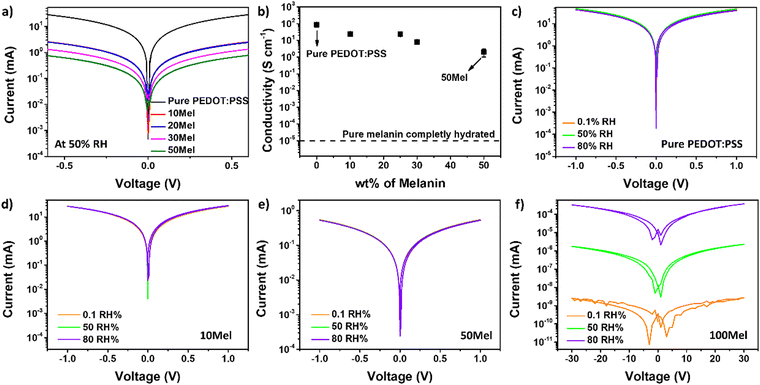 | ||
| Fig. 4 (a) I–V curves and (b) electrical conductivity of Mel/PEDOT:PSS blends. (c)–(f) I–V curves of Mel/PEDOT:PSS films under different Mel ratios and various RH. | ||
As the Mel content increases, the current levels decrease. However, even for high Mel content substantially high current levels (mA range) are registered. For 50Mel, the current levels are less than two orders of magnitude smaller than in films made of pure PEDOT:PSS. Fig. 4b shows the conductivity (σ) of all films as a function of Mel content. The σ of pure Mel at complete hydration is also indicated as a reference. Films made of pure PEDOT:PSS exhibited σ of 87 ± 24 S cm−1, while films of 50Mel presented σ = 2 ± 1 S cm−1. This does not represent a significant reduction of σ upon Mel addition to the PEDOT:PSS matrix since pure Mel films completely hydrated have σ < 10−5 S cm−1.58
Fig. 4c–f show the influence of RH in the electrical current of pure PEDOT:PSS, 10Mel, 50Mel, and 100Mel samples. The change in RH does not lead to any influence on the I–V curves of Mel/PEDOT:PSS films up to 50%. On the other hand, the current of pure Mel film is improved by about 5 orders of magnitude varying RH from 0.1 to 80%. This indicates that the remarkable electronic properties of PEDOT:PSS prevails even when 50% Mel is used to produce the films. By considering the AFM results (Fig. 3) that show the addition of Mel leads to the coverage of PEDOT:PSS fibers, rather than the formation of a new phase, we can affirm that the electronic conduction occurs within a percolative path formed by the PEDOT:PSS network.
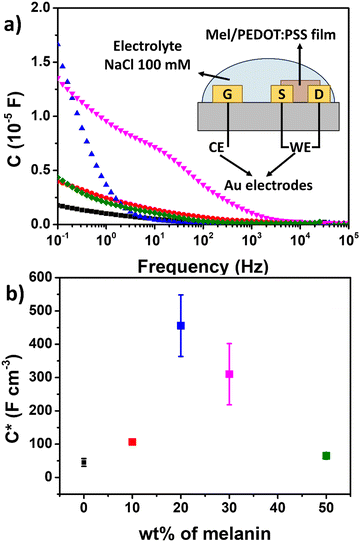
The ionic–electronic coupling in Mel/PEDOT:PSS film was investigated by two-electrodes EIS measurements. Three-electrodes EIS results are shown in Fig. S4 (ESI†). Fig. 5a presents the capacitance as a function of frequency and a inset the schematic of two-electrode configuration. The corresponding impedance phase in given in Fig. S5 (ESI†). From Fig. 5a no capacitance plateau is observed for the tested samples (including pure PEDOT:PSS), suggesting that a compact electric double layer is not formed on the film surface. Instead, the electrolyte ions penetrate the film volume, leading to a change of C*, as reported for similar transistors from the literature.59
Fig. 5b shows the film C* calculated at 100 mHz as a function of Mel content (see Table S4, ESI† for details). The increase of Mel content increases C* up to 20% Mel, which shows the highest C* (456 ± 92 F cm−3) among the measured samples. This represents around a ten-fold increase of C* with respect to pure PEDOT:PSS (45 ± 12 F cm−3).20 This enhancement can be attributed to the improvement of ionic permeability of PEDOT:PSS due to the enhanced ionic transport properties of Mel.60 Mel monomers have hydroxyl groups and carboxylic acids that can favor proton conduction.61 Finally. Further increase of Mel content slightly reduces C*.
3.2. OECTs employing Mel/PEDOT:PSS
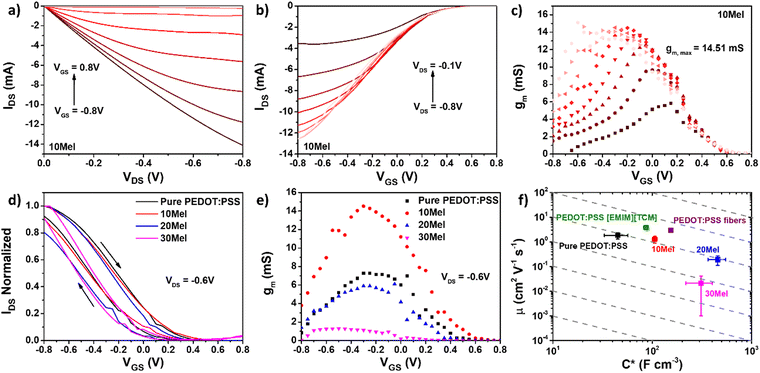
Aiming to use Mel/PEDOT:PSS in bioelectronic applications, we have evaluated the performance of OECT devices having Mel/PEDOT:PSS as the channel material. Although the highest C* was observed for 20Mel films, the best OECT performance was shown by 10Mel devices, which exhibited the largest transconductance values (gm,max = 14.5 mS) and μOECTC* product (136 ± 38 F cm−1 V−1 s−1).Fig. 6a and b depict, respectively, the output and transfer curves of OECTs employing 10Mel film. We can observe that OECTs based on 10Mel films operate in depletion mode, where a positive increase of VGS decreases progressively IDS. OECTs made of Mel/PEDOT:PSS films prepared at different ratios all operate in depletion mode, and their respective output and transfer curves are given in Fig. S6 (ESI†). Fig. 6c shows the gm curves for the 10Mel device, where the maximum gm is attained at VGS = −0.3 V and VDS = −0.6 V. Higher gm implicates in higher amplification of the signals detected in bioelectronic applications such as chemical sensors and biosensors.62
Fig. 6d shows the normalized transfer curves under reverse VGS sweep of OECTs employing films with various Mel/PEDOT:PSS ratios. The curve hysteresis (clockwise) enlarges as the Mel content increases up to 20%. Further increase of Mel reduces the transfer curve hysteresis, following the same trend observed for C* in Fig. 5b. C* and I–V hysteresis are both related to the capability of Mel/PEDOT:PSS to intake electrolyte ions and couple them with electronic charges within the film bulk.
From Fig. 6e, the increase of Mel above 10% results in gm,max values lower than those obtained with OECTs employing pure PEDOT:PSS, namely 7.8 mS. Although large gm,max – due to an increase of C* caused by an enhanced ion penetration in the film bulk – implies higher OECT signal amplification, the device response time may become slower.63 Thus, a balance between amplification and response time is often required in several OECT applications, e.g., for neuromorphic devices.62,64 The response time of Mel/PEDOT:PSS OECTs is discussed in detail hereafter.
From the gm curves in Fig. 6e, one can calculate an important FoM of OECTs, namely the carrier mobility-capacitance product μOECTC* (see ESI† for the mathematical formalism).19Fig. 6f shows the μOECTC* product diagram for OECTs employing the investigated Mel/PEDOT:PSS films and reference values for some of the best-performing PEDOT:PSS-based OMIECs reported in literature, namely PEDOT:PSS fibers65 and PEDOT:PSS having 1-ethyl-3-methylimidazoli tricyanomethanide (PEDOT:PSS [EMIM] [TCM]).66
Devices based on 10Mel films presented the highest average μOECTC* value among the tested blends, viz. 136 ± 38 F cm−1 V−1 s−1. OECTs employing pure PEDOT:PSS exhibited values of 82 ± 14 F cm−1 V−1 s−1. This corresponds to ca. 50% increase of μOECTC* upon the small addition (10 wt%) of Mel. OECTs containing 20Mel presented similar μOECTC* than devices employing pure PEDOT:PSS, namely 86 ± 31 F cm−1 V−1, even though such devices exhibited larger C* (456 ± 92 F cm−3) compared to (45 ± 10 F cm−3)20 of pure PEDOT:PSS-based devices. OECTs based on 30Mel showed the worst performance, with μOECTC* values of 7 ± 6 F cm−1 V−1. The poor performance of such devices is related to the low μOECT found in 30Mel films (viz. 0.02 cm2 V−1 s−1). The main FoMs of OECTs employing films with different Mel/PEDOT:PSS ratio is given in Table S5 (ESI†). OECTs made of 10Mel films exhibit competitive μOECTC* values in respect to other strategies employing PEDOT:PSS. The 10% of Mel addition was the optimal concentration for OECTs, in which electronic properties of PEDOT:PSS are preserved and a C* increased was achieved by the addition of Mel.
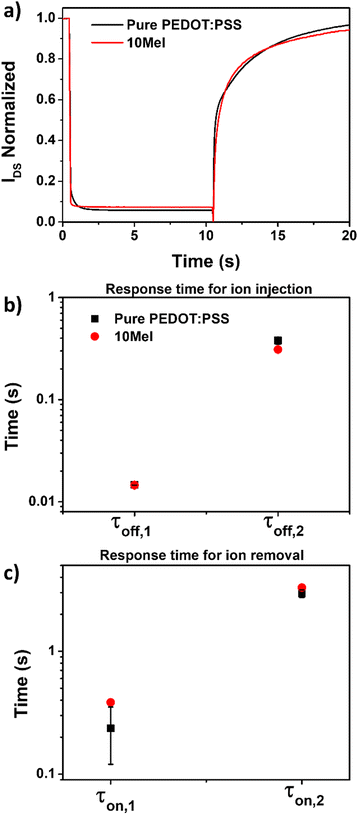
Another important FoM in OECTs is the device response time upon switching. Here, the response time of Mel/PEDOT:PSS OECTs were evaluated by applying a single pulse VGS bias of 0.8 V (pulse width = 10 s) on the gate electrode keeping VDS fixed (VDS = −0.6 V). Fig. 7a shows the normalized IDS current as a function of time for OECTs based on pure PEDOT:PSS and 10Mel films. Since the reported OECTs operate in depletion mode, the application of a positive VGS (+0.8 V) input for 10 s causes an exponential decrease of IDS on both devices. When VGS is set back to 0 V, the device IDS increases.
The application of positive VGS drives electrolyte cations (Na+) into the OECT active material, depleting the channel. Here, slightly faster response was found for devices based on 10Mel in respect to PEDOT:PSS. When VGS is set to 0 V, the ion injection is stopped, and the electrolyte cations progressively exit the channel.19 In this case, the OECT based on 10Mel was slower than PEDOT:PSS device (Fig. 7a). Faster ion intake suggests an enhanced ion permeability in the blend, while the slower ion retention can contribute to the enhanced volumetric capacitance.18 These results enable the Mel/PEDOT:PSS blend for neuromorphic application, in which the response time can be tunning by Mel addition.
To quantitatively assess the OECT response time, we fitted the IDS-time curves using exponential functions to obtain the characteristic time constants (τ) of the device switching process. A double exponential function was required to fit both IDS decay (off-state switching) and IDS growth (on-state switching). The respective fitted curves of pure PEDOT:PSS and 10Mel samples are given in Fig. S7 and S8 (ESI†). Double exponential functions are typically used to fit the rapid and slow decay in synaptic OECTs.67 The longer time constant (τ2) may be ascribed to the charging time of the polymer channel68 and the shorter time constant (τ1) to the coupling of ionic and electronic species.69
Fig. 7b and c show the characteristic τ constants for IDS decay and growth, respectively, extracted for OECTs based on 10Mel and pure PEDOT:PSS films. Both devices show similar τoff,1, while the 10Mel OECT exhibited a τoff,2 of 31.0 ± 1.7 ms, which is ca. 18% faster than that of pure PEDOT:PSS sample (τoff,2 = 37.9 ± 3.0 ms). The faster τoff,2 response for the 10Mel device suggests that the natural pigment favors the ion intake into the channel due to its enhanced ionic mobility.70 For the second process (on-state switching), the curve fitting returns τon,1 = 0.38 ± 0.02 s and τon,2 = 3.3 ± 0.2 s for 10Mel, and τon,1 = 0.2 ± 0.1 s and τon,2 = 9.0 ± 0.2 s for pure PEDOT:PSS (Fig. 7c). The slower time response of Mel-based devices may be attributed to the melanin metal-ion chelating-ability.71,72
3.3 SuperCaps employing Mel/PEDOT:PSS films
Another appealing device for sustainable electronics that strongly rely on the efficient ionic/electronic coupling of OMIECs is SuperCaps. Here, the charge storage of 10Mel blend is used to fabricate SuperCaps. Fig. 8 shows the current–voltage characteristics of SuperCaps based on pure PEDOT:PSS and 10Mel electrodes obtained at 20 mV s−1. Results from the electrochemical characterization of 10Mel and PEDOT:PSS films in a three-electrode configuration are presented in Fig. S9 (ESI†).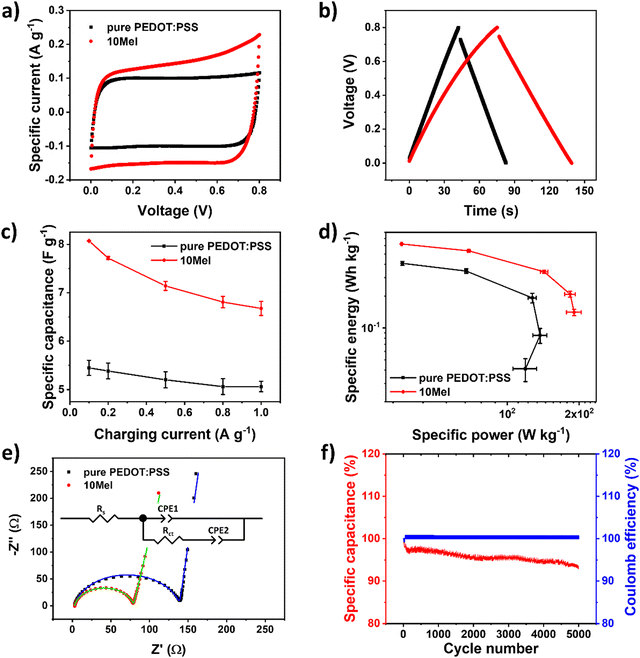 | ||
| Fig. 8 Electrochemical characterization of pure PEDOT:PSS and 10Mel SuperCaps. (a) CV curves at 50 mV s−1, (b) GCD curves at 0.1 A g−1, (c) specific capacitance vs. discharge current and (d) Ragone plot calculated from GCD curves and (e) Nyquist plot of pure PEDOT:PSS and 10Mel samples (solid lines correspond to data fit employing the equivalent circuit shown inset). (f) Life-cycle test at 0.5 A g−1 for 10Mel-based SuperCaps. Data analysed using the Supercapacitor Auto Analyser (SCAA) software.47 | ||
From Fig. 8a we show the predominant capacitive behavior of the samples, as illustrated by large hysteresis possessing a rectangular shape.73 Here, the potential window was limited to 0.8 V to avoid water electrolysis. The use of 10 Mel films shows an increased capacitance, and therefore higher specific currents, with respect to SuperCaps employing pure PEDOT:PSS. The capacitive behavior of the devices can also be observed from the GCD curves74 in Fig. 8b, where the longer charging/discharging cycle presented by the 10Mel SuperCap indicates greater capacitance than PEDOT:PSS. From Fig. 8b, we found a Coulombic efficiency of 92% for devices employing pure PEDOT:PSS and 82% for Supercaps based on 10Mel. Such a decrease in efficiency is due to an increase in the device series resistance due to the addition of Mel, as discussed hereafter for the EIS characterization. CV curves registered at different scan rates and GCD curves obtained at different charging currents for the investigated devices are shown in Fig. S10 (ESI†).
Concerning the energy-storage performance of SuperCaps, Fig. 8c presents the specific capacitance of 10Mel and PEDOT:PSS devices calculated from the GCD curves. As expected, higher values of charging current result in a drop of specific capacitance. At 100 mA g−1, SuperCaps employing pure PEDOT:PSS films exhibited 5.4 ± 0.2 F g−1, while 10Mel-based devices achieved 8.1 ± 0.1 F g−1, which corresponds to an increase of 50%. The Ragone plot (Fig. 8d) obtained from the GCD curves shows an increase in the specific energy and power for devices containing 10Mel. The highest energy and power values obtained were, respectively, 0.41 ± 0.02 W h kg−1 and 119 ± 14 W kg−1 for pure PEDOT:PSS SuperCaps, and 0.62 ± 0.01 W h kg−1 and 190 ± 6 W kg−1 for 10Mel devices. A comparison of performance of various PEDOT:PSS SuperCaps employing the same architecture is provided in Table S6 (ESI†).
To understand the contribution of Mel to the device performance, we carried out EIS measurements in SuperCap configuration. Fig. 8e illustrates the Nyquist plot for devices employing 10Mel and pure PEDOT:PSS. The respective impedance bode plot and specific capacitance vs. frequency curves are shown in Fig. S11 (ESI†). The Nyquist plot of devices based on pure PEDOT:PSS films and 10Mel show a similar behavior, viz. a high-frequency semicircle followed by a low-frequency tail. This behavior is typically found in pseudocapacitive systems75 and it can be represented by the adapted Randles circuit76 shown inset in Fig. 8e.
The simplest circuit that best fits the experimental data shown in Fig. 8e consist of a series resistance Rs that accounts for both the resistance of the bulk electrolyte and the electrode resistance (including the resistance between the active material and the stainless-steel current collector),77 two constant phase elements (CPE) associated to capacitive phenomena, and a charge transfer resistance (Rct) resistance. Rct is associated with the charging process of the pseudocapacitor through a charge transfer process between the electrolyte and the electrode.77 All circuit parameters are given in Table S7 (ESI†).
From Fig. 8c we observe that Rs increases from 3.2 ± 0.2 to 4.5 ± 0.3 Ω when 10Mel is used to replace pure PEDOT:PSS films. This indicates that, despite the observed capacitance increase in the device, the addition of Mel leads to a drop in the electrode conductivity, in agreement with the results shown in Fig. 4b. Concerning the capacitive effects, according to Sun and Chen78 the phase constant element CPE1 can be associated with a non-ideal electrical double layer formation at the electrode/electrolyte interface, while the element CPE2 is attributed to pseudocapacitive processes produced by diffusion of ions into the electrode. Finally, the Rct of devices employing a pure PEDOT:PSS film was found 137.7 ± 1.1 Ω, while for 10Mel SuperCaps Rct is 59.6 ± 16.6 for 10Mel, representing a decrease of ∼57%. This result indicates that the high ionic conduction of Mel facilitates the charge transfer between the electrode and the electrolyte, thus the main reason for the observed superior capacitance in 10Mel devices.
Finally, Fig. 8f shows the SuperCap life-cycle test for devices based on 10Mel. After 5000 cycles of GCD at 0.5 A g−1, the device capacitance slightly reduces to 93% of the initial value, while the Coulombic efficiency remained at 100%. This suggests that 10Mel SuperCaps possesses good stability, endurance and high-rate capability. The progressive decrease of the device capacitance can be attributed to the slight increase in series resistance, likely due to the onset of faradaic processes that occur in the 10Mel (see the current increase between 0.6 and 0.8V in Fig. 8a). Results concerning the life-cycle of SuperCaps employing films of pure PEDOT:PSS are shown in Fig. S12 (ESI†). All these results indicate the superior performance of SuperCaps when Mel is added to the PEDOT:PSS matrix.
4. Conclusions
Novel technologies demand new solutions that combine performance and low environmental impact. Aiming to meet the challenges of future sustainable electronics, here we investigated the production and application of a new organic mixed ionic electronic conductor (OMIEC) by employing water-soluble melanin (Mel) – a natural pigment with enhanced H+ transport properties. Mel was blended to benchmark OMIEC PEDOT:PSS to produce two different devices where OMIECs play a crucial role, namely organic electrochemical transistors (OECTs) for bioelectronics and supercapacitors for energy storage applications.OMIEC thin-films containing different Mel/PEDOT:PSS ratios were produced and thoroughly characterized by different methods. UV-Vis and FTIR spectroscopy revealed good miscibility of the two components, indicating no phase segregation between Mel and PEDOT:PSS. AFM measurements suggest that Mel particles coat the characteristic PEDOT:PSS fibers. I–V curves indicated the remarkable electronic conductivity of PEDOT:PSS is maintained up to the addition of 50 wt% of Mel. EIS measurements showed that Mel (10 wt%) improves the ion penetration into the channel, leading to higher volumetric capacitance in respect to pure PEDOT:PSS samples.
The improved ionic–electronic coupling observed in Mel/PEDOT:PSS blends resulted in increased performance of OECTs and SuperCaps, two devices where OMIECs play a crucial role. In OECTs, the addition of Mel (10 wt%) increased the device transconductance (gm) and mobility-capacitance (μOECTC*) product to 11 ± 3 mS and 136 ± 38 F cm−1 V−1 s−1, respectively, surpassing other strategies employing modifications of PEDOT:PSS. Regarding SuperCaps, the addition of Mel (10 wt%) increased the energy (0.62 ± 0.01 W h kg−1) and power 190 ± 6 W kg−1 densities, exhibiting far superior performance compared to devices solely based on PEDOT:PSS. Our results show that adding small amounts of bio-inspired organic ion conductors, such as Mel, in PEDOT:PSS can produce new and green OMIECs with improved ionic–electronic coupling. This strategy can be used with other natural or nature-inspired molecules to provide new functionalities to PEDOT:PSS or other conducting polymers, ultimately leading to novel devices for bioelectronics and sustainable technologies.
Author contributions
NLN: methodology, data acquisition, investigation, validation, writing original draft, writing – review & editing. JVML: methodology, data acquisition, investigation, writing – review & editing. RFO: writing – review & editing. CFOG: writing – review & editing.Conflicts of interest
The authors declare no conflict of interest.Acknowledgements
The authors acknowledge financial support from the Sao Paulo Research Foundation FAPESP (Grants: 2013/07296-2; 2020/12356-8; 2021/03379-7; 2021/06238-5; 2022/00410-3) and CNPq (301465/2022-3). R. F. O. acknowledges further support from INCT/INEO and SisNANO. We acknowledge N. B. Guerra for FTIR, M. H. Boratto and G. G. Malliaras for valuables inputs, and LNNano – AFM facility for the AFM measurements (proposal number: 20230160). We also thank Mariane P. Pereira (LNNano/Brazil) for the assistance with the LSCM imaging.References
- M. Cucchi, D. Parker, E. Stavrinidou, P. Gkoupidenis and H. Kleemann, Adv. Mater., 2023, 2209516 CrossRef CAS PubMed.
- H. Park, Y. Lee, N. Kim, D. Seo, G. Go and T. Lee, Adv. Mater., 2020, 32, 1903558 CrossRef CAS PubMed.
- T. Sarkar, K. Lieberth, A. Pavlou, T. Frank, V. Mailaender, I. McCulloch, P. W. M. Blom, F. Torricelli and P. Gkoupidenis, Nat. Electron., 2022, 5, 774–783 CrossRef.
- D. Moia, A. Giovannitti, A. A. Szumska, I. P. Maria, E. Rezasoltani, M. Sachs, M. Schnurr, P. R. F. Barnes, I. McCulloch and J. Nelson, Energy Environ. Sci., 2019, 12, 1349–1357 RSC.
- B. D. Paulsen, K. Tybrandt, E. Stavrinidou and J. Rivnay, Nat. Mater., 2020, 19, 13–26 CrossRef CAS PubMed.
- A. Marks, S. Griggs, N. Gasparini and M. Moser, Adv. Mater. Interfaces, 2022, 9, 2102039 CrossRef CAS.
- W. Ji, D. Wu, W. Tang, X. Xi, Y. Su, X. Guo and R. Liu, Sens. Actuators, B, 2020, 304, 127414 CrossRef CAS.
- S. Wang, X. Chen, C. Zhao, Y. Kong, B. Lin, Y. Wu, Z. Bi, Z. Xuan, T. Li, Y. Li, W. Zhang, E. Ma, Z. Wang and W. Ma, Nat. Electron., 2023, 6, 281–291 CrossRef CAS.
- J. Rivnay, S. Inal, A. Salleo, R. M. Owens, M. Berggren and G. G. Malliaras, Nat. Rev. Mater., 2018, 3, 17086 CrossRef CAS.
- L.-Z. Fan and J. Maier, Electrochem. Commun., 2006, 8, 937–940 CrossRef CAS.
- Y. Tian, T. Wang, Q. Zhu, X. Zhang, A. S. Ethiraj, W.-M. Geng and H.-Z. Geng, Nanomaterials, 2021, 11, 2067 CrossRef CAS PubMed.
- L. Hu, J. Song, X. Yin, Z. Su and Z. Li, Polymers, 2020, 12, 145 CrossRef CAS PubMed.
- M. H. Boratto, N. L. Nozella, R. A. Ramos, R. A. Da Silva and C. F. O. Graeff, APL Mater., 2020, 8, 121107 CrossRef CAS.
- T. Someya, Z. Bao and G. G. Malliaras, Nature, 2016, 540, 379–385 CrossRef CAS PubMed.
- Y. Yang, H. Deng and Q. Fu, Mater. Chem. Front., 2020, 4, 3130–3152 RSC.
- H. Shi, C. Liu, Q. Jiang and J. Xu, Adv. Electron. Mater., 2015, 1, 1500017 CrossRef.
- K. Sun, S. Zhang, P. Li, Y. Xia, X. Zhang, D. Du, F. H. Isikgor and J. Ouyang, J. Mater. Sci.: Mater. Electron., 2015, 26, 4438–4462 CrossRef CAS.
- S. Inal, G. G. Malliaras and J. Rivnay, Nat. Commun., 2017, 8, 1767 CrossRef PubMed.
- D. Ohayon, V. Druet and S. Inal, Chem. Soc. Rev., 2023, 52, 1001–1023 RSC.
- J. Rivnay, S. Inal, B. A. Collins, M. Sessolo, E. Stavrinidou, X. Strakosas, C. Tassone, D. M. Delongchamp and G. G. Malliaras, Nat. Commun., 2016, 7, 11287 CrossRef PubMed.
- M. Bianchi, S. Carli, M. Di Lauro, M. Prato, M. Murgia, L. Fadiga and F. Biscarini, J. Mater. Chem. C, 2020, 8, 11252–11262 RSC.
- S. Yamamoto and G. G. Malliaras, ACS Appl. Electron. Mater., 2020, 2, 2224–2228 CrossRef CAS.
- J. V. Paulin and C. F. O. Graeff, J. Mater. Chem. C, 2021, 9, 14514–14531 RSC.
- M. Ambrico, P. F. Ambrico, T. Ligonzo, A. Cardone, S. R. Cicco, M. d’Ischia and G. M. Farinola, J. Mater. Chem. C, 2015, 3, 6413–6423 RSC.
- P. Meredith and T. Sarna, Pigm. Cell Res., 2006, 19, 572–594 CrossRef CAS PubMed.
- M. Sheliakina, A. B. Mostert and P. Meredith, Adv. Funct. Mater., 2018, 28, 1805514 CrossRef.
- P. Meredith and J. Riesz, Photochem. Photobiol., 2007, 79, 211–216 CrossRef.
- L. Panzella, G. Gentile, G. D’Errico, N. F. Della Vecchia, M. E. Errico, A. Napolitano, C. Carfagna and M. d’Ischia, Angew. Chem., Int. Ed., 2013, 52, 12684–12687 CrossRef CAS PubMed.
- L. Hong and J. D. Simon, J. Phys. Chem. B, 2007, 111, 7938–7947 CrossRef CAS PubMed.
- M. Reali, A. Gouda, J. Bellemare, D. Ménard, J.-M. Nunzi, F. Soavi and C. Santato, ACS Appl. Bio Mater., 2020, 3, 5244–5252 CrossRef CAS PubMed.
- C. J. Bettinger, J. P. Bruggeman, A. Misra, J. T. Borenstein and R. Langer, Biomaterials, 2009, 30, 3050–3057 CrossRef CAS PubMed.
- M. Piacenti-Silva, A. A. Matos, J. V. Paulin, R. A. da S. Alavarce, R. C. de Oliveira and C. F. Graeff, Polym. Int., 2016, 65, 1347–1354 CrossRef CAS.
- M. J. Han and D. K. Yoon, Engineering, 2021, 7, 564–580 CrossRef.
- M. J. Tan, C. Owh, P. L. Chee, A. K. K. Kyaw, D. Kai and X. J. Loh, J. Mater. Chem. C, 2016, 4, 5531–5558 RSC.
- H.-B. Wang, H.-D. Zhang, L.-L. Xu, T. Gan, K.-J. Huang and Y.-M. Liu, J. Solid State Electrochem., 2014, 18, 2435–2442 CrossRef CAS.
- T.-F. Wu, B.-H. Wee and J.-D. Hong, Adv. Mater. Interfaces, 2015, 2, 1500203 CrossRef.
- E. Di Mauro, O. Carpentier, S. I. Yáñez Sánchez, N. Ignoumba Ignoumba, M. Lalancette-Jean, J. Lefebvre, S. Zhang, C. F. O. Graeff, F. Cicoira and C. Santato, J. Mater. Chem. C, 2016, 4, 9544–9553 RSC.
- M. Ambrico, P. F. Ambrico, T. Ligonzo, A. Cardone, S. R. Cicco, A. Lavizzera, V. Augelli and G. M. Farinola, Appl. Phys. Lett., 2012, 100, 253702 CrossRef.
- P. Kumar, E. Di Mauro, S. Zhang, A. Pezzella, F. Soavi, C. Santato and F. Cicoira, J. Mater. Chem. C, 2016, 4, 9516–9525 RSC.
- J. V. Paulin, S. L. Fernandes and C. F. O. Graeff, Electrochem, 2021, 2, 264–273 CrossRef CAS.
- K. A. Motovilov, V. Grinenko, M. Savinov, Z. V. Gagkaeva, L. S. Kadyrov, A. A. Pronin, Z. V. Bedran, E. S. Zhukova, A. B. Mostert and B. P. Gorshunov, RSC Adv., 2019, 9, 3857–3867 RSC.
- J. V. Paulin, M. P. Pereira, B. A. Bregadiolli, J. P. Cachaneski-Lopes, C. F. O. Graeff, A. Batagin-Neto and C. C. B. Bufon, J. Mater. Chem. C, 2023, 11, 6107–6118 RSC.
- S. R. Cicco, M. Ambrico, P. F. Ambrico, M. M. Talamo, A. Cardone, T. Ligonzo, R. Di Mundo, C. Giannini, T. Sibillano, G. M. Farinola, P. Manini, A. Napolitano, V. Criscuolo and M. d’Ischia, J. Mater. Chem. C, 2015, 3, 2810–2816 RSC.
- J. V. Paulin, A. G. Veiga, Y. Garcia-Basabe, M. L. M. Rocco and C. F. Graeff, Polym. Int., 2018, 67, 550–556 CrossRef CAS.
- J. Wünsche, F. Cicoira, C. F. O. Graeff and C. Santato, J. Mater. Chem. B, 2013, 1, 3836 RSC.
- E. S. Bronze-Uhle, J. V. Paulin, M. Piacenti-Silva, C. Battocchio, M. L. M. Rocco and C. F. de O. Graeff, Polym. Int., 2016, 65, 1339–1346 CrossRef CAS.
- M. H. Boratto, J. V. M. Lima, G. G. Malliaras and C. F. O. Graeff, J. Energy Storage, 2023, 63, 107095 CrossRef.
- D. C. Sun and D. S. Sun, Mater. Chem. Phys., 2009, 118, 288–292 CrossRef CAS.
- K. L. Woon, W. S. Wong, N. Chanlek, H. Nakajima, S. Tunmee, V. S. Lee, A. Ariffin and P. Songsiriritthigul, RSC Adv., 2020, 10, 17673–17680 RSC.
- A. A. Kozlova, R. A. Verkhovskii, A. V. Ermakov and D. N. Bratashov, J. Fluoresc., 2020, 30, 1483–1489 CrossRef CAS PubMed.
- C. Grieco, F. R. Kohl, A. T. Hanes and B. Kohler, Nat. Commun., 2020, 11, 4569 CrossRef CAS PubMed.
- A. Khan, R. K. Jain, P. Banerjee, K. A. Alamry, B. Ghosh, Inamuddin and A. M. Asiri, J. Reinf. Plast. Compos., 2021, 40, 87–102 CrossRef CAS.
- N. Kanjana, W. Maiaugree, P. Laokul, I. Chaiya, T. Lunnoo, P. Wongjom, Y. Infahsaeng, B. Thongdang and V. Amornkitbamrung, Sci. Rep., 2023, 13, 6012 CrossRef CAS PubMed.
- S. Xiong, L. Zhang and X. Lu, Polym. Bull., 2013, 70, 237–247 CrossRef CAS.
- S. Mohanapriya, K. K. Tintula, S. D. Bhat, S. Pitchumani and P. Sridhar, Bull. Mater. Sci., 2012, 35, 297–303 CrossRef CAS.
- X. Guo, S. Chen, Y. Hu, G. Li, N. Liao, X. Ye, D. Liu and C. Xue, J. Food Sci. Technol., 2014, 51, 3680–3690 CrossRef CAS PubMed.
- J. V. Paulin, A. P. Coleone, A. Batagin-Neto, G. Burwell, P. Meredith, C. F. O. Graeff and A. B. Mostert, J. Mater. Chem. C, 2021, 9, 8345–8358 RSC.
- S. L. Bravina, P. M. Lutsyk, A. B. Verbitsky and N. V. Morozovsky, Mater. Res. Bull., 2016, 80, 230–236 CrossRef CAS.
- R. F. de Oliveira, L. Merces, T. P. Vello and C. C. Bof Bufon, Org. Electron., 2016, 31, 217–226 CrossRef.
- K. A. Motovilov, V. Grinenko, M. Savinov, Z. V. Gagkaeva, L. S. Kadyrov, A. A. Pronin, Z. V. Bedran, E. S. Zhukova, A. B. Mostert and B. P. Gorshunov, RSC Adv., 2019, 9, 3857–3867 RSC.
- M. d’Ischia, A. Napolitano, A. Pezzella, P. Meredith and M. Buehler, Angew. Chem., Int. Ed., 2020, 59, 11196–11205 CrossRef PubMed.
- J. T. Friedlein, R. R. McLeod and J. Rivnay, Org. Electron., 2018, 63, 398–414 CrossRef CAS.
- J. Rivnay, S. Inal, A. Salleo, R. M. Owens, M. Berggren and G. G. Malliaras, Nat. Rev. Mater., 2018, 3, 17086 CrossRef CAS.
- S. Yamamoto, A. G. Polyravas, S. Han and G. G. Malliaras, Adv. Electron. Mater., 2022, 8, 2101186 CrossRef CAS.
- Y. J. Jo, S. Y. Kim, J. H. Hyun, B. Park, S. Choy, G. R. Koirala and T. Kim, npj Flexible Electron., 2022, 6, 31 CrossRef CAS.
- X. Wu, A. Surendran, J. Ko, O. Filonik, E. M. Herzig, P. Müller-Buschbaum and W. L. Leong, Adv. Mater., 2019, 31, 1805544 CrossRef PubMed.
- X. Ji, B. D. Paulsen, G. K. K. Chik, R. Wu, Y. Yin, P. K. L. Chan and J. Rivnay, Nat. Commun., 2021, 12, 2480 CrossRef CAS PubMed.
- R. Colucci, H. F. de, P. Barbosa, F. Günther, P. Cavassin and G. C. Faria, Flexible Printed Electron., 2020, 5, 013001 CrossRef CAS.
- V. Preziosi, M. Barra, G. Tomaiuolo, P. D’Angelo, S. L. Marasso, A. Verna, M. Cocuzza, A. Cassinese and S. Guido, J. Mater. Chem. B, 2022, 10, 87–95 RSC.
- S. Yamamoto and G. G. Malliaras, ACS Appl. Electron. Mater., 2020, 2, 2224–2228 CrossRef CAS.
- W. Xie, E. Pakdel, Y. Liang, Y. J. Kim, D. Liu, L. Sun and X. Wang, Biomacromolecules, 2019, 20, 4312–4331 CrossRef CAS PubMed.
- A. B. Mostert, S. B. Rienecker, M. Sheliakina, P. Zierep, G. R. Hanson, J. R. Harmer, G. Schenk and P. Meredith, J. Mater. Chem. B, 2020, 8, 8050–8060 RSC.
- J. Liu, J. Wang, C. Xu, H. Jiang, C. Li, L. Zhang, J. Lin and Z. X. Shen, Adv. Sci., 2018, 5, 1700322 CrossRef PubMed.
- S. Fleischmann, J. B. Mitchell, R. Wang, C. Zhan, D. Jiang, V. Presser and V. Augustyn, Chem. Rev., 2020, 120, 6738–6782 CrossRef CAS PubMed.
- T. S. Mathis, N. Kurra, X. Wang, D. Pinto, P. Simon and Y. Gogotsi, Adv. Energy Mater., 2019, 9, 1902007 CrossRef CAS.
- J. E. B. Randles, Discuss. Faraday Soc., 1947, 1, 11 RSC.
- A. Noori, M. F. El-Kady, M. S. Rahmanifar, R. B. Kaner and M. F. Mousavi, Chem. Soc. Rev., 2019, 48, 1272–1341 RSC.
- W. Sun and X. Chen, J. Power Sources, 2009, 193, 924–929 CrossRef CAS.
Footnote |
| † Electronic supplementary information (ESI) available. See DOI: https://doi.org/10.1039/d3ma00573a |
| This journal is © The Royal Society of Chemistry 2023 |

