DOI:
10.1039/D3MA00392B
(Paper)
Mater. Adv., 2023,
4, 4744-4754
The effects of double-site yttria-doping on the structures and dielectric properties of (Ca,Sr)z(Zr,Ti)O3−δ perovskite ceramics
Received
11th July 2023
, Accepted 1st September 2023
First published on 7th September 2023
Abstract
Double-site yttria-doped (Ca,Sr)z(Zr,Ti)O3−δ (CSZTY) ceramics were synthesized using the solid-state reaction method. The correlation among the crystal structure, microstructure and microwave dielectric properties was investigated. Their structures were characterized by X-ray diffraction (XRD), transmission electron microscopy (TEM) and Raman spectroscopy. CSZTY ceramics have a perovskite structure with coexisting orthorhombic and cubic phases; the main phase is the orthorhombic Pnma phase. Rietveld refinement, atomic-resolved high angle annular dark field (HAADF) STEM images and energy dispersive spectroscopy (EDS) for elemental mapping revealed that Y3+ cations occupy both A and B-sites in the perovskite structure (ABO3). Upon increasing Y3+ cations distributed on A and B-sites in CSZT ceramics, the factor of tolerance t decreases and the tilting angle of BO6 octahedra and the unit-cell volume increase. Superlattice reflections appearing along the [100]c, [110]c and [012]c zone axes are observed in the selected area electron diffraction (SAED) patterns as a result of cell doubling caused by the octahedral tilt transitions. Raman spectra show that upon increasing the doping amount of yttria, before and after 450 cm−1, the frequencies of some vibrational modes correlated with B ion movement in the BO6 octahedron blue shift and red shift, respectively. Upon increasing the octahedral tilting angle, the polarizability of the ions produces corresponding changes, the dielectric constant εr decreases, the value of Q × f increases, and the temperature coefficient of dielectric permittivity τc increases while the resonant frequency temperature coefficient τf decreases. At x = 0.15, the CSZTY ceramics show optimized microwave dielectric properties: εr = 29.8, Q × f = 23![[thin space (1/6-em)]](https://www.rsc.org/images/entities/char_2009.gif) 528 GHz, τc = 0.50 ppm °C−1, and τf = −4.25 ppm °C−1. This work provides a method to optimize the microwave dielectric properties of perovskite structure materials.
528 GHz, τc = 0.50 ppm °C−1, and τf = −4.25 ppm °C−1. This work provides a method to optimize the microwave dielectric properties of perovskite structure materials.
1. Introduction
Microwave dielectric ceramics are widely used in wireless communication systems such as dielectric resonators, filters, antennas, and microwave substrates. With the expansion of the microwave application range, microwave dielectric ceramic materials which meet the requirements of special frequency bands are urgently needed. At present, materials with εr of 30 for integrated dielectric waveguide circuits of millimeter wave and submillimeter wave circuits are becoming a research hotspot in the world.1–3 In order to meet the application requirements, microwave ceramics need to possess a combination of suitable dielectric constant εr, high quality factor Q × f, and near-zero temperature coefficient of dielectric permittivity τc or near-zero resonant frequency temperature coefficient τf.4–6 Recently, perovskite zirconate-based complex oxides have become attractive microwave dielectric ceramics due to their excellent chemical and thermal stabilities and outstanding dielectric properties, also their inertia to the reductive atmosphere.7–10 The CaZrO3 ceramic exhibits a dielectric constant εr of 27, a relatively high-quality factor Q × f of 16543 GHz, a high insulating resistivity ρ of 1012 Ω cm, and a temperature coefficient of resonant frequency τf of −19.98 ppm °C−1.8–10 The SrZrO3 ceramic possesses a dielectric constant εr of 30, a relatively high-quality factor Q × f of 13600 GHz, and a temperature coefficient of resonant frequency τf of −60 ppm °C−1.8 It was found that potentially useful, temperature-stable ceramics can be obtained by forming solid solutions in complex perovskites. Because the size of Sr2+ is close to that of Ca2+, calcium zirconate doped with strontium is expected to be a homogeneous and stable solid solution which presents more interesting characteristics. T. Yamaguchi et al. found that the Ca, Sr-rich composites have a higher quality factor than SrZrO3 or CaZrO3.8 The change in the Ca/Sr ratio can affect the crystalline phase and the dielectric properties of the (CaxSr(1−x))ZrO3 ceramics.11 The melting temperature of CaZrO3 (Tm = 2340 °C) is lower than that of SrZrO3 (Tm = 2750 °C) and the Ca2+ radius (1.34 Å) is smaller than that of Sr2+ (1.44 Å), and the lattice strain will be reduced when Ca is substituted to the Sr-site in the lattice. Lower sintering temperature can be obtained, and the grain size in the (Ca,Sr)(Zr,Ti)O3 ceramics increases significantly as the Ca/Sr ratio increases. However, a small amount of impurity phase of ZrO2 or CaZr4O9 was observed in stoichiometric ABO3 structured zirconate ceramics with an increasing Ca/Sr ratio, which deteriorates the microwave dielectric properties.9–13 Therefore, how to eliminate the impurity phase and improve the microwave dielectric properties of the materials is of high importance. Recently, we found that the impurity phase can be eliminated by regulating the nonstoichiometric ratio in the (Sr0.7Ca0.3)z(Zr0.95Ti0.05)O3 ceramics.13 The impurity phase was reduced from 3.3% (z = 0.98) to 0 (z = 1.02, 1.04). Meanwhile, the τf or τc value is also an important indicator of microwave dielectric ceramics which determines whether a microwave device can work stably. Near zero τf or τc can be obtained in the zirconate systems by doping a tiny amount of Ti4+, but the dielectric constant also increased accordingly.10,11,13,14 How to design materials with εr of 30, a higher value of Q × f, and near zero τf or τc simultaneously has become a critical issue.8–14 It is also necessary to establish the relationship between the microstructure, crystal structure and microwave dielectric properties of perovskite ceramics to optimize their microwave dielectric properties.15–19
To date, no literature reported the crystal structure dependence of the microstructure and microwave dielectric properties of the same element double substituted at the A-site and B-site in CSZT perovskite ceramics. In this paper, double-site yttria-doped (Ca,Sr)z(Zr,Ti)O3−δ (CSZTY) perovskite ceramics were synthesized via the conventional solid-state reaction method. The effects of double-site substitution of the trivalent cation on the crystal structure, microstructure and microwave dielectric properties were investigated. The introduction of trivalent cation Y3+ decreases the dielectric constant, improves the quality factor Q × f value and decreases the temperature coefficient of resonant frequency of the CSZT perovskite ceramics. Meanwhile, the relationship between the structures and microwave dielectric properties was investigated in detail. The purpose of adding little magnesium oxide is to promote the densification of ceramics due to the stress produced by the difference of the thermal expansion coefficients of MgO (13.6 × 10⁻⁶ °C−1) and CaZrO3 (5–6 × 10⁻⁶ °C−1) during annealing treatment. In order to simplify the difficulty of the analysis, the role of Mg doping is ignored in this paper.
2. Experimental
Double-site yttria-doped ceramics were synthesized via the conventional solid-state reaction method. High-purity raw powders of SrCO3 (99.98%), CaCO3 (99.66%), ZrO2 (99.99%), and TiO2 (99.85%, rutile phase) were first weighted according to the stoichiometric ratio (Ca0.7Sr0.3)1.04(Zr0.95Ti0.05)O3 and then planet ball milled with zirconia media in deionized water for 6 h. After drying, the mixture was synthesized at 1150 °C in the air for 4 h. Then, raw powders of MgO (98.5%) and Y2O3 (99.99%) and the synthesized powder of (Ca0.7Sr0.3)1.04(Zr0.95Ti0.05) O3−δ (CSZT) were weighted according to their stoichiometric ratio (Ca0.7Sr0.3)1.04(Zr0.95Ti0.05)O3−δ + 0.02MgO + xY2O3 (CSZTY), here, x = 0.01, 0.025, 0.05, 0.10, 0.15, 0.20. And again, the mixtures were planet ball milled with zirconia media in deionized water for 6 h. After drying, the mixtures were sintered at 1150 °C in the air for 4 h and ground using a nanogrinding machine for 10 h obtaining synthetic powder with a particle size (D50) and size distribution ((D90–D10)/D50) of 400 nm and 1.0, respectively. The dried powders were then added with polyvinyl butyral (PVB 5 wt%) as a binder and pressed into Φ13 × 2 mm pellets and Φ13 × 10 mm cylinders at a pressure of 200 MPa. Finally, these pellets and cylinders were sintered at 1420 °C for 4 hours. The sintered pellets were polished to 0.5 mm thickness samples and coated with silver for a capacitance test. The cylinders were machined into Φ10 × 5.5 mm samples by plane and outer edge processing for a microwave performance test.
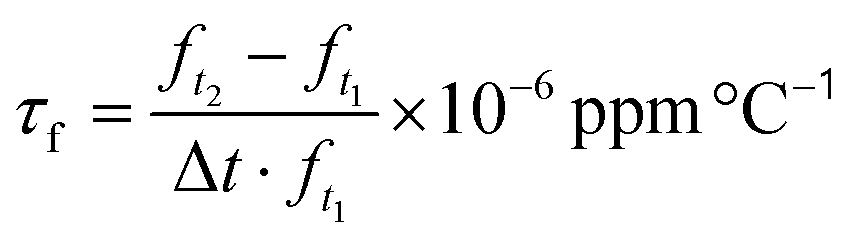
The crystalline structures of the ceramics were determined using an X-ray diffractometer (XRD, CuKα1, λ = 1.54056 Å, 40 kV 40 mA, Bruker D8 Advance) in the range of 10–90° with a step size of 0.02° and a step time of 1.5 s. Rietveld refinements were performed using the TOPAS software. The microstructures and chemical elements were analyzed using a field emission scanning electron microscope (FESEM, Magellan400, USA) with an energy dispersive X-ray spectrometer (EDS), a transmission electron microscope (TEM, JEM-2100F, JEOL) with an energy dispersive X-ray spectrometer (EDS) and a high-resolved scanning transmission electron microscope (HRSTEM, Hitachi HF 5000) combined with an EDS. For FESEM, Magellan400, resolution is 0.9 nm. For TEM, JEM-2100F, point resolution is 0.19 nm and line resolution is 0.14 nm. For HRSTEM, Hitachi HF 5000, point resolution is 0.23 nm, line resolution is 0.13 nm, and the STEM resolution is 78 pm. The EDS analysis is carried out for minerals with atomic numbers greater than 11. The relative error of quantitative analysis is as follows: for the mass fraction greater than 20%, the relative error is within 5%; for the mass fraction ranging from 3% to 20%, the relative error is within 10%; for the mass fraction ranging from 1% to 3%, the relative error is within 20%; for the mass fraction ranging from 0.5% to 1%, the relative error is within 30%; and for the mass fraction ranging from 0.1% to 0.5%, the relative error is within 50%. The specimens for TEM analysis were prepared by mechanical thinning and finally Ar+ milling in a Gatan Precision Ion Polishing System. Raman spectra were measured using the Renishaw in via Reflex Raman spectrometer with an excitation laser of 532 nm. The spectral resolution is within 0.025 nm, and the repetition rate is within ±0.02 cm−1. A vector network analyzer (Agilent E8362B) and a temperature chamber were used to measure the microwave dielectric properties of the samples. The quality factor Q × f and dielectric constant εr at resonant frequency were estimated using the TE01δ mode dielectric resonator method. The measurement range of the microwave dielectric constant is 5–100, and the relative error is within 1%. The measurement range of the microwave loss is 2 × 10⁻⁴–6 × 10⁻³, and the relative error is within ∼5%. The resonant frequency temperature coefficient τf was calculated using the following equation:
| |  | (1) |
where
ft2 and
ft1 are the resonant frequencies at the measuring temperatures of 85 °C and 25 °C, respectively, and the relative error is within ∼5%.
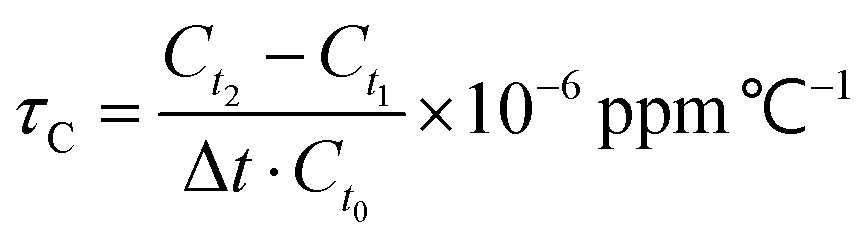
The temperature coefficient of dielectric permittivity τC was evaluated using a broad-band dielectric spectrometer (Novocontrol Technologies, Germany) at 1 MHz. The value of τC was calculated using the following equation:
| |  | (2) |
where
Ct2 and
Ct1 re the permittivity at the measuring temperatures of −55 °C and 125 °C, respectively, and the relative error is within ∼5%.
3. Results and discussion
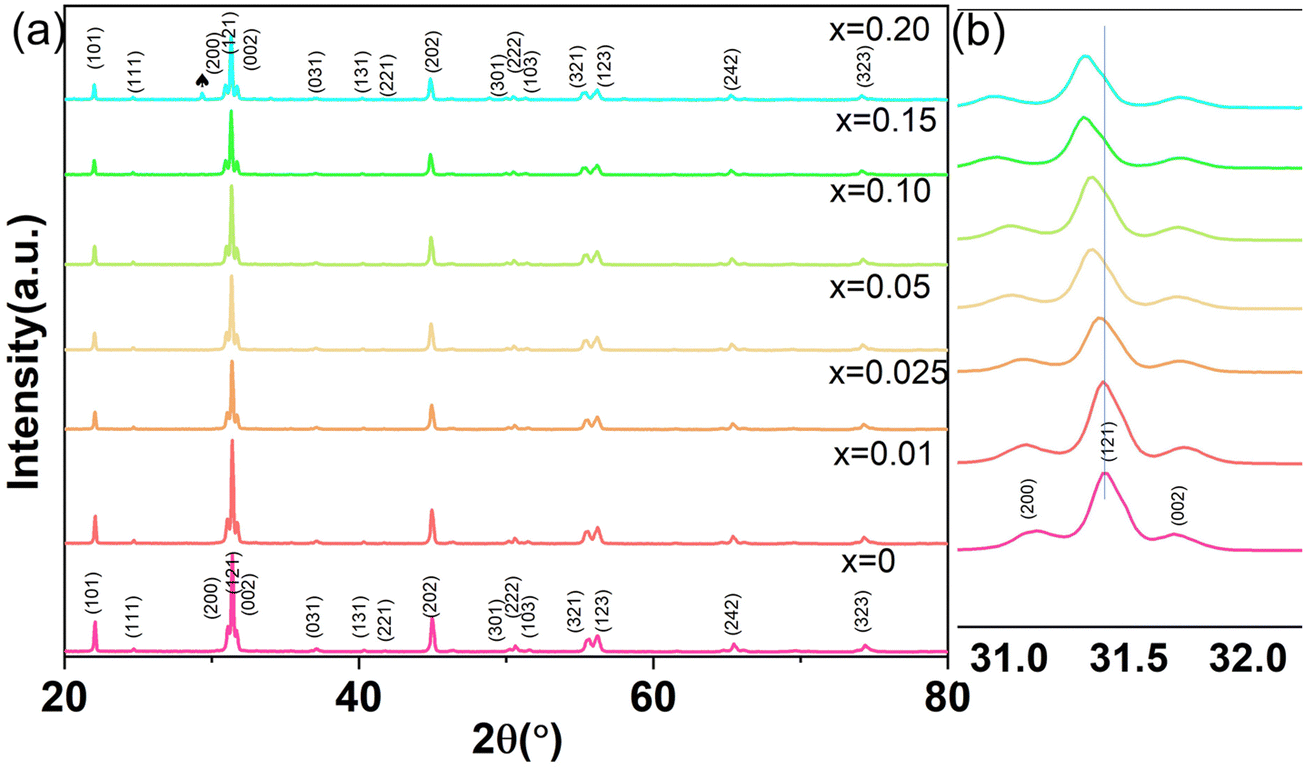
Fig. 1(a) shows the XRD patterns of CSZT and CSZTY (x = 0.01, 0.05, 0.10, 0.15, and 0.20) ceramics sintered at 1420 °C for 4 h. Partially enlarged drawings of the XRD patterns in the 2θ range from 31.0° to 32.0° are shown in Fig. 1(b). The XRD patterns of CSZT and CSZTY ceramics illustrate that the main phase is an orthorhombic (Pnma) perovskite structure, which can be indexed to the standard XRD patterns of SrZrO3 (JSPDS: 44-0161) and CaZrO3 (JSPDS: 35-0645). From the patterns of CSZT and CSZTY (x = 0.01, 0.05, 0.10, and 0.15), no apparent peaks corresponding to impurity phases are observed, indicating that continuous perovskite structure solid solutions have been successfully formed. Upon increasing the doping amount of Y2O3, an impurity phase, cubic Y2O3, was observed in CSZTY (x = 0.20), which was marked with a black heart symbol. From the partial enlarged drawing of the XRD patterns in Fig. 1(b), it can be seen that as x increases, the main peak (121) shifts to a lower angle, indicating the increase of the unit cell volume. This trend also indicates that CSZTY ceramics tend to form continuous solid solution systems.
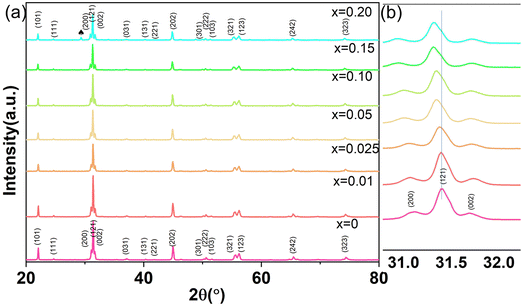 |
| | Fig. 1 (a) The XRD patterns of CSZT and CSZTY (x = 0.01, 0.05, 0.10, 0.15, and 0.20) ceramics. At x = 0.20, the XRD pattern shows a small amount of Y2O3 which is marked with a black heart symbol. (b) Partial enlarged drawing of the XRD patterns in the 2θ range from 31.0° to 32.0°. | |
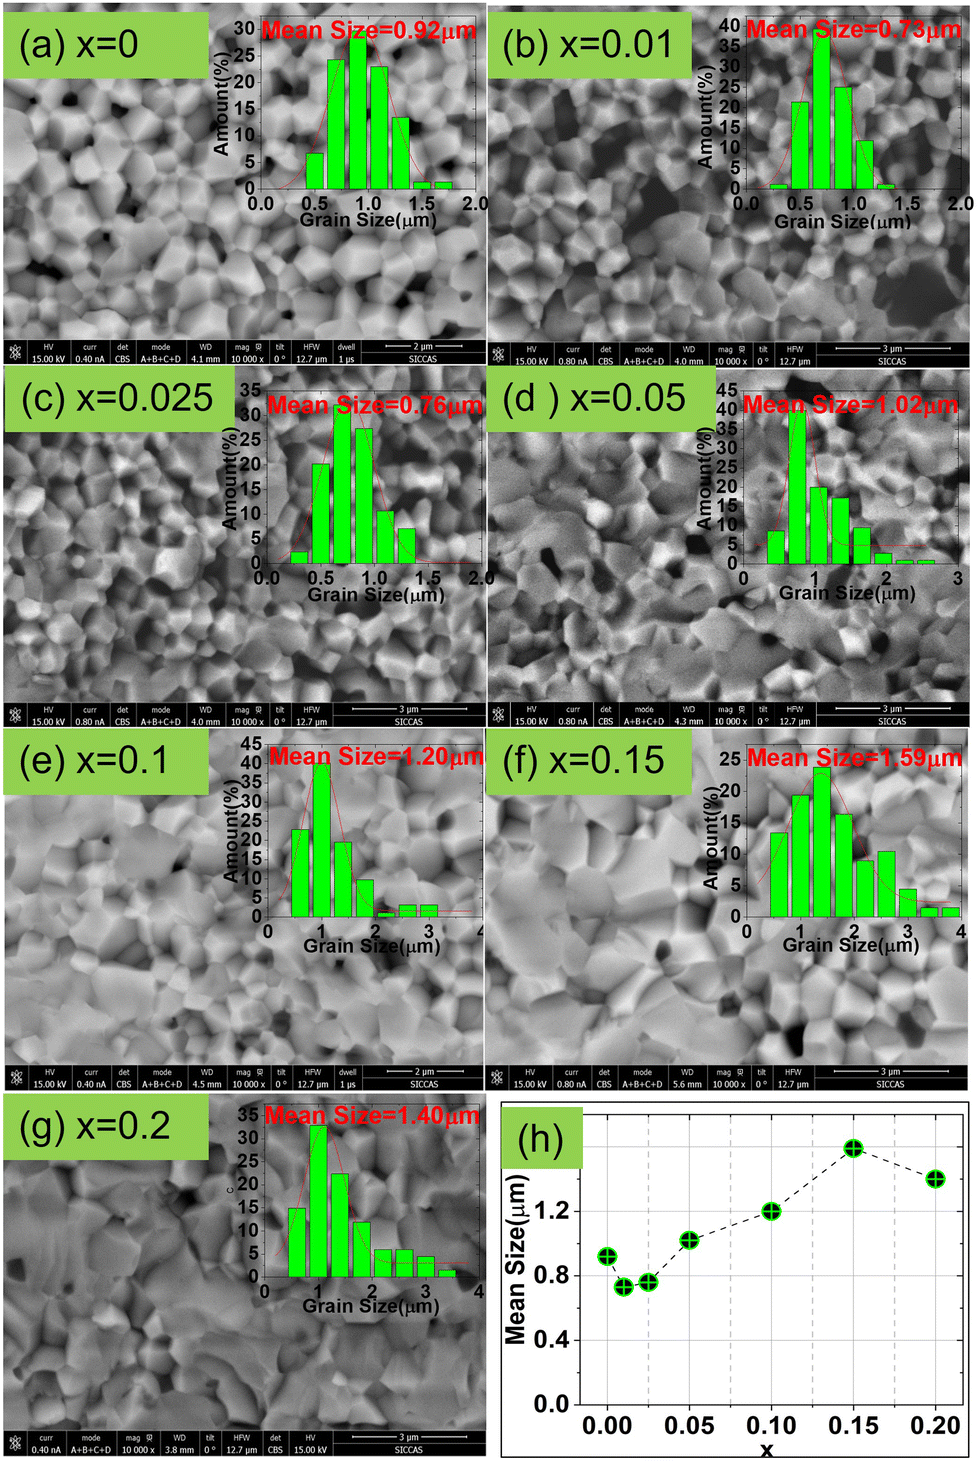
Fig. 2 shows the cross-sectional backscattering electron (BSE) images of the CSZT and CSZTY (x = 0.01, 0.05, 0.10, 0.15, 0.20) ceramics at 10000x magnification obtained using a field emission scanning electron microscope (FESEM). It can be seen that for the CSZT ceramic, the cross-section exhibits an intergranular fracture, the grain boundaries are clear, and the grain sizes are uniform. With the doping of 0 to 0.025 of Y2O3, the mean grain sizes become smaller, which may be attributed to two reasons: (1) the MgO phase at the grain boundary which can effectively reduce the grain boundary movement rate and inhibit the rapid growth of grains; (2) the stress generated by the thermal expansion difference between the MgO phase (∼13.6 × 10⁻⁶ °C−1) and the CSZTY phase (∼5–6 × 10⁻⁶ °C−1) during the sintering process. With the continuous doping of Y2O3, the proportion of MgO in stoichiometry is reduced; there was a noteworthy change in the microstructure. The cross-section of CSZTY ceramics exhibits a more trans granular fracture, the grain boundaries become unclear, the grain growth is promoted greatly and the small grains gradually disappear, which indicate that the continuous doping of Y2O3 increases the surface energy of the grains, promotes grain boundary migration, and increases the degree of ceramic densification. But, at x = 0.20, the mean grain size suddenly gets smaller. It is due to the forming of impurity phase Y2O3 which blocks the movement of the crystal boundaries resulting in fine grains.
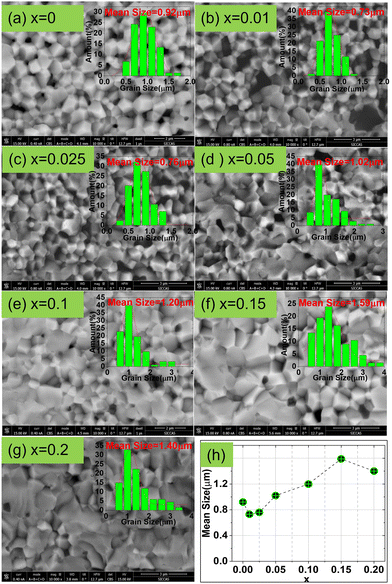 |
| | Fig. 2 (a)–(g) Cross-sectional SEM-BSE images at 10000x magnification of CSZT and CSZTY (x = 0.01, 0.025, 0.05, 0.10, 0.15, and 0.20) ceramics. The insets are the corresponding grain size distribution diagram. (h) Diagram of the mean grain sizes of CSZTY ceramics with different x. | |
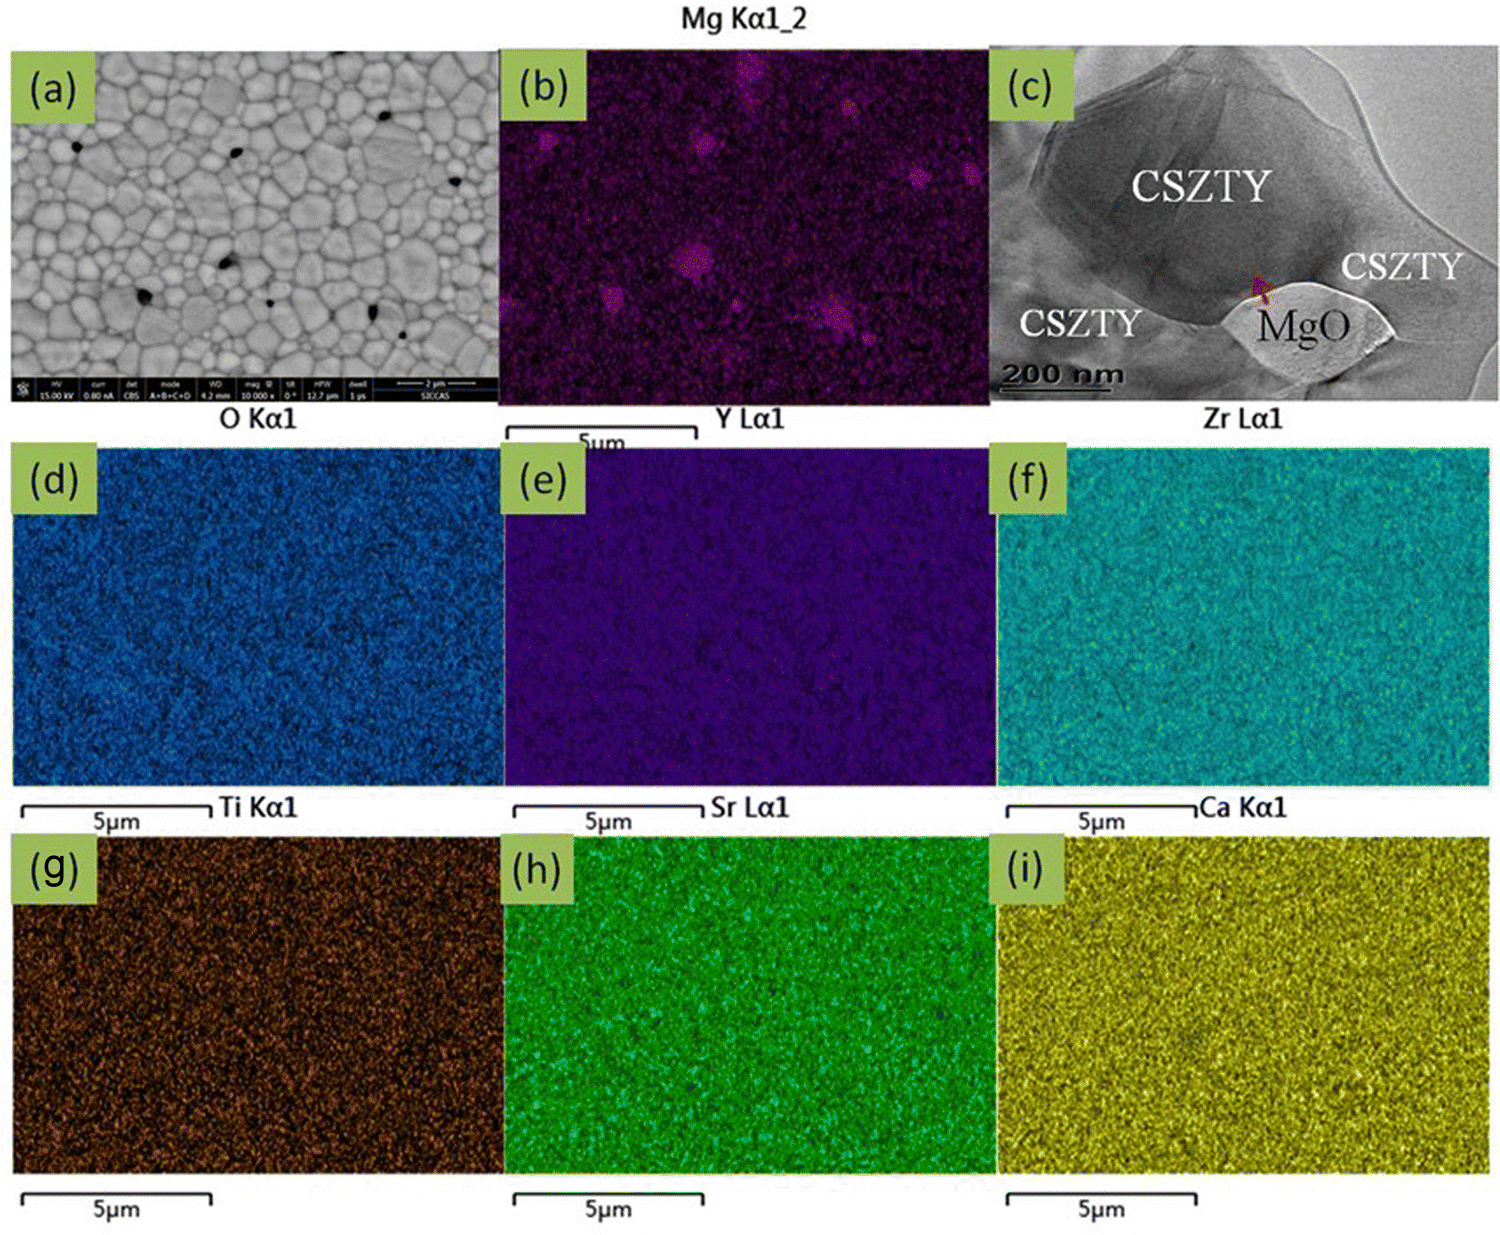
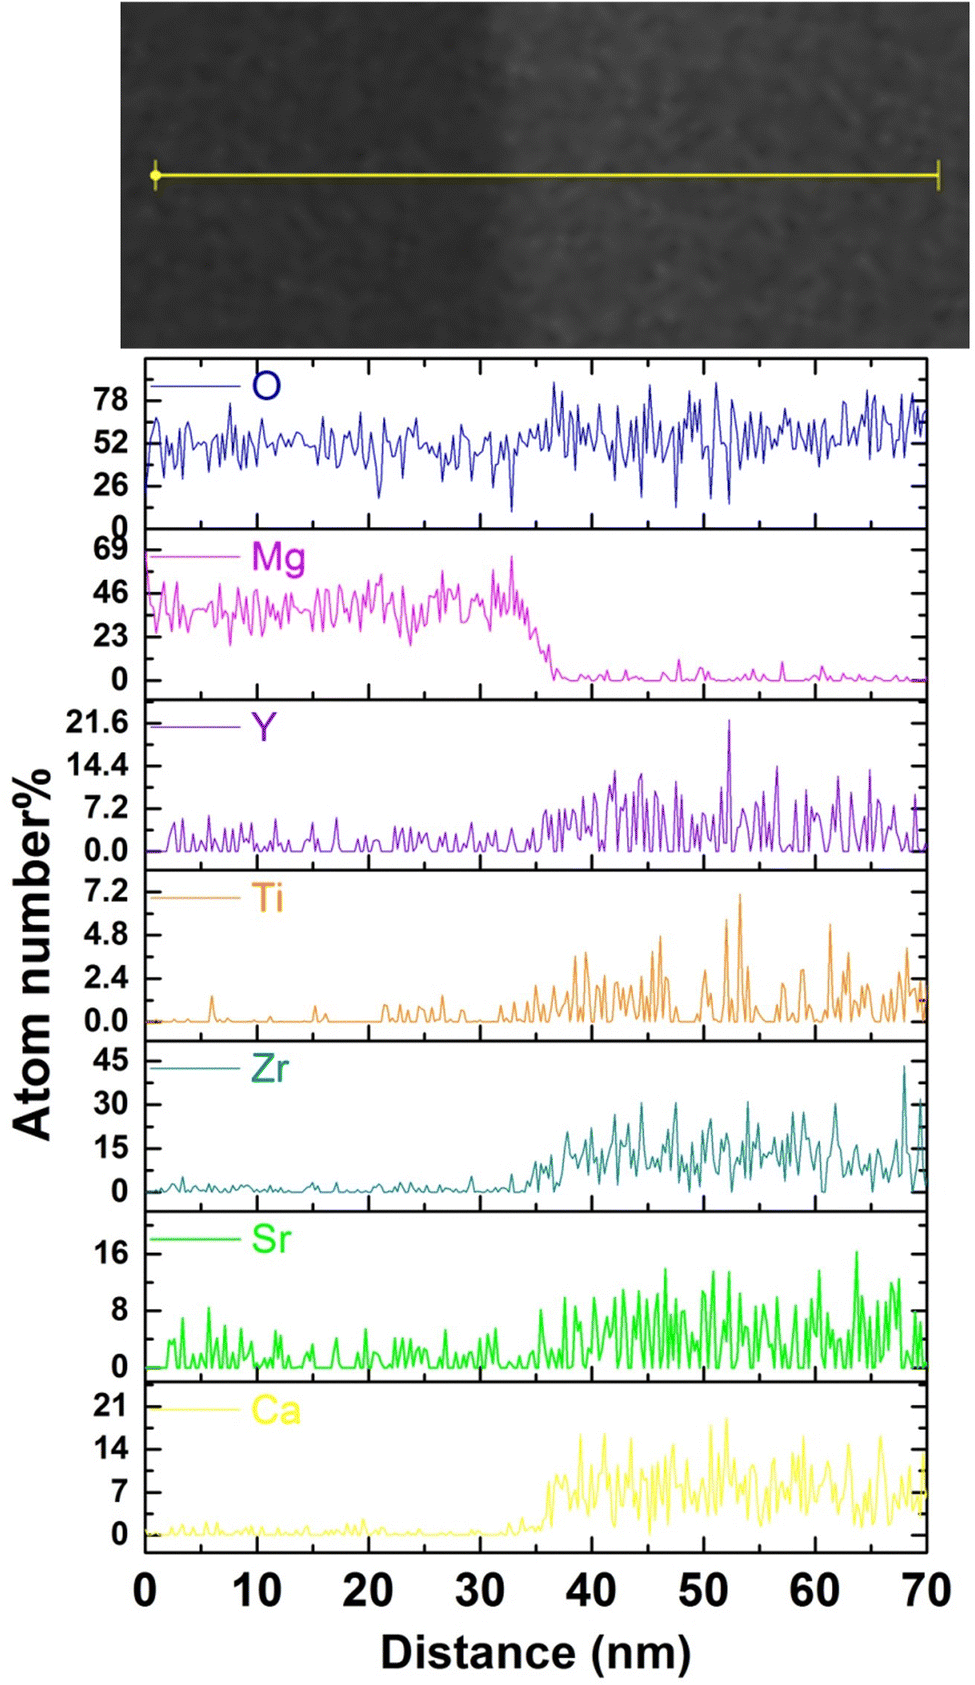
Fig. 3(a) shows the cross-sectional SEM-BSE image of the CSZTY (x = 0.1) ceramic at 10000x magnification. The sample was surface polished and heat treated at 1400 °C for 1 h. Fig. 3(b) and (d–j) are the corresponding EDS elemental maps. Two differently colored grains can be clearly seen in Fig. 3(a). The smaller black grains are tightly embedded at the gray grain boundaries. Based on the corresponding EDS elemental mapping, the components of black grains are the Mg element and O element. The components of gray grains are Y, Zr, Ti, Sr, Ca, and O elements which are evenly distributed without agglomeration. Fig. 3(c) shows the TEM-BSE image of the CSZTY (x = 0.1) ceramic. Fig. 4 shows the EDS line scanning of O, Mg, Y, Ti, Zr, Sr, and Ca elements from the MgO grain to the CSZTY grain (red arrow region in Fig. 3(c)). On the grain boundary, no obvious element diffusion was observed.
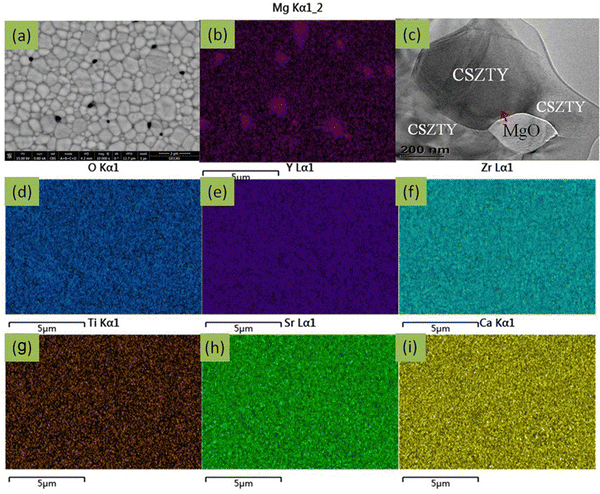 |
| | Fig. 3 (a) Cross-sectional SEM-BSE image of the CSZTY (x = 0.1) ceramic at 10000x magnification. The sample was surface polished and heat treated at 1400 °C for 1 h. (b) and (d)–(i). The corresponding EDS elemental mapping images of Mg, O, Y, Zr, Ti, Sr, and Ca. (c) TEM-BSE image of the CSZTY (x = 0.1) ceramic in the MgO and CSZTY grain coexisting region. | |
 |
| | Fig. 4 The EDS line scanning of O, Mg, Y, Ti, Zr, Sr, and Ca elements from the MgO grain to CSZTY grain (red arrow region in Fig. 3(c)). | |
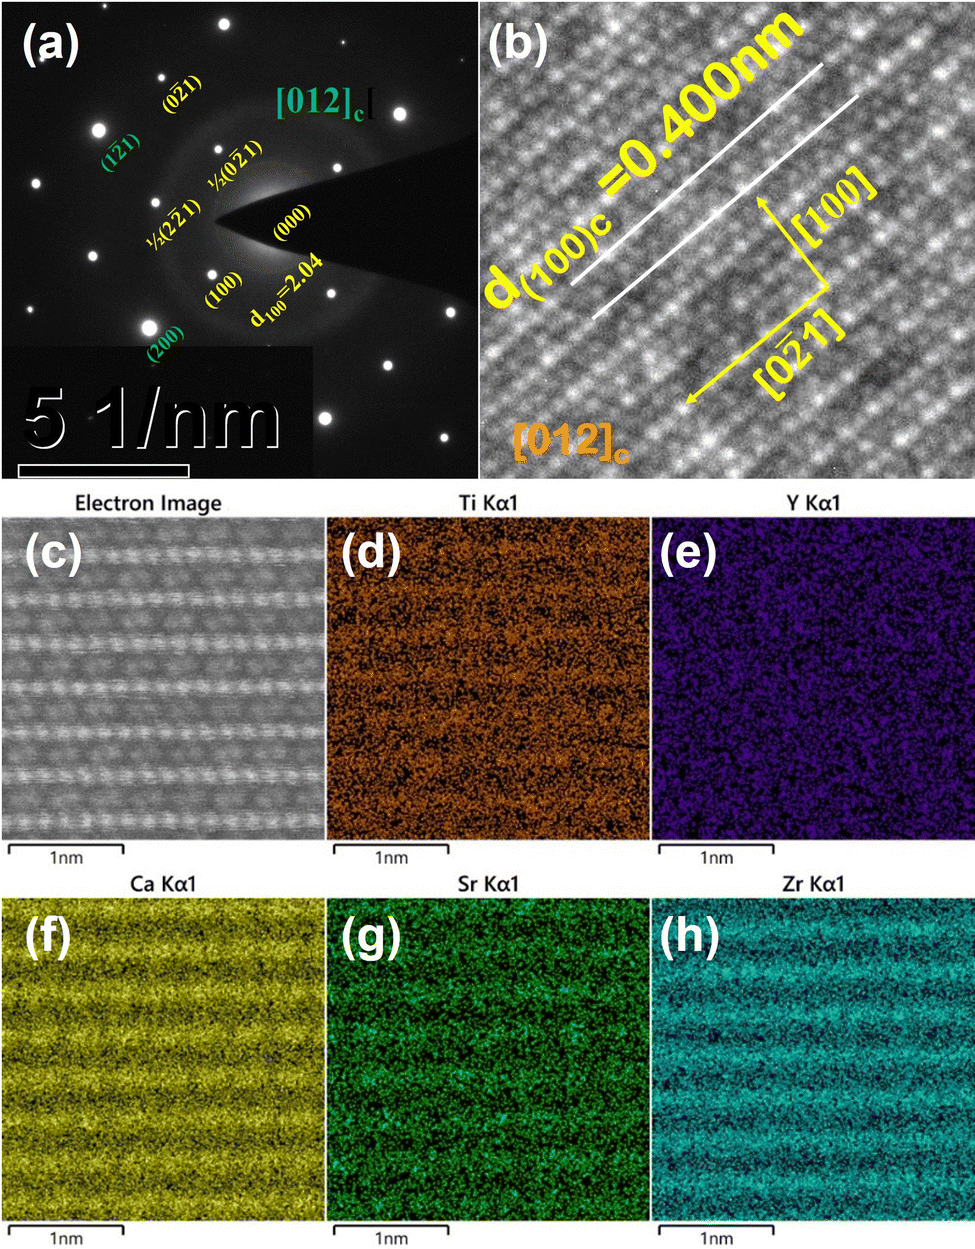
Fig. 5 shows the selected area electron diffraction (SAED) patterns, atomic-resolved high angle annular dark field (HAADF) STEM images and energy dispersive spectroscopy (EDS) elemental maps viewed along the [012]c zone axis for the CSZTY (x = 0.1) ceramic. Superlattice reflections were observed along the [012]c zone axis in the SAED pattern, which resulted from cell doubling caused by the octahedral tilt transitions. According to the grayscale in Fig. 5(b) and (c) and the distribution of elements in Fig. 5(d)–(h), the position of the A-site and B-site atomic columns can be identified. Zr and Ti atoms occupy the B-site, and the Sr and Ca atoms occupy the A-site in the ABO3 structure. The Y atom occupies both A and B sites. It is difficult to identify the position of the Mg atom in the ABO3 structure because of the low doping amount. The effect of Mg doping is not considered in this paper to simplify the analysis.
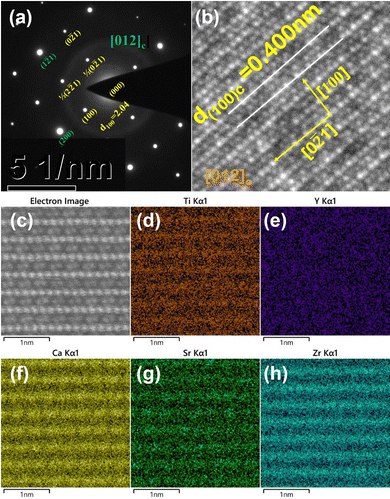 |
| | Fig. 5 (a) Selected area electron diffraction (SAED) pattern, (b) and (c) atomic-resolved high angle annular dark field (HAADF) STEM images and (d)–(h) energy dispersive spectroscopy (EDS) elemental mapping images of Ti, Y, Ca, Sr, and Zr viewed along the [012]c zone axis for the CSZTY (x = 0.1) ceramic. | |
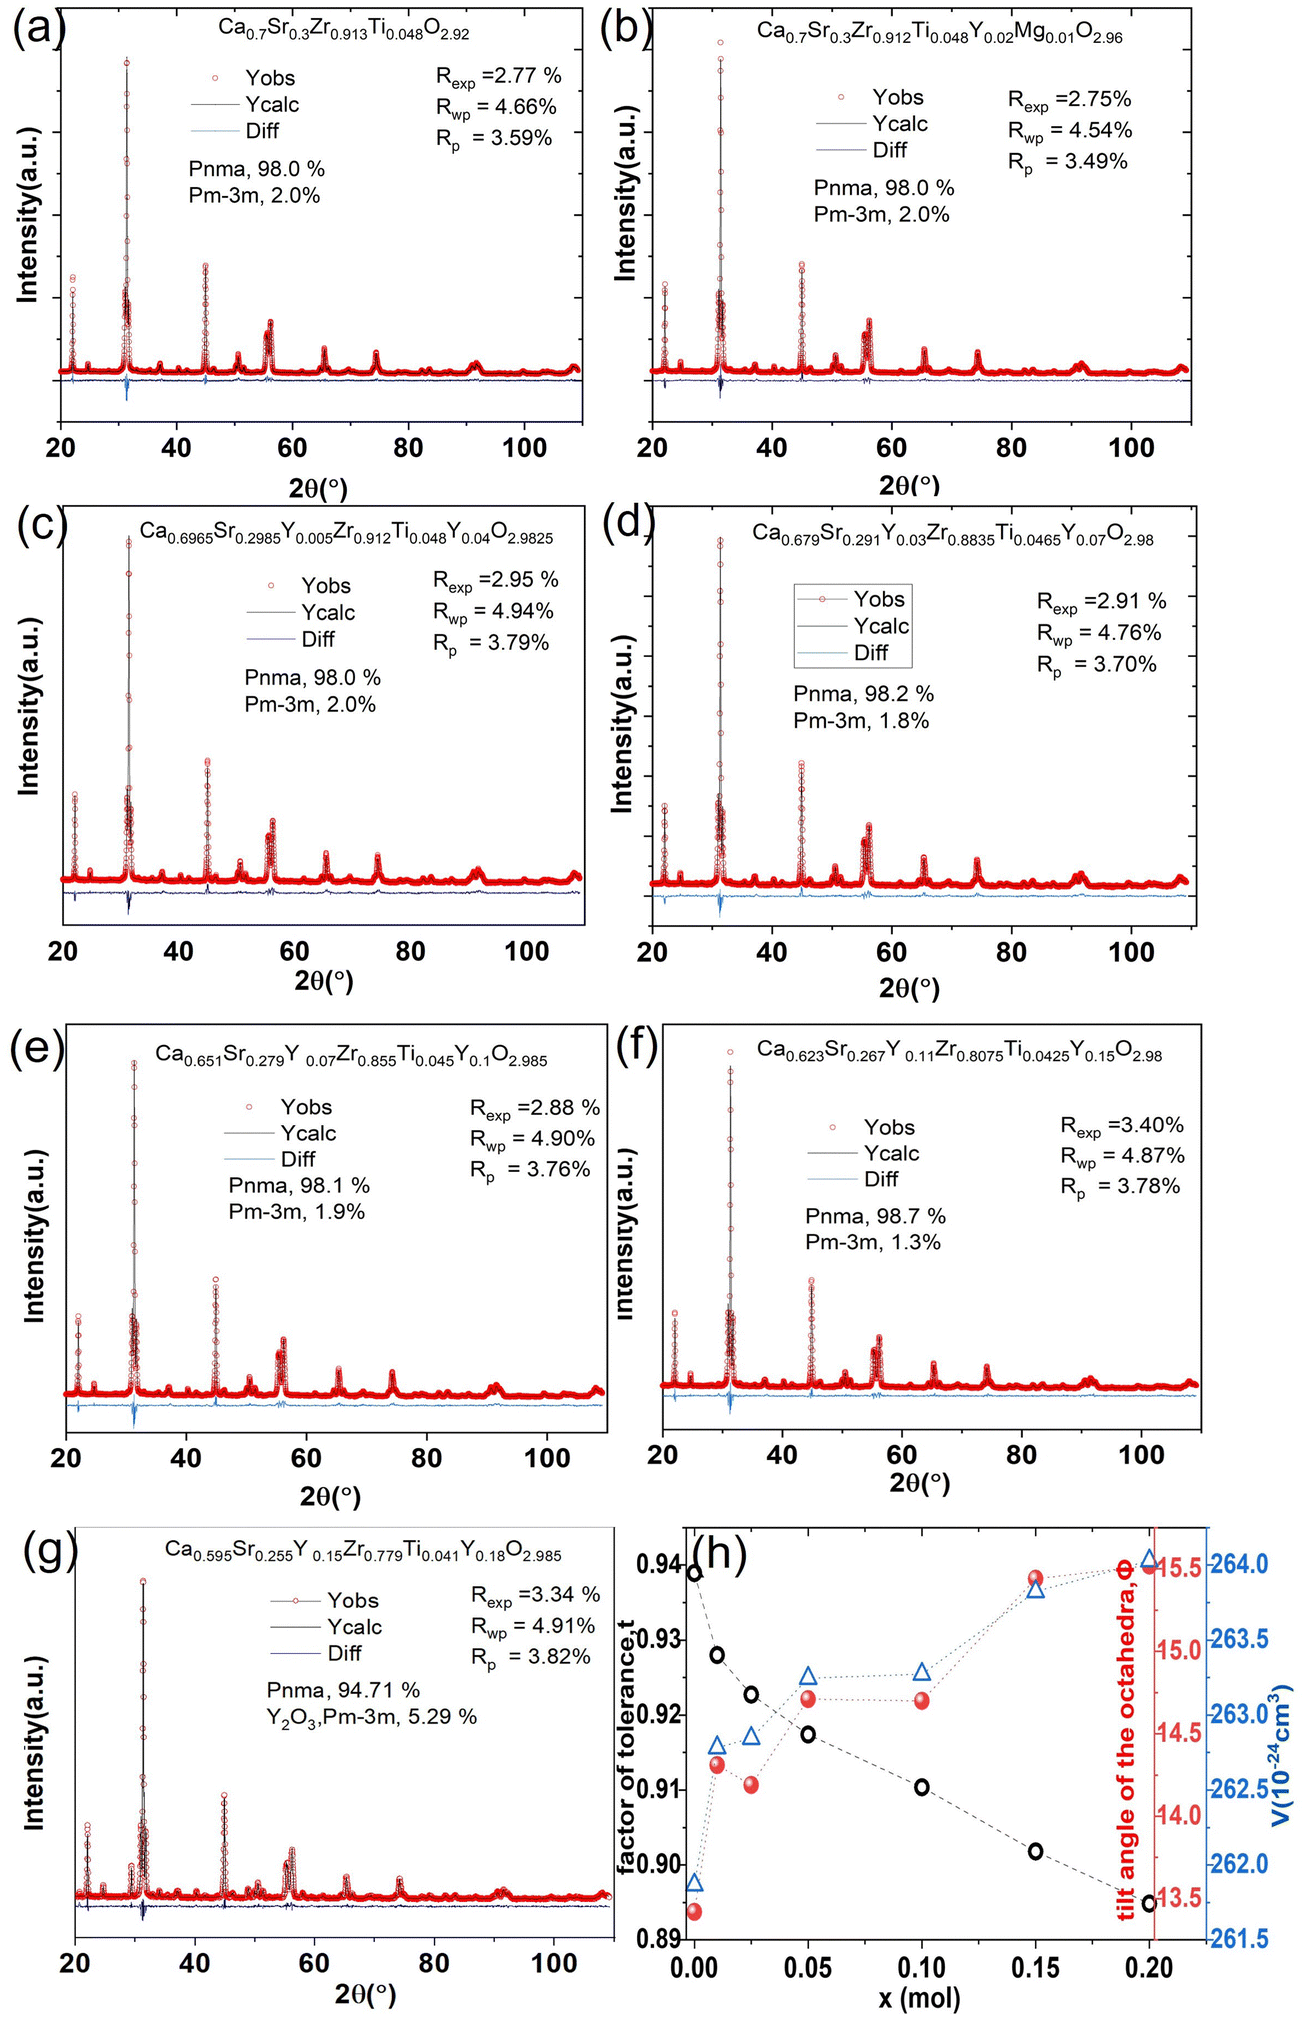
Rietveld refinement is used to characterize the phase content and cell parameters of the materials and determine the crystal structure. The lattice parameters and mass percentage of each phase of all samples were calculated using TOPAS software based on the Rietveld refinement results, which are shown in Fig. 6 and Table 1. Fig. 6(a)–(g) show the Rietveld refinement patterns of CSZT and CSZTY (x = 0.01, 0.05, 0.10, 0.15, and 0.20) ceramics. The goodness of fit values (Rp, Rwp, and Rexp) indicate the high reliability of the refinement results. Fig. 6(h) shows the correlations among t, Φ, and V with variations of x.
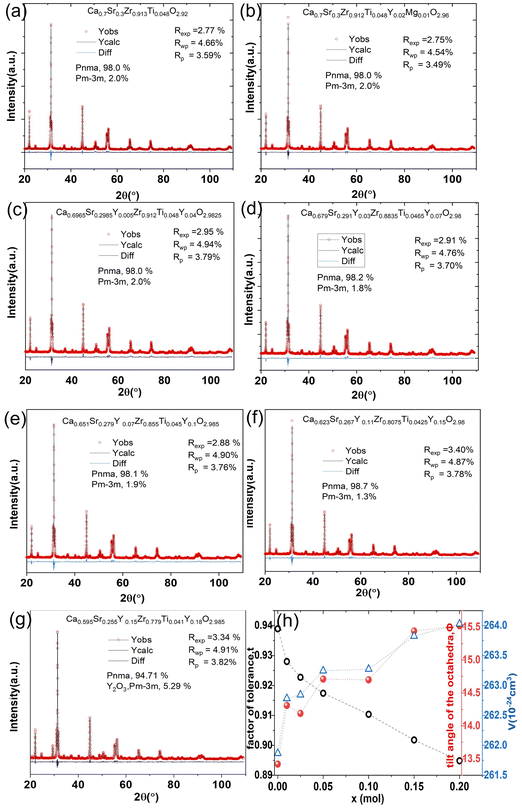 |
| | Fig. 6 (a)–(g) Rietveld refinement patterns of CSZTY (x = 0, 0.01, 0.05, 0.10, 0.15, and 0.20) ceramics. (h) The correlations among t, Φ, and V with variations of x. | |
Table 1 Lattice parameters and tilt angles of the octahedra of CSZT and CSZTY ceramics with variations of x
| Composition |
Phase |
a (Å) |
b (Å) |
c (Å) |
V (Å3) |
Φ (°) |
|
x = 0 |
Ca0.7Sr0.3Zr0.913Ti0.048O2.92 |
Orthorhombic |
5.647767(15) |
8.05770(2) |
5.75441(18) |
261.868 (13) |
13.42 |
| Cubic |
4.03190(3) |
— |
— |
65.541 (16) |
|
x = 0.01 |
Ca0.7Sr0.3Zr0.912Ti0.048Y0.02Mg0.01O2.96 |
Orthorhombic |
5.64712(14) |
8.06930(2) |
5.76678(14) |
262.783 (11) |
14.31 |
| Cubic |
4.03620(3) |
— |
— |
65.752 (14) |
|
x = 0.025 |
Ca0.6965Sr0.2985Y0.005Zr0.912Ti0.048Y0.04O2.9825 |
Orthorhombic |
5.64849(17) |
8.07050(3) |
5.76593(19) |
262.845 (15) |
14.19 |
| Cubic |
4.03670(4) |
— |
— |
65.780 (2) |
|
x = 0.05 |
Ca0.679Sr0.291Y0.03Zr0.8835Ti0.0465Y0.07O2.98 |
Orthorhombic |
5.64695(16) |
8.07560(2) |
5.77261(17) |
263.246 (13) |
14.71 |
| Cubic |
4.03920(4) |
— |
— |
65.90 (2) |
|
x = 0.10 |
Ca0.651Sr0.279Y0.07Zr0.855Ti0.045Y0.1O2.985 |
Orthorhombic |
5.64726(15) |
8.07570(2) |
5.77280(17) |
263.273 (13) |
14.70 |
| Cubic |
4.03930(4) |
— |
— |
65.903 (18) |
|
x = 0.15 |
Ca0.623Sr0.267Y0.11Zr0.8075Ti0.0425Y0.15O2.98 |
Orthorhombic |
5.64473(15) |
8.08270(2) |
5.78254(17) |
263.824 (13) |
15.44 |
| Cubic |
4.0420(5) |
— |
— |
66.040 (3) |
|
x = 0.20 |
Ca0.595Sr0.255Y0.15Zr0.779Ti0.041Y0.18O2.985 |
Orthorhombic |
5.64540(13) |
8.08510(12) |
5.78455(14) |
264.029 (11) |
15.52 |
| Y2O3 |
Cubic |
5.27310(3) |
— |
— |
146.620 (2) |
For CSZT and CSZTY (x = 0.01, 0.05, 0.10, 0.15, and 0.20) ceramics, the perovskite structure exhibits Pnma orthorhombic and a small amount of Pm![[3 with combining macron]](https://www.rsc.org/images/entities/char_0033_0304.gif) m cubic phases. As x increases from 0 to 0.15, the Pnma orthorhombic phase increases from 98.0 wt% to 98.7 wt%, and the Pmm cubic phase decreases from 2.0 wt% to 1.3 wt%. At x = 0.20, there are only a Pnma orthorhombic phase (94.71 wt%) and a cubic Y2O3 phase (5.29 wt%) in CSZTY.
m cubic phases. As x increases from 0 to 0.15, the Pnma orthorhombic phase increases from 98.0 wt% to 98.7 wt%, and the Pmm cubic phase decreases from 2.0 wt% to 1.3 wt%. At x = 0.20, there are only a Pnma orthorhombic phase (94.71 wt%) and a cubic Y2O3 phase (5.29 wt%) in CSZTY.
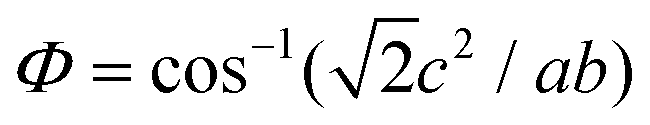
Table 1 summarizes the lattice parameters of CSZT and CSZTY (x = 0.01, 0.05, 0.10, 0.15, and 0.20) ceramics. For the main phase (the Pnma orthorhombic phase), the unit cell is anisotropic in the tilted structures. As x increases, lattice parameter b increases from 8.058 Å to 8.085 Å, lattice parameter c increases from 5.754 Å to 5.785 Å, while lattice parameter a varies little. The lattice volume V increases from 261.87 Å3 to 264.03 Å3. Therefore, it is not a simple increase in dimensions of the dodecahedra but also a distortion of the crystal lattice. Here, we use changes in the tilt angle of the BO6 octahedra (Φ) and tolerance factor (t) to characterize the distortion process of the lattice structure. The tilt angle of the BO6 octahedra, Φ, can be deduced from the unit cell parameters a, b and c according to the relation:12
| |  | (3) |
As the Y
2O
3 doping amount increases from
x = 0 to
x = 0.2, the tilt angle
Φ increases from 13.42° to 15.52° according to the formula
(3), and the distortion of the perovskite structure increases. This variation can be related to the evolution of the factor of tolerance,
t, associated with this cation substitution (
Table 2).
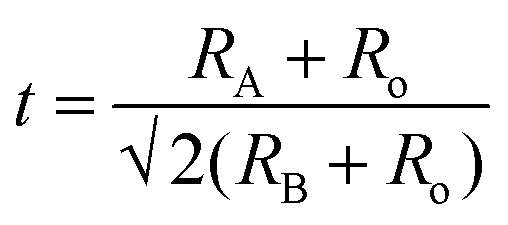
20 This parameter is defined by Goldschmidt as:
12| |  | (4) |
where
RA,
RB and
RO are the ionic radii of the ABO
3 perovskite compound studied. The factor of tolerance
t defines the stability of the perovskite structure. Such stability is observed as the value of
t ranges from 0.75 to 1.
21 When the value is above 0.95 the structure tends to take the ideal cubic form; when the value is lower, it tends to take a more distorted superstructure.
22,23 Based on the Rietveld refinement, the ionic radii and
t of the CSZTY ceramics are calculated and listed in
Table 3.
24
Table 2 Effective ionic radii of Ca2+, Sr2+, Ti4+, Y3+, Mg2+, and O2− (Shannon 1976)
| Ion |
Ca2+ |
Sr2+ |
Zr4+ |
Ti4+ |
Y3+ |
Mg2+ |
O2− |
| Coordination |
XII |
XII |
VI |
VI |
VIII |
VI |
VI |
VI |
| Ionic radius (Å) |
1.34 |
1.44 |
0.72 |
0.605 |
1.02 |
0.90 |
0.72 |
1.4 |
Table 3 The calculated mean size of the A, B, O ions, the factor of tolerance, and tilt angles of the octahedra in CSZT and CSZTY (x = 0.01, 0.025, 0.05, 0.10, 0.15, and 0.20)
| Composition |
R
A (Å) |
R
B (Å) |
R
o (Å) |
t
|
|
x = 0 |
Ca0.7Sr0.3Zr0.913Ti0.048O2.92 |
1.370 |
0.686 |
1.400 |
0.939 |
|
x = 0.01 |
Ca0.7Sr0.3Zr0.912Ti0.048Y0.02Mg0.01O2.96 |
1.370 |
0.711 |
1.400 |
0.928 |
|
x = 0.025 |
Ca0.6965Sr0.2985Y0.005Zr0.912Ti0.048Y0.04O2.9825 |
1.368 |
0.722 |
1.400 |
0.923 |
|
x = 0.05 |
Ca0.679Sr0.291Y0.03Zr0.8835Ti0.0465Y0.07O2.98 |
1.360 |
0.727 |
1.400 |
0.917 |
|
x = 0.1 |
Ca0.651Sr0.279Y0.07Zr0.855Ti0.045Y0.1O2.985 |
1.346 |
0.733 |
1.400 |
0.910 |
|
x = 0.15 |
Ca0.623Sr0.267Y0.11Zr0.8075Ti0.0425Y0.15O2.98 |
1.332 |
0.742 |
1.400 |
0.902 |
|
x = 0.2 |
Ca0.595Sr0.255Y0.15Zr0.779Ti0.041Y0.18O2.985 |
1.318 |
0.748 |
1.400 |
0.895 |
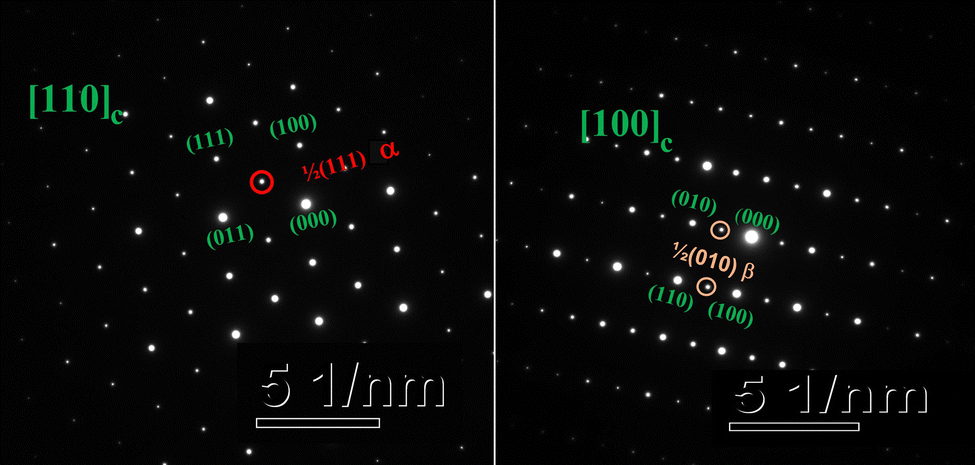
As the Y2O3 doping amount increases from x = 0 to x = 0.2, the mean size of the A-cation decreases from 1.370 Å to 1.318 Å, the mean size of the B-cation increases from 0.686 Å to 0.748 Å, so the factor of tolerance t decreases from 0.939 to 0.895 according to the formula (4). The values of t for all components are less than 0.965, which confirms the presence of the oxygen octahedron tilt.23,25Fig. 6(h) shows the correlations among the factor of tolerance t, the tilt angle of BO6 octahedra Φ, and unit-cell volume V with variation of x. It can be observed that with the increase of x, the factor of tolerance t has an approximately linear decreasing trend, while the tilt angle of the BO6 octahedra and unit-cell volume has a synchronous increasing trend overall. The distribution of Y3+ on the A-site induces an increase in the tilting of octahedra due to the decrease of the A cation size in the dodecahedra; the distribution of Y3+ on the B-site produces an increase in the tilting of the octahedra due to the increase of the B cation size. With a decrease in the size of the A-cation and an increase in the size of the B cation, the volume of octahedra increases. The analysis is verified by the observation of superlattice reflections in the SAED patterns. Superlattice reflections are caused by the octahedral tilt transitions. Fig. 7 shows the SAED patterns viewed along the [110]c and [100]c zone axis for the CSZTY (x = 0.1) ceramic. α and β superlattice reflections from antiphase tilting and antiparallel shifts of A-site species are observed in the [110]c and [100]c zone axis diffraction patterns, respectively. This phenomenon has also been observed in other perovskite compounds.23
 |
| | Fig. 7 SAED patterns viewed along the [110]c and [100]c zone axis for the CSZTY (x = 0.1) ceramic. α and β superlattice reflections from antiphase tilting and antiparallel shifts of A-site species are observed in [110]c and [100]c zone axis diffraction patterns, respectively. | |
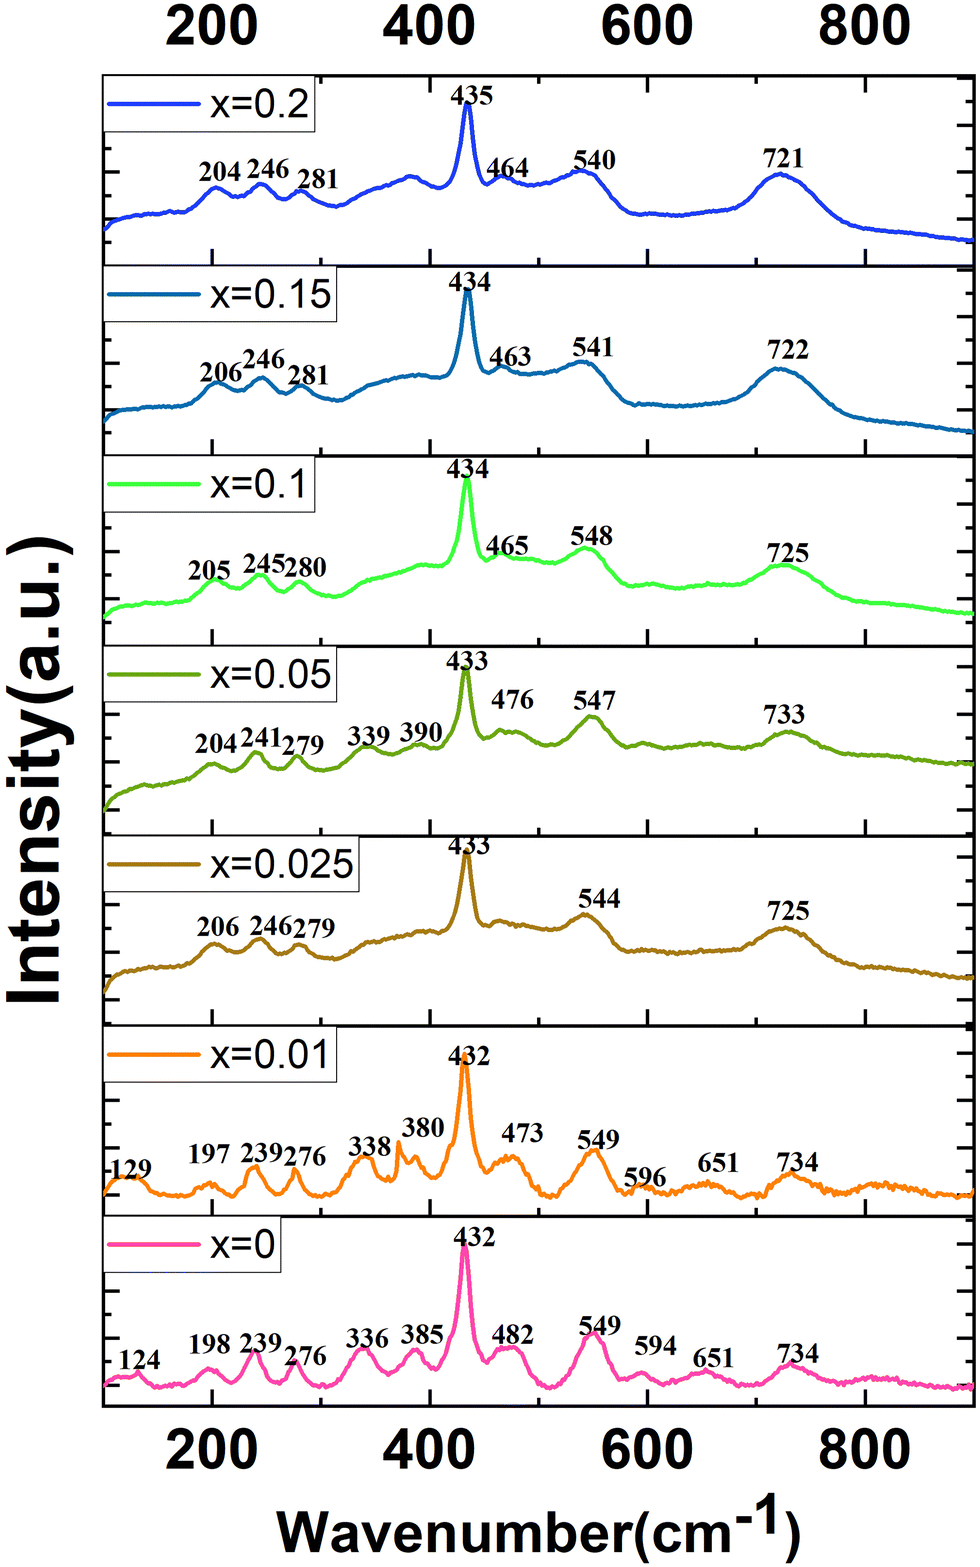
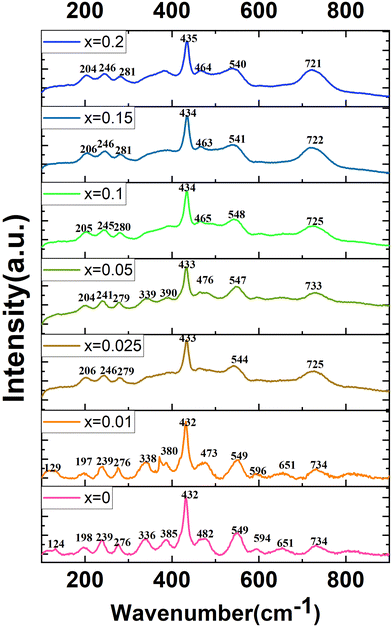
Raman spectroscopy is a tool to study the lattice dynamics of dielectric ceramics. From the Raman spectra, some information on the composition, crystal structure and dielectric properties of materials can be obtained. The primitive cell of the orthorhombic phase perovskite (Pnma) contains 20 atoms. Through group theory analysis, it is found that there are a total of 24 Raman active modes.11–13,18,19Fig. 8 presents the Raman spectra of the CSZTY (x = 0, 0.01, 0.025, 0.05, 0.10, 0.15, 0.20) ceramics in the 100 cm−1 to 900 cm−1 frequency range. The number of Raman-active modes is lower than the 24 expected modes of vibrations. Some modes cannot be detected. As the Y2O3 doping amount increases from x = 0 to x = 0.2, the number of Raman modules that can be observed decreases from 13 to 7. It could be due to the decrease of dielectric polarizability with the continuous distribution of the Y3+ trivalent cation at the A- or B-site; it is also possible for some predicted modes to hide behind other intense bands, and thus may overlap as previously suggested for other perovskites.12,25
 |
| | Fig. 8 Raman spectra of CSZT and CSZTY ceramics (x = 0.01, 0.025, 0.05, 0.10, 0.15, and 0.20). | |
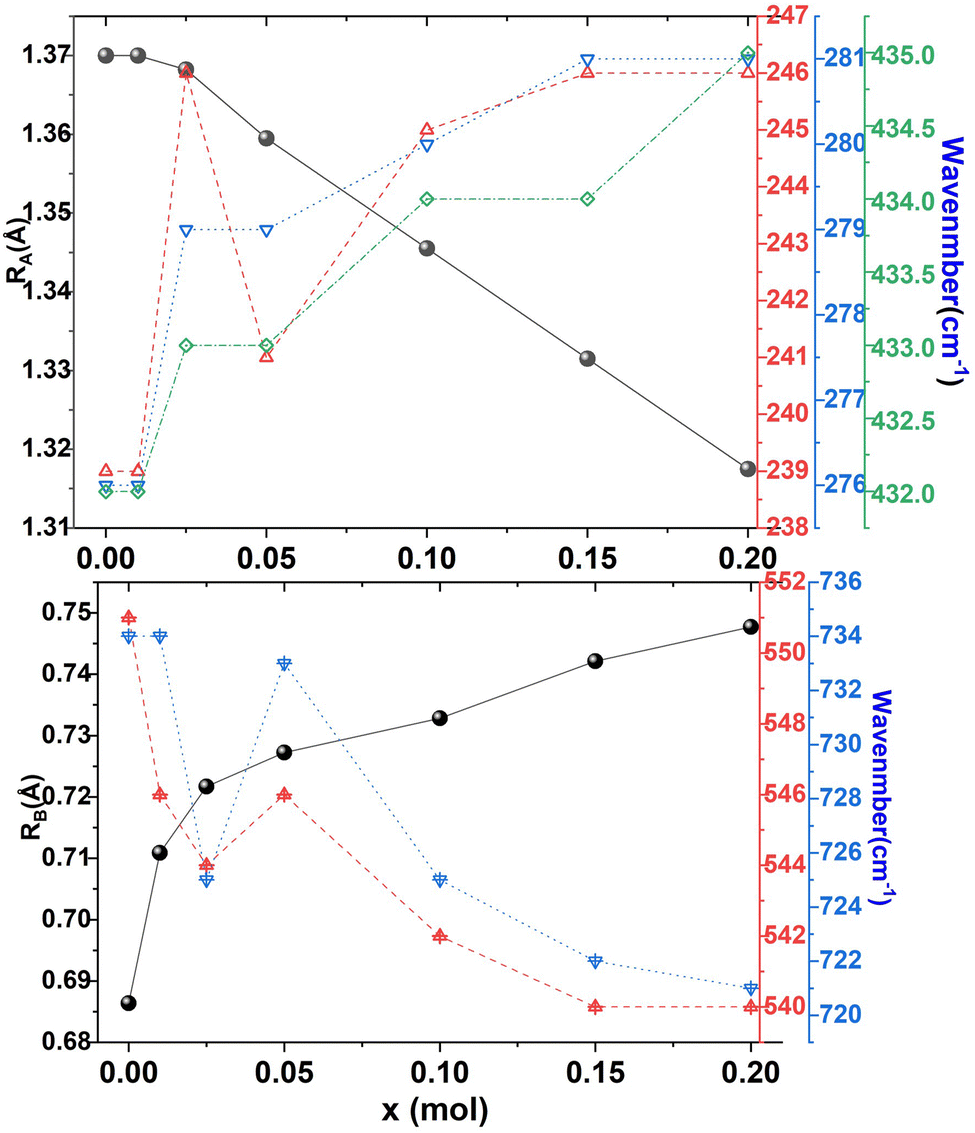
Table 4 shows the Raman frequencies and mode assignments in CSZTY ceramics in this study and previous literature.11–13,18,19 Based on previous studies on perovskite zirconate-based oxides,11–13,18,19 the vibration modes of CSZTY ceramics are divided into five regions: the region (100–190 cm−1) related to the A-BO6 octahedron inverted translational vibrations; the region (190–300 cm−1) related to the O–B–O bending motion, which is the inverted B ion movement in the BO6 octahedron; the region (300–450 cm−1) correlated with the B–O torsion modes; the 450–600 cm−1 region associated with B–O stretching; and the high-frequency region (above 600 cm−1) corresponding to second-order Raman scattering. Here, Raman data show that vibrational spectra are strongly affected by the cation substitution at the A and B-sites. From Fig. 8, it can be seen that compared with the CSZT (x = 0) ceramic, the vibration modes (124–432 cm−1) blue shift and Raman vibration modes (473–732 cm−1) red shift with the increasing doping content of Y3+. The rules of frequency shifts of vibrational modes are similar to those in Ca(Sr)ZrO3 and CaZr(Sn)O3 solid solutions.12Fig. 9 shows the relationships between the A and B-site ionic radii and frequency shifts of some vibrational modes of CSZTY ceramics with variations of x.
Table 4 Raman frequencies and mode assignments in CSZTY ceramics in this study and previous works
| Raman shifts |
(cm−1) |
Mode |
Assignments |
| This work |
Literature11–13,18,19 |
| 124–129 |
117, 124 |
B2g |
Second order |
| 197–206 |
190, 193 |
B2g |
B–O bending |
| 239–246 |
239, 242 |
Ag |
B–O bending |
| 276–281 |
278, 283 |
Ag |
B–O bending |
| 336–340 |
338, 340 |
|
Torsional mode |
| 380–390 |
392, 395 |
B2g |
Torsional mode |
| 432–435 |
435, 439 |
Ag + B1g or B2g |
Torsional mode |
| 482–462 |
468, 473 |
B2g |
B–O stretching |
| 549–540 |
543, 551 |
Ag + B1g or B3g |
B–O stretching |
| 594–596 |
603 |
Second-order scattering: the superposition of different combinations modes |
| 651 |
666, 685 |
| 721–734 |
765 |
 |
| | Fig. 9 The A and B-site ionic radii and frequency shifts of some vibrational modes of CSZTY ceramics with variations of x. | |
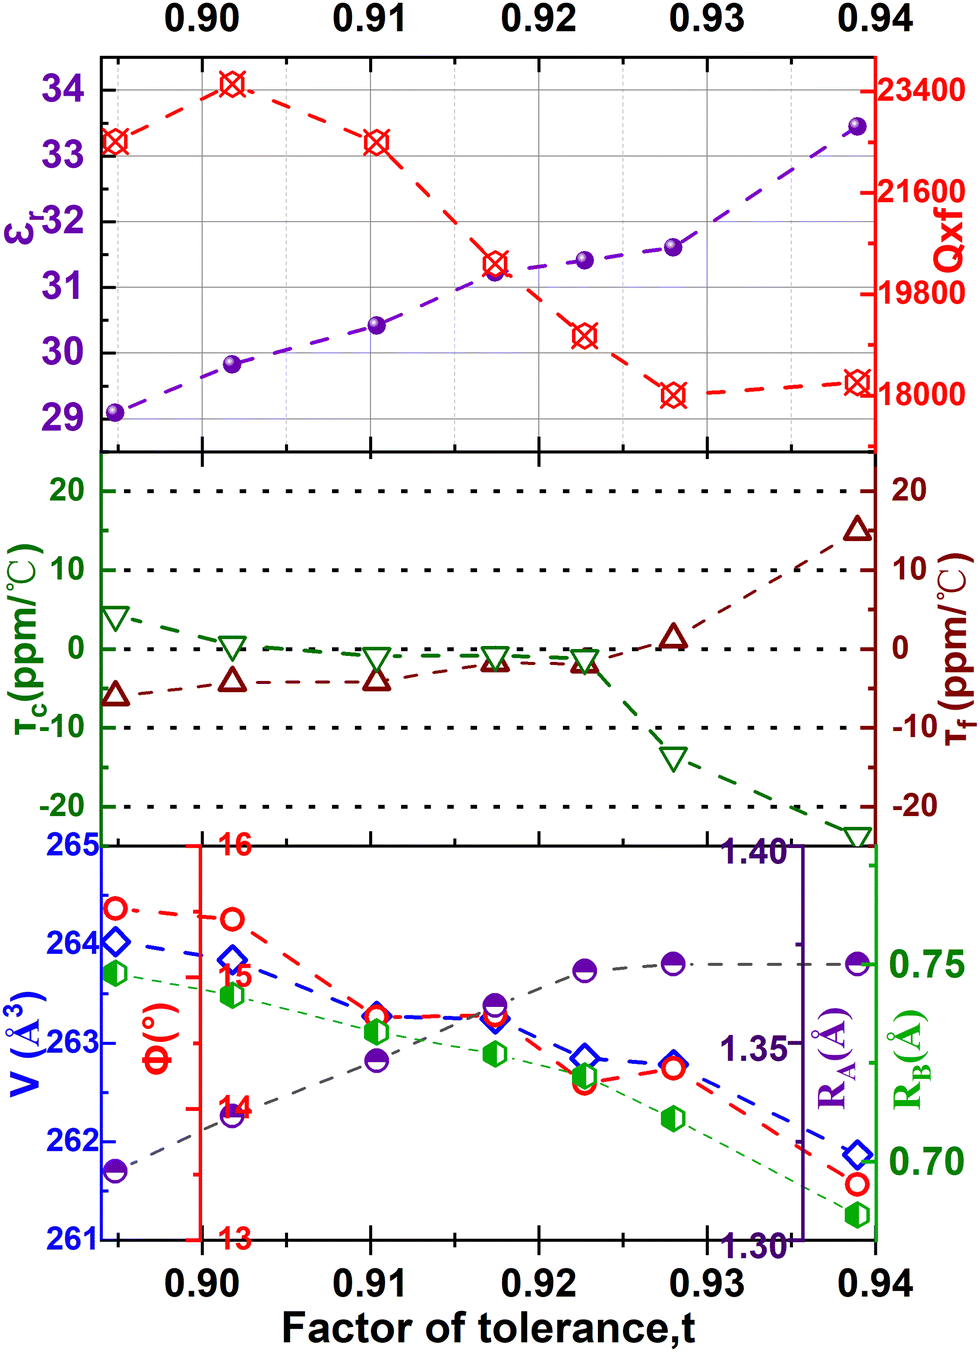
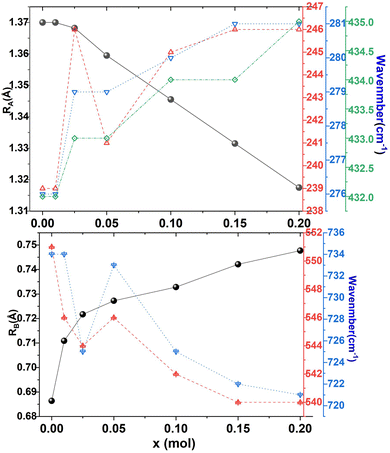
In perovskite ceramics, the dielectric properties are related to the structural features. The vibrational modes at low frequencies have larger contributions to the permittivity and dielectric loss.18 With the decrease of t from 0.939 to 0.895, the Raman modes below 450 cm−1 blue shift, and the increase of the octahedral tilting angle produces a change in polarizability of the ions. The dielectric properties also undergo corresponding changes. Fig. 10 shows the relationship among the factor of tolerance t, unit-cell volume V, the tilt angle of BO6 octahedra, A-site ionic radius RA, B-site ionic radius RB, temperature coefficient of permittivity τc (@1 MHz, −55 °C to 125 °C), temperature coefficient of resonant frequency τf (@7 GHz, 25 °C to 85 °C), dielectric constant εr (@7 GHz), and factor of merit Q × f (@7 GHz) of CSZTY ceramic with variations of x. With the decrease of the factor of tolerance t from 0.939 to 0.895, εr decreases linearly from 33.45 to 29.09, while Q × f increases from 18232 GHz to 23528 GHz, τc increases from −23.78 ppm °C−1 to 4.28 ppm °C−1, and τf decreases from 14.92 ppm °C−1 to −6.05 ppm °C−1. Except for the CSZTY ceramic at x = 0.2, Q × f slightly decreases for the formation of impurity phase Y2O3. The relationship between t and τc observed in this work is similar to the work of Chae-Il Cheon and Jeong-Seog Kim,26 which reported that τc increases with the decrease of t from 0.96 to 0.92. In our work, t is in the range from 0.895 to 0.939, and as t decreases from 0.939 to 0.928, τc quickly tends to zero and flattens out as t decreases from 0.928 to 0.895. At x = 0.15, the CSZTY ceramic presents optimized microwave dielectric properties: εr = 29.8, Q × f = 23528 GHz, τc = 0.50 ppm °C−1, and τf = −4.25 ppm °C−1. Table 5 lists the values of t, εr (@7 GHz), Q × f (@7 GHz), τc (@1 MHz, −55 °C to 125 °C), and τf (@7 GHz, 25 °C to 85 °C) of the CSZTY ceramic and the data from the literature on (Ca,Sr)(Zr,Ti)O3 ceramics with a similar preparation process.
 |
| | Fig. 10 The relationship among the factor of tolerance t, unit-cell volume V, the tilt angle of BO6 octahedra, A-site ionic radius RA, B-site ionic radius RB, temperature coefficient of permittivity τc (@1 MHz, −55 °C to 125 °C), temperature coefficient of resonant frequency τf (@7 GHz, 25 °C to 85 °C), dielectric constant εr (@7 GHz), and the factor of merit Q × f (@7 GHz) of the CSZTY ceramic with variations of x. | |
Table 5 The values of the factor of tolerance t, dielectric constant εr (@7 GHz), temperature coefficient of permittivity τc (@1 MHz, −55 °C to 125 °C), factor of merit Q × f (@7 GHz), and the temperature coefficient of resonant frequency τf (@7 GHz, 25 °C to 85 °C) of CSZTY ceramic and the data from the literature for (Ca, Sr)(Zr, Ti) O3 ceramics with a similar preparation process
| Composition |
t
|
ε
|
Qxf (GHz) |
τ
c (ppm °C−1) |
τ
f (ppm °C−1) |
| CSZTY(x = 0) |
0.939 |
33.45 |
18232 |
−23.78 |
14.92 |
| CSZTY(x = 0.01) |
0.928 |
31.61 |
18007 |
−13.59 |
1.30 |
| CSZTY(x = 0.025) |
0.923 |
31.41 |
19062 |
−1.20 |
−1.90 |
| CSZTY(x = 0.05) |
0.917 |
31.23 |
20340 |
−0.80 |
−1.73 |
| CSZTY(x = 0.1) |
0.910 |
30.42 |
22495 |
−0.92 |
−4.15 |
| CSZTY(x = 0.15) |
0.902 |
29.83 |
23528 |
0.50 |
−4.25 |
| CSZTY(x = 0.2) |
0.895 |
29.09 |
22511 |
4.28 |
−6.05 |
| Ca0.6Sr0.4Zr0.95Ti0.05O311 |
0.930 |
35.74 |
15734 |
−28.26 |
5.62 |
| Ca0.75Sr0.25Zr0.95Ti0.05O311 |
0.920 |
35.16 |
17306 |
−48.79 |
16.06 |
| Ca0.8Sr0.2Zr0.92Ti0.08O326 |
0.933 |
38 |
7403 |
−62 |
— |
| Ca0.8Sr0.2Zr0.96Ti0.04O326 |
0.931 |
34 |
10938 |
−15 |
— |
| Ca0.8Sr0.2ZrO326 |
0.929 |
31 |
15006 |
67 |
— |
| CaZrO310 |
0.914 |
27 |
16543 |
— |
−19.98 |
From our work and literature reports, it can be seen that the changes in the ion radius, unit-cell volume, and the tilt angle of BO6 octahedra in the perovskite structure have a significant impact on ion polarization. For (Ca,Sr)(Zr,Ti)O3 ceramics, with the increase of the Ca/Sr ratio, the radius of A-site ions decreases, the tolerance factor decreases, and the dielectric constant decreases; with the increase of the Zr/Ti ratio, the radius of B-site ions increases and t and εr decrease. εr of the CaZrO3 ceramic is the smallest among those of (Ca,Sr)(Zr,Ti)O3 ceramics, and the value is 27. But τf is −19.98 ppm °C−1, which is far from zero. With the increase of the Ti/Zr ratio, τf gradually changes from negative to positive, while εr increases and the value of Q × f decreases significantly. In order to obtain materials with εr of 30, higher value of Q × f, and near zero τf or τc simultaneously, changing the ratios of Ca/Sr and Ti/Zr is not enough. The substitution of Y3+ at the A and B-sites in (Ca,Sr)(Zr,Ti)O3 ceramics can reduce εr, improve the value of Q × f, and quickly regulate τf or τc to near zero, making up for the shortcomings of pure (Ca,Sr)(Zr,Ti)O3 ceramics.
4. Conclusions
In this work, CSZTY ceramics were exploited and synthesized using the solid-state reaction process. Optimized microwave dielectric properties were achieved in the CSZTY (x = 0.15) ceramic: εr = 29.8, Q × f = 23528 GHz, τc = 0.50 ppm °C−1, and τf = −4.25 ppm °C−1. The effects of Y doping on the crystal structures, microstructures, and microwave dielectric properties of CSZTY ceramics were investigated. From the measurement results of XRD, TEM and SEM, it can be determined that all the ceramics have mainly an orthorhombic perovskite structure (space group of Pnma), and Y3+ cations distribute both A and B-sites in the perovskite structure (ABO3). Upon increasing Y3+ substitution at the A and B-sites, the factor of tolerance t decreases, while the tilt angle of BO6 octahedra becomes bigger. Superlattice reflections appearing along the [100]c, [110]c and [012]c zone axes are observed in the selected area electron diffraction (SAED) patterns as a result of cell doubling caused by the octahedral tilt transitions. Raman data show that with increasing doping amount of yttria, the frequencies of some vibrational modes before and after 450 cm−1 blue shift and red shift, respectively. With structural evolution, the dielectric properties also undergo corresponding changes. There exist nearly linear correlations between the composition, structure, and dielectric properties. With the increasing doping amount of Y3+, the factor of tolerance t and the dielectric constant εr decrease, the quality factor Q × f value increases, the temperature coefficient of dielectric permittivity τc increases, and the resonant frequency temperature coefficient τf decreases. This work provides a method to optimize the microwave dielectric properties of perovskite structure materials.
Conflicts of interest
There are no conflicts to declare.
Acknowledgements
This work was supported by the National Natural Science Foundation of China (grant no. U2002217) and Chinese Academy of Sciences Key Project (ZDRW-CN-2021-3-1-18).
References
- H. H. Guo, D. Zhou, C. Du, P. J. Wang, W. F. Liu, L. X. Pang, Q. P. Wang, J. Z. Su, C. Singh and S. Trukhanov, Temperature stable Li2Ti0.75(Mg1/3Nb2/3)0.25O3-based microwave dielectric ceramics with low sintering temperature and ultra-low dielectric loss for dielectric resonator antenna applications, J. Mater. Chem. C, 2020, 8, 4690–4700 RSC.
- J. Fan, K. Du, Z. Y. Zou, C. Z. Yin, Y. B. Guo, F. Wang, Q. Zhao, X. H. Wang, W. Z. Lu and W. Lei, Impedance spectroscopy, B-site cation ordering and structure-property relations of (1-x)La[Al0.9(Mg0.5Ti0.5)0.1]O3-xCaTiO3 ceramics for 5G dielectric waveguide filters, Ceram. Int., 2021, 47, 15319–15327 CrossRef CAS.
- G. Wang, H. Zhang, F. Xu, X. Huang, Y. Lai, G. Gan, Y. Yang, J. Li, C. Liu and L. Jin, Investigation and characterization on crystal structure and enhanced microwave dielectric properties of non-stoichiometric Li3+xMg2NbO6 ceramics, Ceram. Int., 2018, 44, 20539–20544 CrossRef CAS.
- W. Guo, Z. Ma, Y. Luo, Y. Chen, Z. Yue and L. Li, Structure, defects, and microwave dielectric properties of Al-doped and Al/Nd co-doped Ba4Nd9.33Ti18O54 ceramics, J. Adv. Ceramic., 2022, 11, 629–640 CrossRef CAS.
- W. C. Lou, M. Mao, K. X. Song and K. W. Xu,
et al., Low permittivity cordierite-based microwave dielectric ceramics for 5G/6G telecommunications, J. Euro. Ceram. Soc., 2022, 42, 2820–2826 CrossRef CAS.
- J. Y. Wu and J. J. Bian, Effect of nonstoichiometry on the microstructure and microwave dielectric properties of Ba(Mg1/2W1/2)O3 ceramics, Ceram. Int., 2013, 39, 3641–3649 CrossRef.
- H. Malekzadeh, A. S. Shahraki, E. T. Nassaj, W. Dong, H. B. Bafrooei, Q. Fu and N. Newman, Effect of heat treatment on the properties of non-stoichiometric Ba3CoNb2O9 ceramics: evaluation of crystal structure, order-disorder behavior, and dielectric characteristics, J. Eur. Ceram. Soc., 2022, 42, 3224–3233 CrossRef CAS.
- T. Yamaguchi, Y. Komatsu, T. Otobe and Y. Murakami, Newly developed ternary (Ca, Sr, Ba) zirconate ceramic system for microwave resonators, Ferroelectrics, 2011, 27, 273–276 CrossRef.
- Y. D. Li, J. M. Chen and Y. C. Lee, Dielectric properties and microstructures of (CaxSr1-x) ZrO3 ceramics, Ceram. Process Res., 2018, 19, 461–466 Search PubMed.
- S. Parida, S. K. Rout, N. Gupta and V. R. Gupta, Solubility limits and microwave dielectric properties of Ca(ZrxTi1-x)O3 solid solution, J. Alloys Compd., 2013, 546, 216–223 CrossRef CAS.
- Q. Y. Pang, F. Yang, W. Huang, X. Li, H. R. Cheng, S. Y. Sun, Y. Chen and G. S. Wang, Crystal structure dependence of the microstructure and microwave dielectric properties of (SrxCa1-x)(Zr0.95Ti0.05)O3 (0≤ x ≤ 1) perovskite ceramics, J. Mater. Chem. C., 2022, 10, 16053–16063 RSC.
- M. Tarrida, H. Larguem and M. Madon, Structural investigations of (Ca,Sr)ZrO3 and Ca (Sn,Zr)O3 perovskite compounds, Phys. Chem. Miner., 2009, 36, 403–413 CrossRef CAS.
- Q. Y. Pang, Li. Y. Y. Yang F, Z. W. Liu, X. Li, H. R. Cheng, S. Y. Sun, Y. Chen and G. S. Wang, Microstructure and crystal structure dependence of microwave dielectric properties of non-stoichiometric (Sr0.7Ca0.3)z(Zr0.95Ti0.05)O3 perovskite ceramics, Ceram. Int., 2023, 49, 8598–8606 CrossRef CAS.
- C. H. Hsu and C. H. Chang, Effect of Zr substitution on the microwave dielectric properties of (Ca0.8Sr0.2)TiO3 ceramics, Mater. Res. Bull., 2014, 50, 103–107 CrossRef CAS.
- C. Diao and F. Shi, Correlation among dielectric properties, vibrational modes, and crystal structures in Ba[SnxZn(1-x)/3Nb2(1-x)/3]O3 solid solutions, J. Phys. Chem. C, 2012, 116, 6852–6858 CrossRef CAS.
- M. S. Fu, X. Q. Liu and X. M. Chen, Raman spectra analysis for Ca(B1/3′B2/3′′)O3-based complex perovskite ceramics, J. Appl. Phys., 2008, 104, 104108 CrossRef.
- M. Y. Chen, C. T. Chia, I. N. Lin, L. J. Lin, C. W. Ahn and S. Nahm, Microwave properties of Ba(Mg1/3Ta2/3)O3, Ba(Mg1/3Nb2/3)O3 and Ba(Co1/3Nb2/3)O3 ceramics revealed by Raman scattering, J. Eur. Ceram. Soc., 2006, 26, 1965–1968 CrossRef CAS.
- F. Shi, K. Liang and Z. M. Qi, Investigation of the crystal structure, lattice vibration and dielectric property of SrZrO3 ceramic, J. Mater. Res., 2016, 31, 3249–3254 CrossRef CAS.
- O. Kamishima, T. Hattori, K. Ohta, Y. Chiba and M. Ishigame, Raman scattering of single-crystal SrZrO3, J. Phys.: Condens. Matter, 1999, 11, 5355–5365 CrossRef CAS.
- R. D. Shannon, Revised Effective Ionic Radii and Systematic Studies of Interatomic Distances in Halides and Chalcogenides, Acta Crystallogr., Sect. A: Cryst. Phys., Diffr., Theor. Gen. Crystallogr., 1976, 32, 751–767 CrossRef.
- H. Hayashi, H. Inaba, M. Matsuyama, N. G. Lan, M. Dokiya and H. Tagawa, Structural consideration on the ionic conductivity of perovskite-type oxide, Solid State Ionics, 1999, 122, 1–15 CrossRef CAS.
- J. P. Attfield, A Cation control of perovskite properties, Cryst. Eng., 2002, 5, 427–438 CrossRef CAS.
- I. M. Reaney, E. L. Colla and N. Setter, Dielectric and Structural Characteristics of Ba- and Sr-based Complex Perovskites as a Function of Tolerance Factor, Jpn. J. Appl. Phys., 1994, 33, 3984–3990 CrossRef CAS.
- A. Ahtee, M. Ahtee, A. M. Glaser and A. W. Hewat, The structure orthorhombic SrZrO3 by neutron powder diffraction, Acta Cryst. B, 1976, 32, 3243–3246 CrossRef.
- I. M. Reaney and R. Ubic, Dielectric and structural characteristics of perovskites and related materials as a function of tolerance factor, Ferroelectrics, 1999, 228, 23–38 CrossRef CAS.
- C. I. Cheon and J. S. Kim, The correlation between τε and the tolerance factor in (Sr,Ca)(Ti,Zr)O3 microwave dielectric ceramics, J. Mater. Res., 1998, 13, 1107–1109 CrossRef CAS.
|
| This journal is © The Royal Society of Chemistry 2023 |
Click here to see how this site uses Cookies. View our privacy policy here. 
 Open Access Article
 This Open Access Article is licensed under a
  abc,
Qingyang
Pang
abc,
Qingyang
Pang