 Open Access Article
Creative Commons Attribution 3.0 Unported Licence
First azulene liquid crystal with de Vries behavior and a SmA re-entrant phase†
Finn
Schulz
 a,
Bianca
Wank
a,
Pierre
Nacke
a,
Bianca
Wank
a,
Pierre
Nacke
 b,
Wolfgang
Frey
a and
Sabine
Laschat
 *a
*a
aInstitut für Organische Chemie, Universität Stuttgart, Pfaffenwaldring 55, D-70569 Stuttgart, Germany. E-mail: sabine.laschat@oc.uni-stuttgart.de
bInstitut für Physikalische Chemie, Universität Stuttgart, Pfaffenwaldring 55, D-70569 Stuttgart, Germany
First published on 26th January 2023
Abstract
De Vries-like materials show small layer shrinkages at the SmA to SmC transition and can therefore be applied in surface-stabilized ferroelectric liquid crystal displays. Here we report the synthesis and characterization of a new class of de Vries mesogens with a simple 2-phenylazulene-1-carbonitrile-based core. These materials exhibit an exceptionally small lower threshold for the maximum layer shrinkage of only 0.16%. One of the investigated compounds shows an orthogonal SmA re-entrance phase below the tilted SmC phase. This behavior has not been observed for achiral calamitic molecules before. The rationalization of the anomalous phase behavior might lead to a new design principle for liquid crystalline compounds showing re-entrant phases and de Vries behavior.
Introduction
Liquid crystalline phases differ from each other by the degree of orientational and positional order. In the nematic (N) phase the mesogenic molecules orientate along the director![[n with combining circumflex]](https://www.rsc.org/images/entities/i_char_006e_0302.gif) .1 In contrast, smectic phases behave like 2D fluids where the molecules form layers. When
.1 In contrast, smectic phases behave like 2D fluids where the molecules form layers. When ![[n with combining circumflex]](https://www.rsc.org/images/entities/i_char_006e_0302.gif) is parallel to the layer normal
is parallel to the layer normal ![[k with combining circumflex]](https://www.rsc.org/images/entities/i_char_006b_0302.gif) a smectic A (SmA) phase is present. An additional tilt of the molecules at the angle Θ leads to a SmC phase. The tilt-direction in a SmC phase can be controlled by an external electric field. When anchored between planar surfaces of a liquid crystal cell, a macroscopic polarization is exhibited by ferroelectric SmC* phases. This effect is exploited in surface-stabilized ferroelectric liquid crystal displays (SSFLCDs).2,3
a smectic A (SmA) phase is present. An additional tilt of the molecules at the angle Θ leads to a SmC phase. The tilt-direction in a SmC phase can be controlled by an external electric field. When anchored between planar surfaces of a liquid crystal cell, a macroscopic polarization is exhibited by ferroelectric SmC* phases. This effect is exploited in surface-stabilized ferroelectric liquid crystal displays (SSFLCDs).2,3
SSFLCDs outperform liquid crystal displays based on nematic mesogens in terms of switching time and offer bistable modes of operation.2,3 However, the SSFLCD technology is limited to specific applications due to fabrication difficulties. The major problem is the layer contraction that occurs at the SmA–SmC transition due to tilting of the mesogens which can be rationalized by the rigid rod model (Fig. 1a).3 Buckling of the layers causes chevron structures, which lower the quality of the display. So-called zigzag defects at the boundary of domains with different fold directions are visible as image irregularities in the display. A possible solution to this problem is the use of materials with SmC phases with low or no layer contraction during cooling, which are called de Vries-like materials.3 This behavior is often explained by the diffuse cone model (Fig. 1b), where the SmA–SmC transition is characterized by a change from disorder to order according to seminal work by de Vries in 1979.4 It suggests that the molecules are already tilted in the SmA phase but have a random azimuthal distribution.5 During formation of the SmC phase the molecules tilt in the same direction, increasing the order while maintaining the layer spacing d. Experimental temperature-dependent XRD studies of compounds possessing a SmA phase at higher temperatures and a de Vries-like SmC phase at lower temperatures reveal that d passes through a minimum and increases again upon cooling in the SmC phase.3 The ratio between the lowest value of d and the layer spacing at the SmA–SmC transition dAC is defined as the maximum layer contraction lcmax. Both the rigid rod model and the diffuse cone model are ideal cases and usually a mixture of both cases is observed. Besides lcmax, the reduction factor R is defined to quantify the degree of de Vries-like behavior:6
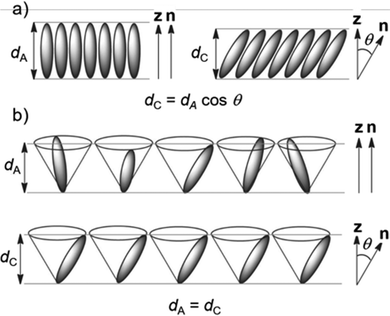 | ||
| Fig. 1 Models for the behavior during the SmA–SmC transition. (a) Rigid rod model and (b) diffuse cone model. Reproduced from ref. 9 with permission from the Royal Society of Chemistry. | ||
Roberts et al. claimed that a frustration between SmA and SmC promoting elements within one molecule establishes de Vries-like properties.7 In a more general approach, a combination of a low orientational order parameter S2 and very well-defined layers lead to the sought-after de Vries-like properties. Usually nano-segregating elements like perfluorated side chains,8 carbosilane5,9 units or ionic headgroups10 were chosen to acquire the necessary degree of translational order. However, materials with ordinary alkyl chains and very low lcmax have also been reported.11,12 The rapid availability and chemical inertness of those side chains renders them attractive for potential applications.
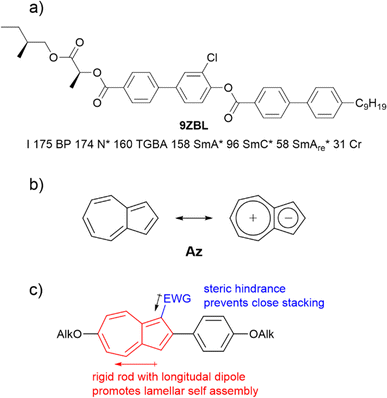
Frustration is an important concept not only in creating materials with de Vries-like properties. The appearance of re-entrant phases can also be explained by a frustration between different effects.13 Re-entrant phases form on cooling and are characterized by a less-ordered phase geometry than the corresponding higher temperature phase.14 Often, re-entrant phases appear in mixtures of liquid crystals.15,16 On the other hand, pure compounds with re-entrance behavior are also known.17–19 Orthogonal re-entrant phases following a tilted SmC phase are rare and limited to bent mesogenic dimers and rod-like molecules with permanent chirality.20,21 Novotná et al. found a SmA*–SmC*–SmA*re phase sequence for 9ZBL (Fig. 2a).14,22 Among a homologous series, the anomalous phase behavior did only occur for this derivative and was explained by the interaction of multiple effects such as dipolar interactions, packing arrangements and the rotational distribution of various conformers.14 It was further argued that the presence of multiple chiral centers might be important for the re-entrant phase. More recent studies showed that racemic mixtures with only one chiral center would also form the SmA re-entrance phase.23
Azulene Az has been highlighted as a potential candidate for numerous applications due to its optoelectronic properties.24–31 As a non-alternant isomer of naphthalene, azulene Az consists of a five-membered and a seven-membered ring (Fig. 2b). Owing to Hückel's rule, a zwitterionic resonance structure can be drawn which explains the dipole moment of 1.08 D. Embedded in a calamitic molecule, the polar aromatic motif improves translational order in smectic phases. Therefore, the soft crystalline SmE appears frequently in those systems.32–34 We recently described a series of 2-bromo-6-alkyloxyazulenes nO-Az-Br forming those highly ordered SmE phases.32 From these results we anticipated that lateral substitution at the azulene moiety should reduce the order within the layers while preserving the translational order induced by the phenyl azulene core (Fig. 2c). Adapting the concept of Lagerwall and Giesselmann this could result in de Vries behavior.3 Indeed, as detailed below azulene derivatives with de Vries behavior were identified. Surprisingly, one of the investigated compounds displayed a SmAre phase below the tilted SmC phase.
Results and discussion
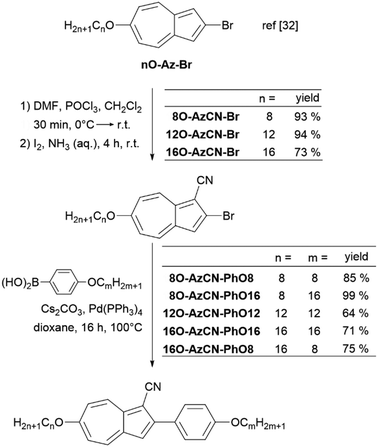
The synthesis of azulene target compounds is detailed in Fig. 3. Starting from the known 2-bromo-6-alkyloxyazulene nO-Az-Br,32 implementation of a nitril substituent in the 1-position of the azulene moiety was achieved via Vilsmeier–Haack reaction with DMF and POCl3, followed by direct oxidation with iodine in aqueous ammonia to yield nO-AzCN-Br (n = 8, 12, 16) in 73–94%.35 The target compounds nO-AzCN-PhOm were prepared by a Suzuki–Miyaura cross-coupling with arylboronic acids in 64–99% yield (n, m = 8, 12, 16).Fortunately, single crystal structures of all five compounds were obtained, allowing a close comparison between the solid state interactions. In the solid state structure of the shortest member 8O-AzCN-PhO8 (Fig. 4a) only little nanosegregation was observed. Thus, the alkyl side chains of a certain molecule are located between the aromatic units of neighboring molecules. Along the a axis phenylazulene cores are oriented in a syn-periplanar fashion, while neighboring phenylazulenes within the bc plane are oriented anti-periplanar. However, no dimers are formed. In contrast, for 8O-AzCN-PhO16 nanosegregation and interdigitation of side chains is clearly visible in the solid state (Fig. 4b). Phenylazulene cores are stacked along the b axis in a syn-periplanar fashion. Within the ac plane dimers are formed due to the non-classical hydrogen bond CN⋯H–C(azulene). In these dimers the phenylazulenes are oriented antiperiplanar with a parallel shift along the a axis (i.e. parallel to the long molecular axis) so that the dipole interaction between azulene moieties is maximized. For 12O-AzCN-PhO12 nanosegregation and interdigitation of alkyl chains is further improved (Fig. 4c). Phenylazulene cores are stacked along the a axis antiperiplanar and the nearest neighbors within such stack are shifted along the b axis (i.e. perpendicular to the long molecular axis), so that the π–π interaction of the phenyl ring is lost. Non-classical H-bonded dimers are formed within the bc plane. For 16O-AzCN-PhO8 nanosegregation and interdigitation of side chains is visible (Fig. 4d). Phenylazulene cores are stacked along the a axis in antiperiplanar manner. However, in contrast to the symmetrical derivative 12O-AzCN-PhO12 with C12 chains at both ends of the phenylazulene core, in 16O-AzCN-PhO8 nearest neighbors are stacked along the a axis in such a manner, that the 7-membered ring of the “upper” azulene core is positioned at the center of the “lower” azulene core, i.e. the connecting bond between 5- and 7-membered ring of the “lower” azulene. In addition, the H-bonded dimers are visible in the bc plane. For the symmetrical member 16O-AzCN-PhO16 with C16 chains on both ends perfect nanosegregation and interdigitation of alkyl chains was observed (Fig. 4e). Phenylazulene cores are oriented along the a axis in an syn-periplanar fashion, however the neighboring phenylazulenes are tilted with respect to each other, thus reducing π–π interactions. Clusters composed of four conformers including pseudo-dimers are formed in the bc plane. The unit cell of 16O-AzCN-PhO16 bears four independent molecules and crystallizes in the chiral space group P1.
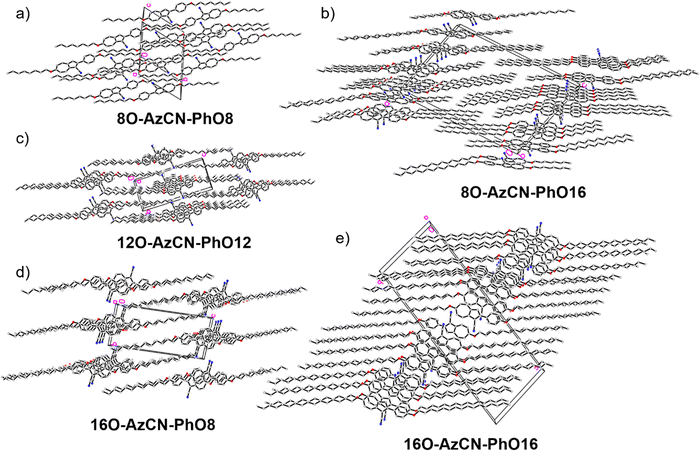 | ||
| Fig. 4 Single crystal structures of all compounds. (a), (c)–(e) View along the a axis and (b) view along the b axis. | ||
Mesomorphic properties were characterized first by polarizing optical microscopy (POM). All compounds showed Maltese crosses and fan textures when cooling down from the isotropic liquid. On further cooling, these textures changed to Schlieren and broken fans indicating a SmA–SmC phase sequence (see Fig. S8, ESI†).36 Phase transition temperatures were determined by differential scanning calorimetry (DSC). For 8O-AzCN-PhO8, an endothermic peak at 99 °C indicated the entrance into the mesophase (Table 1 and Fig. S6, ESI†). At 154 °C, 8O-AzCN-PhO8 cleared into the isotropic yield. Due to supercooling, crystallization was detected at 60 °C. The transition from the SmA to SmC phase was not visible in the thermogram for any compound and therefore was determined via POM. In the case of 8O-AzCN-PhO8, the SmC phase formed at 88 °C during cooling, thus only showing a monotropic phase. When extending the length of the chain at the phenyl ring from C8 to C16, transition temperatures of 8O-AzCN-PhO16 hardly changed. Clearing was observed at 148 °C and the monotropic SmA to SmC transition took place at 77 °C. 12O-AzCN-PhO12 melted at 90 °C and formed an enantiotropic SmC phase that changed into the SmA phase at 133 °C. Further elongation of the side chains to 16O-AzCN-PhO16 resulted in a lower clearing temperature at 139 °C. The SmA–SmC transition was detected at 135 °C, thus the phase width of the SmA phase was only 4 K. During heating, the transition temperatures of 16O-AzCN-PhO8 were smiliar to those of 12O-AzCN-PhO12. To our astonishment, during cooling a rare monotropic SmA re-entrance (SmAre) phase beneath the SmC phase was detected, leading to a SmA–SmC–SmA phase sequence (Fig. S7, ESI†).
| Compound | Transition temperatures/°C (and enthalpies/kJ mol−1) | |||||||||
|---|---|---|---|---|---|---|---|---|---|---|
| Heating/cooling rate: 5 K min−1, h: 2nd heating, c: 2nd cooling. Crystal-crystal transitions are not listed.a Determined via POM. | ||||||||||
| 8O-AzCN-PhO8 | Cr | 99 (31.8) | — | — | — | — | SmA | 154 (7.3) | I | h |
| Cr | 60 (−21.3) | — | — | SmC | 88a | SmA | 155 (−7.1) | I | c | |
| 8O-AzCN-PhO16 | Cr | 95 (51.4) | — | — | — | — | SmA | 148 (8.4) | I | h |
| Cr | 60 (−48.3) | — | — | SmC | 77a | SmA | 149 (−8.3) | I | c | |
| 12O-AzCN-PhO12 | Cr | 90 (31.8) | — | — | SmC | 133a | SmA | 149 (9.9) | I | h |
| Cr | 65 (−46.9) | — | — | SmC | 133a | SmA | 150 (−9.9) | I | c | |
| 16O-AzCN-PhO16 | Cr | 95 (62.6) | — | — | SmC | 135a | SmA | 138 (10.9) | I | h |
| Cr | 87 (−75.3) | — | — | SmC | 135a | SmA | 139 (−9.2) | I | c | |
| 16O-AzCN-PhO8 | Cr | 86 (41.0) | — | — | SmC | 133a | SmA | 151 (11.5) | I | h |
| Cr | 26 (−3.5) | SmAre | 78a | SmC | 133a | SmA | 151 (−11.9) | I | c | |
The layer spacing d as a function of temperature was measured by small angle X-ray scattering (SAXS) (Fig. 5). In the SmA phase, an increase of d with decreasing temperature is expected.7 However, 16O-AzCN-PhO16 displayed a linear correlation between T and d. This might be due to the small phase width of the observed orthogonal SmA phase. The phase might not have fully developed from the isotropic liquid before the transition to the SmC phase occurred. The monotropic SmC phases of 8O-AzCN-PhO8 and 8O-AzCN-PhO16 revealed typical rigid rod-like behavior with a linear layer shrinkage during cooling. In contrast, layer thicknesses of compounds 12O-AzCN-PhO12, 16O-AzCN-PhO16, and 16O-AzCN-PhO8 passed through a minimum and increased again. This behavior is typical for de Vries-like liquid crystals.7 In fact, an overcompensation of the tilt-caused layer shrinkage is observed in our case. The maximum layer contraction lcmax was as low as 0.16% for 16O-AzCN-PhO8 compared with d at the SmA–SmC-transition (Table 2). To the best of our knowledge this is the lowest value reported in the literature. Upon entering the SmAre phase, 16O-AzCN-PhO8 showed another discontinuity by changing back to a linear relation between d and T. This fits well with the SmAre phase observed by POM.
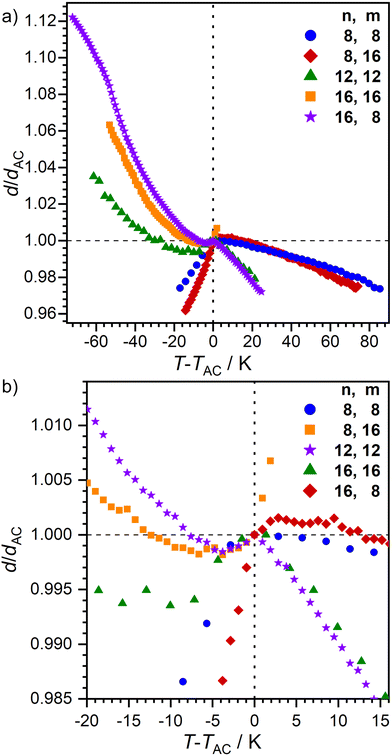 | ||
| Fig. 5 Plot of the relative layer spacing d/dAC as a function of T − TAC for nO-AzCN-PhOm. (a) Full size and (b) close to the SmA-C transition. | ||
The ratio between d and the molecular length L is usually between 0.95 and 1 for smectic monolayers due to orientational disorder within the layers.37 The compounds 8O-AzCN-PhO8 and 8O-AzCN-PhO16 that follow the rigid rod model have a low dAC/L ratio of 0.93 at the SmA–SmC transition (Table 2 and Fig. S9, ESI†). With dAC/L = 0.86, 12O-AzCN-PhO12 and 16O-AzCN-PhO8 are far out of the usual range. The ratio for 16O-AzCN-PhO16 is even lower (dAC/L = 0.78). This observation suggests that the all-trans-configuration is not present at the SmA–SmC transition at least for the de-Vries compounds.
Temperature dependent WAXS measurements were performed to ensure that the unusual phase of phase of 16O-AzCN-PhO8 was indeed a SmAre phase rather than a higher order orthogonal SmB phase (Fig. 6a). The absence of sharp reflexes in the wide-angle region confirms the proposed smectic phase without positional order in the layers. However, the halo in the partially orientated 2D WAXS diffractogram becomes sharper and more focused, indicating an increasing orientational order upon cooling (Fig. 6a and b). At short angles, higher ordered layer reflexes become more pronounced upon cooling, indicating an increase in translational order. It is worth noting that the third order diffraction peak of the layer spacing is stronger than the second order peak. In agreement with Davidson and Strzelecki, in such cases the electron density along the director ![[n with combining circumflex]](https://www.rsc.org/images/entities/i_char_006e_0302.gif) cannot be described with a single sinusoidal modulation.38 In our case, the second function might be assigned to the electron density of the nitrile substituent.
cannot be described with a single sinusoidal modulation.38 In our case, the second function might be assigned to the electron density of the nitrile substituent.
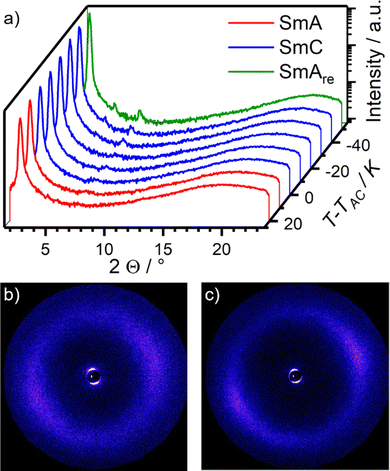 | ||
| Fig. 6 (a) Temperature dependent WAXS measurements of 16O-AzCN-PhO8. (b) 2D diffractogram of the WAXS measurement of the SmA phase at T − TAC = 20 K and (c) of the SmAre phase at T − TAC = −50 K. | ||
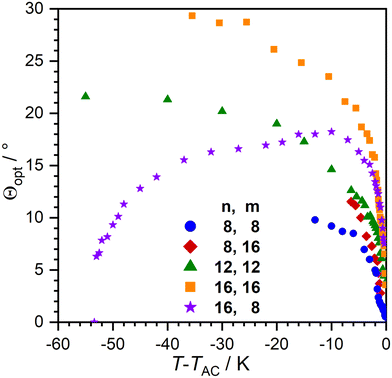
With the temperature dependent layer thickness in hand, we determined the optical tilt angle Θ as a function of T via POM in a glass cell with rubbed nylon layers (Fig. 7). Compounds with linear layer shrinkage in the SmC-phase showed smaller tilt angles compared to their de Vries-like behaving counterparts. 16O-AzCN-PhO16 had the largest tilt angle with Θ = 24° 10 K beneath the SmA–SmC transition. The optical tilt of 16O-AzCN-PhO8 with a SmA re-entrance phase peaked 10 K beneath the SmA–SmC transition and decreased while approaching the SmAre phase. Similar behavior was observed in an SmA–SmC-SmAre phase sequence reported by Novotná et al.22
With knowledge of Θ and lcmax, the R-value could be calculated (Table 2). The lowest value was achieved by 16O-AzCN-PhO16 with R = 0.14, which is similar to state of the art de Vries-like materials.10,11,39 The fact that longer side chains improve de Vries-like properties is in good accordance with a model by Merkel et al., who showed that the layer contraction caused by the tilting of the core can be compensated for only by increasingly ordered side chains.40
Ahmed et al. argued that the layer shrinkage caused by tilting of the molecule is compensated for either by a decrease in interdigitation and/or by an increase of orientational order within the layers.39 Since interdigitation plays only a minor role in smectic monolayers, compensation should arise through increasing order. The molecules do not have nanosegregating head groups that are commonly associated with de Vries-like behavior. They usually cause high translational order between the layers which compensate for a low order within the layers in the SmA phase. It might be argued that the dipolar azulene core mimics such a headgroup, therefore acting as a nanosegregating core.
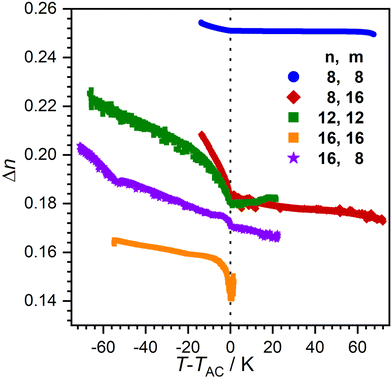
Order within the layers can be quantified by the nematic order parameter S2. Unfortunately, even after repeated attempts it was not possible to achieve completely orientated WAXS samples. Therefore, determination of S2via X-ray diffraction was not possible. Instead, we measured the birefringence Δn which is closely related to S2 using a Phi-Viz Imaging System (Polaviz, APSYS Inc.).3,5 As seen in Fig. 8, all compounds showed a discontinuity of Δn at the SmA–SmC transition, followed by a rise of Δn. 8O-AzCN-PhO8 showed the highest overall Δn, but only a small increase when entering the SmC phase. Since Δn is mainly caused by the aromatic moiety of the molecules, it is expected that the birefringence decreases with increasing chain length in the homologous series. As expected, 16O-AzCN-PhO16 has the lowest birefringence which, however, increases strongly after the SmA–SmC transition. Those observations suggest the compensation of the layer shrinkage through increasing order. However, 8O-AzCN-PhO16 also has a strong increase in Δn while following classic behavior. Furthermore, 16O-AzCN-PhO8 has the lowest lcmax while only showing a moderate increase in Δn. Therefore, it might be argued that the increasing S2 cannot be the only factor contributing to the observed compensation.
The X-ray data reported by Novotná et al. suggest, that compound 9ZBL behaves like a de Vries material (Fig. 2a), albeit with a moderate R-value of about 0.8 due to the low tilt angle.22 However, the qualitative behavior of d and Θ during the SmA–SmC–SmAre phase sequence is similar to our observations. They reasoned that quadrupolar ordering increases on cooling. With higher order the lateral chloro substituent of 9ZBL hinders closer packing. The system avoids the steric hindrance by a shift of mass centers and so, increases the layer spacing.14 Taking inspiration by Novotná et al., we propose a related packing model for 16O-AzCN-PhO8 in which the nitrile group sterically hinders the packing similar to the lateral chloro substituent in 9ZBL (Fig. 9). In addition, the nitrile group contributes a lateral dipole moment and enhances the dipole caused by the zwitterionic resonance structure of the azulene moiety. This combination of lateral and axial dipoles might be important for the strong increase in quadrupolar ordering on cooling. Re-entrance phases purely driven by steric frustration have been predicted.41 In our case the steric frustration is intrinsically entangled with dipole–dipole interactions since the nitrile is a key element to both. The reinforcement between those two effects might be crucial for the anomalous behavior.
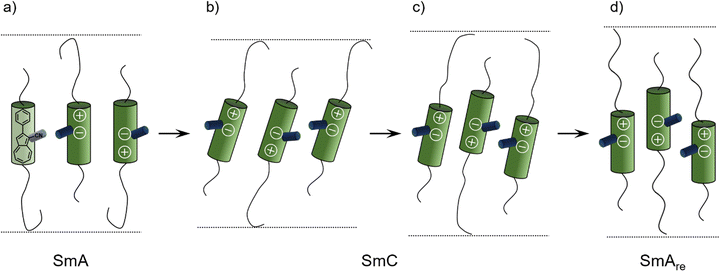 | ||
| Fig. 9 Proposed mechanism for the formation of the SmAre phase of 16O-AzCN-PhO8 due to a shift of mass centers based on a model by Novotná et al.14 (a) The SmA phase is present. (b) Tilting of the mesogens in the SmC phase leads to layer contraction. (c) A shift of mass centers is induced by the hindrance of the nitrile group and the layer thickness increases. (d) Mesogens lose their tilt in the SmAre phase, the layer thickness further increases. | ||
During the first SmA phase, the low d/L ratio of 16O-AzCN-PhO16 suggests that the long C16 chain is not present in the all-trans configuration (Fig. 9a). The entangled chain fills up the free volume left by the shorter C8 chain. The shift of mass centers slightly compensates for the different length of the side chains allowing the C16 chain to adopt a more linear configuration (Fig. 9d). This might be a reason why the SmAre phase is only present for 16O-AzCN-PhO8. In 8O-AzCN-PhO16, the shifting would further unbalance the already different chain lengths, thus the shifting seems not to take place. This might be the reason why classical behavior was observed for 8O-AzCN-PhO16. The active role of the side chains on the appearance of re-entrancy was also highlighted by Novotná.14
Although comparisons of single crystal structures with mesophase packing geometries should be handled with great care, solid structures might give some useful hints about the specific interactions relevant for the packing in the mesophase, particularly where solid state structures of a whole series are available. The solid state structure of 16O-AzCN-PhO8 in Fig. 5d resembles the model of the SmAre phase in Fig. 9d. As discussed above, the loss of the π–π interaction of the phenyl ring is compensated for by dipolar interactions, and strong van der Waals interactions of the interdigitated alkyl chains. In both, the mesophase and the crystalline phase subtle changes of the chain lengths lead to completely different behavior of the phase.
In summary, we synthesized a new class of liquid crystals based on the azulene core. These readily available compounds turned out to be potent de Vries-like materials with very low maximum layer shrinkages and R-values as low as 0.14 for 16O-AzCN-PhO16. The overcompensation of the layer shrinkage might be a useful property when creating mixtures with other de Vries behaving compounds in order to achieve minimal layer shrinkages. It was suggested that the layer shrinkage caused by the molecular tilt is compensated for not only by an increase of the molecular order, but also by a shift of mass center in the aromatic core. In the case of 16O-AzCN-PhO8 the frustration between shift of mass center, good van der Waals interaction, but reduced dipole and π–π interaction might have led to the orthogonal SmAre phase below the tilted SmC phase. The observations are in close analogy to the re-entrance phase of 9ZBL.14,22 However, in contrast to 9ZBL azulene compound 16O-AzCN-PhO8 does not have chiral centers, indicating that anomalous phase behavior can exist without chirality. These observations might lead to a new design principle for achiral liquid crystalline compounds showing re-entrant phases and de Vries behavior. Further work to understand this behavior in more detail is currently in progress and will be reported in due course.
Author contributions
FS and SL conceived and designed this research. FS and BW synthesized the compounds and did the liquid crystalline characterization. FS performed the X-ray and birefringence measurements. PN contributed their expertise to the evaluation of the results. WF performed and evaluated the single crystal measurements. FS wrote the first draft of the manuscript, SL PN and BW co-wrote the manuscript. All authors approved the final version of the manuscript.Conflicts of interest
There are no conflicts to declare.Acknowledgements
Generous financial support by the Deutsche Forschungsgemeinschaft, the Ministerium für Wissenschaft, Forschung und Kunst des Landes Baden-Württemberg, the Bundesministerium für Bildung und Forschung (shared instrumentation grant # 01 RI), the Carl-Schneider-Stiftung Aalen (shared instrument grant) is gratefully acknowledged. We would like to thank Frank Giesselmann, Nadia Kapernaum and Ilka Schwittlinsky for fruitful discussions and proof reading of the manuscript.References
- in Handbook of liquid crystals, J. W. Goodby, P. J. Collings, T. Kato, C. Tschierske, H. Gleeson and P. Raynes, ed., Wiley-VCH, Weinheim, 2., completely rev. and greatly enlarged ed., 2014, vol. 1 Search PubMed.
- N. A. Clark, M. A. Handschy and S. T. Lagerwall, Mol. Cryst., 1983, 94, 213–233 CrossRef CAS.
- J. P. F. Lagerwall and F. Giesselmann, ChemPhysChem, 2006, 7, 20–45 CrossRef CAS PubMed.
- A. de Vries, J. Chem. Phys., 1979, 71, 25–31 CrossRef CAS.
- Z. Ahmed, C. Müller, J. J. Johnston, K. Nguyen, C. P. J. Schubert, K. Abitaev, S. Marino, F. Giesselmann and R. P. Lemieux, Liq. Cryst., 2019, 46, 896–904 CrossRef CAS.
- M. D. Radcliffe, M. L. Brostrom, K. A. Epstein, A. G. Rappaport, B. N. Thomas, R. Shao and N. A. Clark, Liq. Cryst., 1999, 26, 789–794 CrossRef CAS.
- J. C. Roberts, N. Kapernaum, F. Giesselmann and R. P. Lemieux, J. Am. Chem. Soc., 2008, 130, 13842–13843 CrossRef CAS PubMed.
- J. P. F. Lagerwall, F. Giesselmann and M. D. Radcliffe, Phys. Rev. E: Stat., Nonlinear, Soft Matter Phys., 2002, 66, 031703 CrossRef PubMed.
- Q. Song, D. Nonnenmacher, F. Giesselmann and R. P. Lemieux, J. Mater. Chem. C, 2013, 1, 343–350 RSC.
- K. Bader, C. Müller, Y. Molard, A. Baro, P. Ehni, J. Knelles and S. Laschat, RSC Adv., 2020, 10, 23999–24016 RSC.
- H. K. Singh, S. K. Singh, R. Nandi, D. S. S. Rao, S. K. Prasad, R. K. Singh and B. Singh, RSC Adv., 2016, 6, 57799–57802 RSC.
- A. Sanchez-Castillo, M. A. Osipov, S. Jagiella, Z. H. Nguyen, M. Kašpar, V. Hamplovă, J. Maclennan and F. Giesselmann, Phys. Rev. E: Stat., Nonlinear, Soft Matter Phys., 2012, 85, 061703 CrossRef CAS PubMed.
- P. E. Cladis, R. J. Mandle and J. W. Goodby, in Handbook of Liquid Crystals, ed. J. W. Goodby, C. Tschierske, P. Raynes, H. Gleeson, T. Kato and P. J. Collings, Wiley-VCH Verlag GmbH & Co. KGaA, Weinheim, Germany, 2014, pp. 1–30 Search PubMed.
- V. Novotná, V. Hamplová, N. Podoliak, M. Kašpar, M. Glogarová, D. Pociecha and E. Gorecka, J. Mater. Chem., 2011, 21, 14807 RSC.
- P. E. Cladis, Phys. Rev. Lett., 1975, 35, 48–51 CrossRef CAS.
- S. Diele, G. Pelzl, A. Humke, S. Wünsch, W. Schäfer, H. Zaschke and D. Demus, Mol. Cryst. Liq. Cryst. Inc. Nonlinear Opt., 1989, 173, 113–119 CrossRef CAS.
- P. E. Cladis, R. J. Mandle and J. W. Goodby, Handbook of Liquid Crystals, John Wiley & Sons, Ltd, 2014, pp. 1–30 Search PubMed.
- W. Weissflog, G. Pelzl and D. Demus, Mol. Cryst. Liq. Cryst., 1981, 76, 261–268 CrossRef CAS.
- F. Hardouin and A. M. Levelut, J. Phys., 1980, 41, 41–46 CrossRef CAS.
- W. Weissflog, Ch Lischka, S. Diele, I. Wirth and G. Pelzl, Liq. Cryst., 2000, 27, 43–50 CrossRef CAS.
- C. Tschierske, Liq. Cryst., 2022, 49, 1043–1077 CrossRef CAS.
- V. Novotná, M. Glogarová, M. Kašpar, V. Hamplová, E. Gorecka, D. Pociecha and M. Cepic, Phys. Rev. E: Stat., Nonlinear, Soft Matter Phys., 2011, 83, 020701 CrossRef PubMed.
- V. Novotná, S. Stulov, M. Cigl, V. Hamplová, E. Gorecka and D. Pociecha, Liq. Cryst., 2020, 47, 1516–1527 CrossRef.
- J. Zhang and S. Petoud, Chem. – Eur. J., 2008, 14, 1264–1272 CrossRef CAS PubMed.
- Y. Zhou, Y. Zhuang, X. Li, H. Ågren, L. Yu, J. Ding and L. Zhu, Chem. – Eur. J., 2017, 23, 7642–7647 CrossRef CAS PubMed.
- E. Puodziukynaite, H.-W. Wang, J. Lawrence, A. J. Wise, T. P. Russell, M. D. Barnes and T. Emrick, J. Am. Chem. Soc., 2014, 136, 11043–11049 CrossRef CAS PubMed.
- H. Xin, C. Ge, X. Jiao, X. Yang, K. Rundel, C. R. McNeill and X. Gao, Angew. Chem., Int. Ed., 2018, 57, 1322–1326 CrossRef CAS PubMed.
- H. Xin, C. Ge, X. Jiao, X. Yang, K. Rundel, C. R. McNeill and X. Gao, Angew. Chem., 2018, 130, 1336–1340 CrossRef.
- F. Schwarz, M. Koch, G. Kastlunger, H. Berke, R. Stadler, K. Venkatesan and E. Lörtscher, Angew. Chem., Int. Ed., 2016, 55, 11781–11786 CrossRef CAS PubMed.
- F. Schwarz, M. Koch, G. Kastlunger, H. Berke, R. Stadler, K. Venkatesan and E. Lörtscher, Angew. Chem., 2016, 128, 11956–11961 CrossRef.
- T. Tsuchiya, R. Umemura, M. Kaminaga, S. Kushida, K. Ohkubo, S.-I. Noro and Y. Mazaki, ChemPlusChem, 2019, 84, 655–664 CrossRef CAS PubMed.
- F. Schulz, P. Ehni, B. Wank, A. Bauer, W. Frey and S. Laschat, Liq. Cryst., 2021, 48, 832–843 CrossRef CAS.
- S. Ito, M. Ando, A. Nomura, N. Morita, C. Kabuto, H. Mukai, K. Ohta, J. Kawakami, A. Yoshizawa and A. Tajiri, J. Org. Chem., 2005, 70, 3939–3949 CrossRef CAS PubMed.
- F. Schulz, S. Takamaru, T. Bens, J. Hanna, B. Sarkar, S. Laschat and H. Iino, Phys. Chem. Chem. Phys., 2022, 24, 23481–23489 RSC.
- S. Ushijima and H. Togo, Synlett, 2010, 1067–1070 CAS.
- I. Dierking, Textures of liquid crystals, Wiley-VCH, Weinheim, 1st edn, 2003 Search PubMed.
- A. De Vries, A. Ekachai and N. Spielberg, Mol. Cryst. Liq. Cryst., 1979, 49, 143–152 CrossRef CAS.
- P. Davidson and L. Strzelecki, Liq. Cryst., 1988, 3, 1583–1595 CrossRef CAS.
- C. P. J. Schubert, A. Bogner, J. H. Porada, K. Ayub, T. Andrea, F. Giesselmann and R. P. Lemieux, J. Mater. Chem. C, 2014, 2, 4581–4589 RSC.
- K. Merkel, A. Kocot, J. K. Vij, P. J. Stevenson, A. Panov and D. Rodriguez, Appl. Phys. Lett., 2016, 108, 243301 CrossRef.
- R. J. Mandle, N. Stock, S. J. Cowling, R. R. Parker, S. Hart, A. C. Whitwood and J. W. Goodby, Liq. Cryst., 2019, 46, 114–123 CrossRef CAS.
Footnote |
| † Electronic supplementary information (ESI) available: Synthetic protocols and characterization data, 1H and 13C NMR spectra for all new compounds. Liquid crystalline characterization (DSC, POM) and UV/Vis spectra for all investigated compounds are presented (pdf). CCDC 2215784, 2215785 and 2215787–2215789. For ESI and crystallographic data in CIF or other electronic format see DOI: https://doi.org/10.1039/d2ma01055k |
| This journal is © The Royal Society of Chemistry 2023 |


