Understanding photocatalytic hydrogen peroxide production in pure water for benzothiadiazole-based covalent organic frameworks†
Linyang
Wang
a,
Jiamin
Sun
a,
Maojun
Deng
a,
Chunhui
Liu
 a,
Servet
Ataberk Cayan
bc,
Korneel
Molkens
bc,
Pieter
Geiregat
bc,
Rino
Morent
d,
Nathalie
De Geyter
 d,
Jeet
Chakraborty
*a and
Pascal
Van Der Voort
 *a
*a
aCOMOC − Center for Ordered Materials, Organometallics and Catalysis, Department of Chemistry, Ghent University, Krijgslaan 281-S3, 9000 Ghent, Belgium. E-mail: jeet.chakraborty@ugent.be; pascal.vandervoort@ugent.be
bPhysics and Chemistry of Nanostructures, Department of Chemistry, Ghent University, Krijgslaan 281-S3, 9000 Ghent, Belgium
cNOLIMITS, Center for Non-Linear Microscopy and Spectroscopy, Ghent University, Krijgslaan 281-S3, 9000 Ghent, Belgium
dRUPT − Research Unit Plasma Technology, Department of Applied Physics, Ghent University, Sint-Pietersnieuwstraat 41 B4, 9000 Gent, Belgium
First published on 17th October 2023
Abstract
Photocatalytic production of hydrogen peroxide (H2O2) presents a promising and sustainable alternative to the current industrial anthraquinone route. Recent years have witnessed the emergence of covalent organic frameworks (COFs) as excellent photocatalysts, owing to their tunable band gaps, structural versatility and functional tunability. However, the current activity of COFs is limited and often relies on sacrificial agents to scavenge the holes in the photo-excited COFs. In this study, we introduce two benzothiadiazole-based COFs with tunable electronic structures and electron affinities for photocatalytic H2O2 production. The triazine-containing material, TAPT-BT-COF, exhibits outstanding charge separation and achieves a H2O2 production rate of 1360 ± 30 μmol h−1 gcat−1 in pure water, nearly twice as high as the benzene-containing TAPB-BT-COF (730 ± 30 μmol h−1 gcat−1). Moreover, TAPT-BT-COF demonstrates a remarkable apparent quantum efficiency of 4.9% at 420 nm. This study underscores the significance of framework conjugation and provides valuable insights for the design of advanced photocatalytic framework materials with efficient charge separation.
Introduction
Hydrogen peroxide (H2O2) is a vital chemical compound with widespread applications in pharmaceutical industries, water treatment, chemical synthesis, and even fuel cells for electricity generation.1–3 Currently, the industrial production of H2O2 relies on the anthraquinone method, which employs noble metals such as Pd, Pt, Ag, and Au as catalysts.4 However, this multistep process is highly energy-intensive and generates harmful catalytic waste, necessitating the development of environmentally friendly and energy-efficient techniques. Consequently, there is a growing research focus on the exploration of sustainable alternatives that can address these challenges.Recently, there has been significant attention directed towards photocatalytic production of hydrogen peroxide through the oxygen reduction reaction (ORR), primarily due to its utilization of clean resources such as oxygen, water, and sunlight.5 In this method, H2O2 is produced either via two successive single electron transfers as shown in eqn (1)–(2) or via a direct two-electron transfer ORR pathway as shown in eqn (3), where NHE is the normal hydrogen electrode.
| O2 + e− → O2˙− (E° = −0.33 V vs. NHE, pH = 7) | (1) |
| O2˙− + 2H+ + e− → H2O2 (E° = +0.91 V vs. NHE, pH = 7) | (2) |
| O2 + 2H+ + 2e− → H2O2 (E° = +0.28 V vs. NHE, pH = 7) | (3) |
In recent years, many photocatalysts have been designed for such H2O2 production, e.g., TiO2, graphic carbon nitride (g-C3N4), and metal–organic compounds and their derivatives.6–9 However, it has been observed that some of these photocatalysts exhibit challenges related to light-harvesting efficiency and photostability, which can impact their overall performance in H2O2 production.10 In this context, covalent organic frameworks (COFs) have emerged as a promising alternative owing to their remarkable ability to efficiently harvest visible light, their well-organized structure, exceptional chemical stability, customizable topology, and tunable bandgap properties. COFs have been employed in numerous photocatalytic applications such as hydrogen evolution,11 reduction of carbon dioxide,12 pollutants degradation,13 H2O2 production,14etc. Nevertheless, the full potential of COFs for photocatalytic H2O2 production is not yet well-explored.
In 2020, we reported the first successful utilization of COFs as photocatalysts for H2O2 production through ORR, employing N,N,N′,N′-tetrakis(4-aminophenyl)-1,4-phenylenediamine as the linker. Our initial findings demonstrated a maximum H2O2 production rate of (only) 97 μmol h−1 gcat−1.15 Subsequently, in 2023, we investigated the use of a biphasic system consisting of benzyl alcohol and water, which led to an enhanced activity of pyrene-based COFs for photocatalytic H2O2 production, effectively preventing undesired in situ decomposition. Furthermore, our study revealed the significant influence of the COF surface area and optimal decoration of pyrene units on the photocatalytic performance, resulting in a remarkable maximum H2O2 production rate of 1242 μmol g−1 h−1.16 Building upon these findings, in a subsequent publication, we demonstrated that extending the π-conjugation in COFs through post-synthetic sulfurization can significantly enhance their photocatalytic performance for H2O2 production as well.17
Around 30 papers have appeared since 2020 on the use of COFs as photocatalysts for H2O2, by ORR or the water oxidation reaction (WOR) or both. Some of these papers are briefly discussed below, others are summarized in Table S2.†
For instance, acetynyl triazine-based COFs,18 fluorinated COFs,14 vinylene-linked triazine-based COFs,19 bipyridine-based20,21 and Ni single-atom-based COFs22 were all explored for photocatalytic H2O2 production. These studies showed that COFs bearing a triazine unit exhibited a high H2O2 production performance. Still, a majority of studies uses sacrificial hole scavengers such as ethanol and benzyl alcohol, or metals to improve the H2O2 generation rate. In nitrogen heterocycle-based COFs, precise control of the nitrogen atom positions is important for photocatalytic performance. For example, Tp-Dz COFs with pyridazine units have higher efficiencies than the ones with pyrimidine and pyrazine units.23 A recent study involving 60 COFs made by mutually pairing 22 different linkers conducted by the Cooper group confirmed that triphenylbenzene or triphenyltriazine units displayed better photoactivity for H2O2 production due to their extended π-conjugation.24 Also, benzothiadiazole (BT) is a well-known chromophore and BT-based COFs have shown excellent photocatalytic activities in hydrogen evolution,25 organic transformations26 and dye degradation27 due to their highly efficient charge separation and strong electron affinity. In the TTF-BT-COF, the construction of the oxidation–reduction strategy achieved a H2O2 yield of 2760 μmol g−1![[thin space (1/6-em)]](https://www.rsc.org/images/entities/char_2009.gif) h−1, with the BT moieties acting as the O2 reduction sites for H2O2 production.28
h−1, with the BT moieties acting as the O2 reduction sites for H2O2 production.28
These studies collectively emphasize the importance of specific functional groups with their electron-donating or withdrawing properties, as well as the effects of their oxophilicity and hydrophilicity (or phobicity). Furthermore, they highlight the significance of structural alignment and overall surface area of the COFs in achieving efficient photocatalytic H2O2 production. Consequently, the next crucial step is to develop a comprehensive understanding of the materials' underlying structure–property relationships. This knowledge will enable the fine-tuning of their photophysical and electrochemical properties, ultimately facilitating sacrificial agent-free photocatalytic H2O2 production.
Drawing inspiration from this concept, our work places a specific emphasis on exploring the photo-responsive charge separation and transfer efficiency of COFs. By correlating these essential photophysical properties with the corresponding photocatalytic H2O2 production efficiency in pure water, we aim to establish a comprehensive structure–property relationship. To achieve this, we combined the beneficial features of the BT moiety (4,4′-(benzothiadiazole-4,7-diyl)dibenzaldehyde) with triphenyltriazine linker (1,3,5-tris-(4-aminophenyl) triazine (TAPT)) and triphenylbenzene linker (1,3,5-tris(4-aminophenyl) benzene (TAPB)) to produce two COFs, TAPT-BT-COF and TAPB-BT-COF. The presence of a triazine unit significantly influenced the efficiency of charge separation and transfer, thus leading to an augmented H2O2 formation rate.
Experimental section
Materials and characterization
The chemicals were bought from TCI Europe or Sigma-Aldrich and used as received. X-ray diffraction (XRD) was carried out on a Bruker D8 Advance diffractometer equipped with a Cu-Kα source (40 kV, 30 mA, λ = 1.5406 Å). Fourier transform infrared (FTIR) spectroscopy measurements were recorded on a Thermo Nicolet 6700 FTIR spectrometer. X-ray photoelectron spectroscopy (XPS) was conducted using a PHI 5000 VersaProbe II spectrometer equipped with a monochromatic Al Kα X-ray source (hν = 1486.6 eV). During analysis, the samples were excited with an X-ray beam (size: 200 μm) over an area of 500 × 500 μm2 at a power of 50 W. Wide range survey scans and high-resolution spectra were recorded with a pass energy of 187.85 eV and 23.5 eV and a step size of 0.8 eV and 0.1 eV respectively. All spectra were acquired at a take-off angle of 45° relative to the sample surface in the XPS chamber where the pressure was constantly maintained below 10−6 Pa. Nitrogen adsorption experiments were performed on a 3P instrument micropore analyzer. Before analysis, the samples were degassed at 120 °C for 24 h. The solid UV–vis absorption curve was obtained from diffuse reflectance spectra (DRS) measured on a Shimadzu UV-3101PC spectrophotometer. BaSO4 was used as the reflectance standard. Thermogravimetric analyses (TGA) were carried out on a Netzsch STA 449 F3 Jupiter instrument using a heating rate of 10![[thin space (1/6-em)]](https://www.rsc.org/images/entities/char_2009.gif) °C min−1 in an N2 atmosphere. Photoluminescence experiments were conducted on a spectrofluorometer (Edinburgh FLSP920), with a photomultiplier detector operating in the 200–900
°C min−1 in an N2 atmosphere. Photoluminescence experiments were conducted on a spectrofluorometer (Edinburgh FLSP920), with a photomultiplier detector operating in the 200–900![[thin space (1/6-em)]](https://www.rsc.org/images/entities/char_2009.gif) nm wavelength range at room temperature.
nm wavelength range at room temperature.
Synthesis of TAPT-BT-COF
TAPT-BT-COF was synthesized according to the literature using some minor modifications.25 A Pyrex tube (10 mL) was charged with 1,3,5-tris-(4-aminophenyl) triazine (TAPT, 17.72 mg 0.05 mmol), 4,4′-(benzothiadiazole-4,7-diyl) dibenzaldehyde (BT, 25.8 mg, 0.075 mmol, see synthesis in ESI†), and o-dichlorobenzene/n-butyl alcohol (1![[thin space (1/6-em)]](https://www.rsc.org/images/entities/char_2009.gif) :
:![[thin space (1/6-em)]](https://www.rsc.org/images/entities/char_2009.gif) 1 v/v, 1 mL). The resulting mixture was sonicated for 15 minutes to obtain a yellow suspension. Subsequently, 0.1 mL of acetic acid (6 M) was added. After sonicating for 5 minutes, the tube was flash-frozen at 77 K, degassed by three freeze-pump-thaw cycles, sealed and heated at 120 °C for 3 days. The collected yellow powder was washed with N,N-dimethylformamide (DMF), tetrahydrofuran (THF), acetone, and methanol, respectively and dried at 80 °C under vacuum for 12 h (∼63% isolated yield).
1 v/v, 1 mL). The resulting mixture was sonicated for 15 minutes to obtain a yellow suspension. Subsequently, 0.1 mL of acetic acid (6 M) was added. After sonicating for 5 minutes, the tube was flash-frozen at 77 K, degassed by three freeze-pump-thaw cycles, sealed and heated at 120 °C for 3 days. The collected yellow powder was washed with N,N-dimethylformamide (DMF), tetrahydrofuran (THF), acetone, and methanol, respectively and dried at 80 °C under vacuum for 12 h (∼63% isolated yield).
Synthesis of TAPB-BT-COF
A Pyrex tube (10 mL) was charged with 1,3,5-Tris(4-aminophenyl) benzene (TAPB, 17.57 mg 0.05 mmol), BT (25.8 mg,0.075 mmol), and o-dichlorobenzene/n-butyl alcohol (1![[thin space (1/6-em)]](https://www.rsc.org/images/entities/char_2009.gif) :
:![[thin space (1/6-em)]](https://www.rsc.org/images/entities/char_2009.gif) 1 v/v, 1 mL). The mixture was sonicated for 5 minutes to obtain a yellow suspension. Subsequently, 0.1 mL of acetic acid (6 M) was added. The tube was flash-frozen at 77 K and degassed by three freeze-pump-thaw cycles. Hereafter, the tube was sealed and heated at 120 °C for 3 days. The collected yellow powder was washed with DMF, THF and methanol, respectively. The product was dried at 80 °C under vacuum for 12 h to obtain the corresponding yellow powder in ∼75% isolated yield.
1 v/v, 1 mL). The mixture was sonicated for 5 minutes to obtain a yellow suspension. Subsequently, 0.1 mL of acetic acid (6 M) was added. The tube was flash-frozen at 77 K and degassed by three freeze-pump-thaw cycles. Hereafter, the tube was sealed and heated at 120 °C for 3 days. The collected yellow powder was washed with DMF, THF and methanol, respectively. The product was dried at 80 °C under vacuum for 12 h to obtain the corresponding yellow powder in ∼75% isolated yield.
Photoelectrochemical measurements
The photoelectrochemical measurements were performed on a computer-controlled electrochemical workstation (BioLogic VSP Potentiostat) in a standard three-electrode system using a Pt plate and a saturated Ag/AgCl electrode (in 1 M KCl) as the counter and reference electrode, respectively. The COF was used as the working electrode and a Na2SO4 solution (0.1 M) was applied as the electrolyte. A 300 W Xe lamp (filtered to λ > 420 nm) was used as the visible light source. Fluorine-doped tin oxide (FTO) glasses were cleaned by sonication in ethanol for 30 min and dried at 85 °C for 24 h. 5 mg of the COF sample was dispersed in 1 mL ethanol and sonicated for 20 min to get a slurry, which was coated afterwards on the piece of FTO glass (1 × 1 cm2). The FTO glass coated with the sample was dried in air (see details in ESI†).Photocatalytic experiment
The photocatalytic H2O2 production experiments were carried out in a 20 ml sealed glass vial. 5 mg of the photocatalyst was dispersed in 10 ml Milli-Q water to form a homogeneous suspension. The resulting mixture was bubbled with oxygen and stirred in the dark for 30 min to obtain an adsorption–desorption equilibration environment before irradiation with a 300 W Xenon lamp (λ > 420 nm). The temperature was maintained at 25 °C using a condenser. The distance between the reactor and the lamp was set at 15 cm, the stirring speed was kept at 800 rpm.Results and discussion
Structure characterization
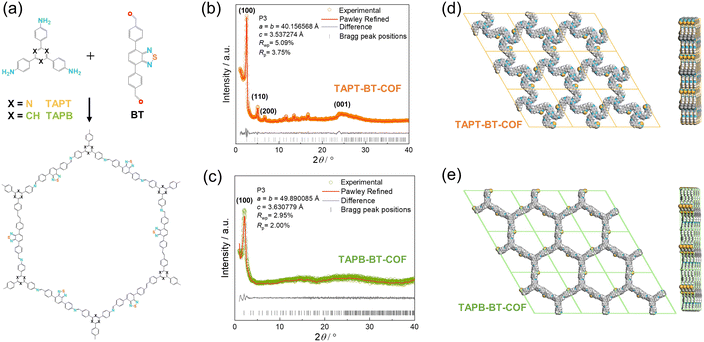
TAPT-BT-COF and TAPB-BT-COF were synthesized under conventional solvothermal conditions. To confirm the crystallinity of the synthesized COFs, the powder X-ray diffraction (PXRD) pattern was measured and compared against theoretical simulations (Fig. 1). As seen in Fig. 1b and c, the PXRD patterns of both COFs show highly intense diffractions, suggesting a high crystallinity. The PXRD of TAPT-BT-COF possesses an intense peak at 2θ = 2.5° assigned to the (100) plane, and diffraction peaks at 5.1, 6.7, and 11.6° (2θ), which originate from the (200), (210), (140) planes, respectively. The broad peak at 2θ = 24.5° suggests the formation of two-dimensional layers through π–π stacking. In comparison, the position of the first intense peak of TAPB-BT-COF is located at 2θ = 2.0°, which indicates that the two COFs have different crystal structures. Subsequently, the structure of the two crystalline COFs was verified by structureless profile fits (Pawley refinement) of the PXRD patterns. The Pawley refinement (red curves) is in excellent agreement with the peak assignment (Fig. 1b and c). We have simulated the most frequently observed stacking models (AA, AA-d, AB, ABC, eclipsed, etc.) and the simulated AA-d stacking model corresponds the best to the experimentally obtained PXRD profile of TAPT-BT-COF (Fig. 1e, S2-S8). The “d” in “AA-d” refers to some distortions in the regular AA stacking, particularly in the hexagonal pores of the material. This means that while the layers are largely organized directly above one another, there may be some slight deviations or distortions from this perfect alignment, particularly in the regions of the material where the hexagonal pores are located.29 And the AA stacking model corresponds well to the PXRD profile of TAPB-BT-COF (Fig. 1e), indicating that both COFs crystallized in eclipsed stacking mode but possess different structures with different penetrating pores.The detailed chemical composition and structure of both COFs was investigated using FTIR and XPS. As shown in Fig. S9,† compared to the pristine monomers, a new peak appeared at 1621 cm−1 in the FTIR spectra of both COFs, which can be attributed to the C![[double bond, length as m-dash]](https://www.rsc.org/images/entities/char_e001.gif) N stretching. This indicates the formation of imine linkages. In addition, retention of the characteristic N–S (890 cm−1) stretching bonds in the spectra of the synthesized COFs confirmed the preservation of the benzothiadiazole functional group. As presented in Fig. 2, The XPS survey spectra of TAPT-BT-COF and TAPB-BT-COF show the presence of C, N and S. The high-resolution C 1s XPS spectrum of TAPT-BT-COF can be deconvoluted into four peaks with binding energies at 287.3, 286.4, 285.5 and 284.9 eV, which can be assigned to the C
N stretching. This indicates the formation of imine linkages. In addition, retention of the characteristic N–S (890 cm−1) stretching bonds in the spectra of the synthesized COFs confirmed the preservation of the benzothiadiazole functional group. As presented in Fig. 2, The XPS survey spectra of TAPT-BT-COF and TAPB-BT-COF show the presence of C, N and S. The high-resolution C 1s XPS spectrum of TAPT-BT-COF can be deconvoluted into four peaks with binding energies at 287.3, 286.4, 285.5 and 284.9 eV, which can be assigned to the C![[double bond, length as m-dash]](https://www.rsc.org/images/entities/char_e001.gif) N in BT, triazine and imine, and aromatic sp2 carbon, respectively.25 In contrast, TAPB-BT-COF did not show any XPS peak for the C
N in BT, triazine and imine, and aromatic sp2 carbon, respectively.25 In contrast, TAPB-BT-COF did not show any XPS peak for the C![[double bond, length as m-dash]](https://www.rsc.org/images/entities/char_e001.gif) N in triazine, whereas the C
N in triazine, whereas the C![[double bond, length as m-dash]](https://www.rsc.org/images/entities/char_e001.gif) N of the BT unit appeared at 286.8 eV. This 0.5 eV shift with respect to TAPT-BT-COF inferred that the electron affinity of BT is weaker in TAPB-BT-COF than in TAPT-BT-COF. In the N 1s region of the TAPT-BT-COF, three peaks appearing at 398.6, 399.4, and 400.3 eV can be attributed to the Ns of triazine rings, BT and imine bonds, respectively. Compared to that, TAPB-BT-COF possessed only two peaks at binding energies 399.5 and 400.5 eV arising from the Ns in BT and imine C
N of the BT unit appeared at 286.8 eV. This 0.5 eV shift with respect to TAPT-BT-COF inferred that the electron affinity of BT is weaker in TAPB-BT-COF than in TAPT-BT-COF. In the N 1s region of the TAPT-BT-COF, three peaks appearing at 398.6, 399.4, and 400.3 eV can be attributed to the Ns of triazine rings, BT and imine bonds, respectively. Compared to that, TAPB-BT-COF possessed only two peaks at binding energies 399.5 and 400.5 eV arising from the Ns in BT and imine C![[double bond, length as m-dash]](https://www.rsc.org/images/entities/char_e001.gif) N linkages. The result distinguishes the two COFs very well. On the other hand, the high-resolution S 2p XPS spectrum of both COFs showed typical doublets (at 165.7 and 166.9 eV), which is characteristic of the benzothiadiazole ring.30 These XPS data further confirmed the successful synthesis of the two COFs, endorsing the FTIR data. The porosity of the TAPT-BT-COF and TAPB-BT-COF was evaluated by nitrogen adsorption measurements at 77 K (Fig. S10 and S11†). The Brunauer–Emmett–Teller (BET) surface area of TAPT-BT-COF and TAPB-BT-COF is 186 and 80 m2 g−1, respectively. Moreover, the pore size distribution obtained by the Quenched-Solid Density Functional Theory method (QSDFT) revealed that the average pore size of TAPT-BT-COF is 2.8 nm, while TAPB-BT-COF possessed an average pore size of 4.1 nm. These results further confirm the theoretically obtained pore size distributions calculated from the structure model.
N linkages. The result distinguishes the two COFs very well. On the other hand, the high-resolution S 2p XPS spectrum of both COFs showed typical doublets (at 165.7 and 166.9 eV), which is characteristic of the benzothiadiazole ring.30 These XPS data further confirmed the successful synthesis of the two COFs, endorsing the FTIR data. The porosity of the TAPT-BT-COF and TAPB-BT-COF was evaluated by nitrogen adsorption measurements at 77 K (Fig. S10 and S11†). The Brunauer–Emmett–Teller (BET) surface area of TAPT-BT-COF and TAPB-BT-COF is 186 and 80 m2 g−1, respectively. Moreover, the pore size distribution obtained by the Quenched-Solid Density Functional Theory method (QSDFT) revealed that the average pore size of TAPT-BT-COF is 2.8 nm, while TAPB-BT-COF possessed an average pore size of 4.1 nm. These results further confirm the theoretically obtained pore size distributions calculated from the structure model.
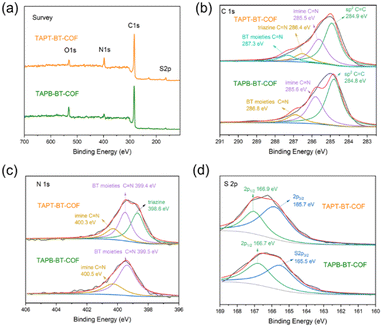 | ||
| Fig. 2 XPS spectra of the TAPT-BT-COF and TAPB-BT-COF: (a) survey; (b) C 1s; (c) N 1s; and (d) S 2p. | ||
The thermal stability of the COFs was investigated using TGA. Both samples were stable up to 500 °C under a nitrogen atmosphere and stable up to 350 °C under air (Fig. S12†), proving their high thermal stability. On the other hand, the morphologies and elemental distribution of TAPT-BT-COF and TAPB-BT-COF were revealed by transmission electron microscopy (TEM) and scanning transmission electron microscopy energy-dispersive X-ray spectroscopy (STEM-EDS) elemental mapping (see details in ESI†). Both COFs show nanowire structures (Fig. S13†) and the elements C, N and S are uniformly distributed (Fig. S14 and S15†).
Optical and electrochemical properties
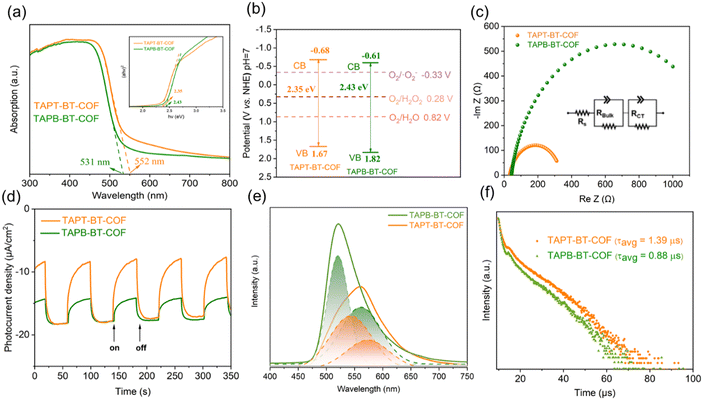
The optical properties of the photocatalysts are of paramount importance for their catalytic performance. Initially, the optical absorptions of the COFs were investigated by UV-vis DRS (Fig. 3a). Both COFs showed a strong visible light absorption capability. The absorption edges of TAPT-BT-COF and TAPB-BT-COF were 552 and 531 nm, respectively. The slight redshift in the absorption edge of TAPT-BT-COF compared to that of TAPB-BT-COF indicated a better visible light absorption ability of the former. Moreover, a broadening and red-shift in the photo-absorption tail of TAPT-BT-COF around 550–650 nm range compared to its phenyl analogue was observed. This further suggested that the triazine containing COF manifests a subset of charged species that have a lower band gap oscillator strength, i.e., a higher degree of excited state charge separation efficiency, which would be beneficial for photocatalysis. An augmented framework conjugation in the TAPT-BT over TAPB-BT can be ascribed as the reason behind this observation. The optical band gaps (EBG) of TAPT-BT-COF and TAPB-BT-COF were calculated to be 2.35 and 2.43 eV, respectively from the corresponding Tauc plots. Mott–Schottky (M–S) analyses were conducted to obtain the conduction band potentials of both COFs at their respective isoelectric points (Fig. S16, see details in ESI†). As depicted in Fig. S17 and S18,† the positive slope indicated that both COFs are n-type semiconductors, justifying their use in ORR. The flat-band potentials (EFB) of TAPT-BT-COF and TAPB-BT-COF were calculated to be −0.88 and −0.81 V vs. Ag/AgCl (−0.68 and −0.61 V vs. NHE) respectively. Based on these, the valence band (VB) position of TAPT-BT-COF and TAPB-BT-COF were calculated to be 1.67 and 1.82 V (vs. NHE), respectively (Fig. 3b). Evidently, the conduction band (CB) values of the synthesized COFs were more negative than −0.33 V and 0.28 V (vs. NHE), indicating that they are thermodynamically capable of producing H2O2via a direct or indirect 2e− ORR pathway. On the other hand, the VB potentials were also thermodynamically suitable for oxidizing water to O2, thereby completing the redox cycle. Hence, both COFs can theoretically be used as effective photocatalysts for the photo-production of H2O2 from pure water.Furthermore, the charge transfer rates and the separation efficiency of the photogenerated electrons and holes were analyzed by impedance spectroscopy (EIS) and transient photocurrent response (TPR) measurements (see details in ESI†). As illustrated in Fig. 3c, the TAPT-BT-COF shows a smaller semicircular radius of the Nyquist curve compared to TAPB-BT-COF. This indicates a lower interfacial charge transfer resistance of TAPT-BT-COF, which is more favorable to electron and hole transfer. The impedance spectra were fitted using the equivalent Randle circuit Rs + (QBulk/RBulk) + (QCT/RCT), where Rs is the solvent resistance, RBulk is the bulk resistance, and RCT is the charge transfer resistance. The RCT value of TAPT-BT-COF (299 Ω) was much lower than in the case of TAPB-BT-COF (1255 Ω) (Table S1†). The transient photocurrent density of TAPT-BT-COF was also recorded to be higher than in the case of TAPB-BT-COF (Fig. 3d). In general, the photocurrent response intensity is positively correlated to the separation efficiency of the photogenerated electrons and holes. This result confirms that TAPT-BT-COF prevents the recombination of charge pairs to a great extent, which is in good agreement with the results obtained from the EIS and UV-vis measurements, and a justifiable due to the enhanced framework conjugation.
To further endorse these results, photoluminescence (PL) spectra and the fluorescence lifetime decay profile of both COFs were determined. As seen in Fig. 3e, the emission peak maximum of TAPB-BT-COF appeared at 523 nm. Compared to that, TAPT-BT-COF exhibited a red shift (35 nm) and quenched intensities (40%), suggesting lower recombination of photogenerated carriers. The PL peaks can be further deconvoluted into two segments, one centering around 520 nm and the other one significantly redshifted. This indicated the simultaneous existence of two recombination processes.
To better understand the photoexcited charge recombination mechanism and assess the potential for efficient charge separation, the lifetime of the PL decay was measured. A longer lifetime is generally considered beneficial for photocatalysis as it implies a greater chance for charge carriers to participate in chemical reactions. The fluorescence lifetime decay profile (Fig. 3f) revealed two distinct decay patterns, characterized by faster decay constants (τ1) and relatively slower ones (τ2). The values of τ1 were calculated to be 1.18 μs for TAPT-BT-COF and 0.87 μs for TAPB-BT-COF, while the τ2 values were 9.42 μs and 8.22 μs, respectively. These longer lifetimes (τ2) in the microsecond range indicate significant phosphorescence in both COFs. The presence of a significant phosphorescent component suggests that the materials possess a higher population of triplet excitons, resulting in a more efficient singlet-to-triplet intersystem charge transfer. Importantly, the triazine-containing COF (TAPT-BT-COF) exhibits a higher efficiency in this process compared to its benzene-based counterpart (TAPB-BT-COF). It is worth noting that the existence of a triplet state in BT is well-documented in the literature, which further supports these observations.31,32
For a detailed understanding of the excited state charge dynamics in this material, we further analyzed TAPT-BT-COF by femtosecond transient absorption (TA) spectroscopy and correlated the obtained data with the UV-vis DRS and PL results. As shown in Fig. 4a, the TA map is dominated by a spectrally shaped and transiently decaying photo-induced absorption feature (ΔA > 0), which gradually depleted from 2 to 1000 ps. This wavelength range corresponds well to the charge separation band observed in the UV-vis spectra of TAPT-BT and its PL maximum, which translates as the ground state bleaching of the COF in TA spectra. Furthermore, two excited state absorbance (ESA) peaks were observed at around 675 nm 800 nm in the TA spectra. Considering the high charge transfer efficiency of the material, as already substantiated using other photo-electrochemical analysis, the peak at 675 nm can be ascribed to a probable strong ESA of the excited TAPT-COF radical cation,33,34 whereas the further low-energy one at 800 nm is originating plausibly from the thermal relaxation of the ESA. As shown in Fig. 4, the peak at 800 nm decreased rapidly in a femtosecond scale (τ0 = 650 fs), which can justify the small energy requirement of the thermal relaxation of the ESA. The ESA peak then gradually decayed in a two-component exponential fashion with lifetimes of 5.6 ps (τ1) and 150 ps (τ2), respectively. These two-components can be explained considering that τ1 is possibly originating from the inter-system crossing in BT, whereas τ2 is due to direct quenching of the ESA. The TA analysis together with UV-vis, PL, and the electrochemical analysis endorsed the superiority of TAPT-BT-COF as a photocatalytic material.
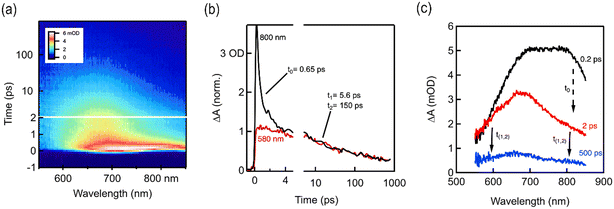 | ||
| Fig. 4 (a) fs-TA contour spectra of TAPT-BT-COF (b) fs-TA kinetics and the corresponding fitting results (c) fs-TA contour spectra of TAPT-BT-COF at different time scale showing the time constants. | ||
Photocatalytic activity
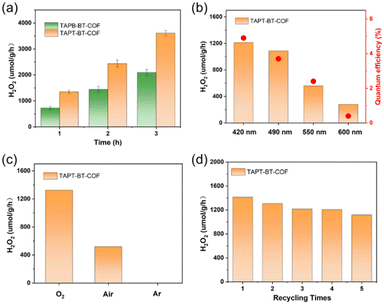
The photocatalytic H2O2 production was carried out under visible light irradiation. As shown in Fig. 5a, in the absence of any sacrificial agents, both COFs showed photoactivity with H2O2 generation rates of 1360 ± 30 and 730 ± 30 μmol h−1 gcat−1 in pure water for TAPT-BT-COF and TAPB-BT-COF respectively. The amount of H2O2 increased steadily on prolonging the irradiation time. It is worth noting that the H2O2 production rate of TAPT-BT-COF is either comparable or has surpassed most of the similar materials reported to date (Table S2†). The higher H2O2 formation by TAPT-BT-COF can be justified by considering the enhanced charge separation and transfer efficiency of the material. The hydrogen peroxide production performance and the apparent quantum yield (AQY, see details in ESI†) of TAPT-BT-COF were measured under different irradiation wavelengths as well (Fig. 5b). It showed a remarkable apparent quantum efficiency of 4.9% at 420 nm, and the hydrogen peroxide production rate reached 1214 μmol h−1 gcat−1. On increasing the wavelength from 420 nm, a noticeable decrease in the H2O2 generation activity was observed. As the COF has only a nominal photo-absorbance at higher wavelengths, this observation is understandable. Furthermore, the stability of the TAPT-BT-COF was studied through recycling experiments (Fig. 5d). The H2O2 production rate of the TAPT-BT-COF only showed a slight decrease in activity after successive runs. Furthermore, PXRD (Fig. S20 and S21†) and FTIR (Fig. S22 and S23†) analysis were performed after catalysis to verify the stability of the TAPT-BT-COF material. The minor changes in both spectra indicate that the crystallinity and the chemical structure of the TAPT-BT-COF remained intact after photocatalysis.To investigate the mechanism of H2O2 production, a series of control experiments were carried out using TAPT-BT-COF as the probe catalyst. As shown in Fig. 6a, no hydrogen peroxide was detected when the reaction was carried out in the dark, suggesting the need of light for the catalytic process. As shown in Fig. 5c, TAPT-BT-COF showed the highest H2O2 production rate in the presence of pure O2. In air, a significant decrease in the hydrogen peroxide production rate is observed while there was no H2O2 production in the presence of Ar. These results suggest that O2 is required for photocatalytic H2O2 production. Furthermore, the H2O2 production was evaluated by introducing different scavengers into the reaction system, including tert-butyl alcohol (TBA, ·OH scavenger), benzoquinone (BQ, electron scavenger) and ethanol (hole scavenger). When BQ was introduced into the reaction system, the H2O2 production was completely quenched. This suggested that BQ quenched the excited electron and thereby suppressed the generation of O2˙–, which, in turn, reduced H2O2 formation. When combined with the effect of O2, this observation emphasized the significant role of electrons in the photocatalytic ORR. In contrast, the presence of TBA did not influence the H2O2 formation, indicating that ·OH radicals did not participate in the photocatalysis. When ethanol was added as a hole scavenger, a noticeable increase in the H2O2 production rate was observed. Based on these results, we can conclude that H2O2 is produced at the CB via a stepwise two-electron ORR route (O2 → ·O2− → H2O2). WOR is the only possible counter-reaction to complete the redox process in pure water. To confirm the WOR, TAPT-BT-COF and AgNO3 (as an electron scavenger) were added to water and the entire reaction system was placed under an N2 atmosphere to suppress the ORR and enhance the counter oxidation. After 6 hours of irradiation, only O2 was detected (Fig. S24†). This proves that the reaction at VB is the water oxidation to O2. Based on these results a plausible reaction mechanism is proposed in Fig. 6b. Upon visible light irradiation, the photoexcited COF generates electron–hole pairs. The photogenerated electrons of the COF migrate from VB to CB leaving holes in the VB. The electron-deficient VB then oxidizes water to generate oxygen and a proton. At the same time, electron-rich CB reduces the oxygen to produce O2˙−, which takes up protons from the medium to form H2O2.
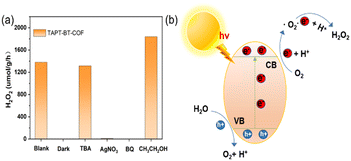 | ||
| Fig. 6 Mechanism studies. (a) Photocatalytic H2O2 production of TAPT-BT-COF under different conditions. (b) Schematic diagram of the catalytic reaction mechanism. | ||
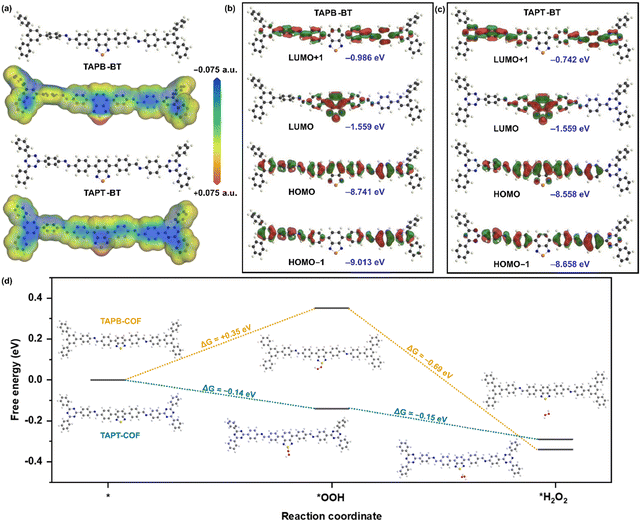
We performed further theoretical calculations to better understand the photocatalytic behavior of the COFs. The Density Functional Theory (DFT) optimised molecular analogue of both COFs provided interesting insights. The total electron density of the materials mapped for their potential energy surface showed that the S-atom of BT is the most active center in both COFs (Fig. 7a). This indicated that the sulfur of BT would function as the catalytic center in a reaction. Accordingly, the HOMO (Highest Occupied Molecular Orbital)-LUMO (Lowest Unoccupied Molecular Orbital) distribution also showed that the LUMO is mostly located on the BT for both compounds with similar energy values, whereas the HOMO is delocalized over the entire repeating unit and has significantly different energies for the two materials (Fig. 7b and c). For the triazine-containing unit, the HOMO energy is lower than in the case of TAPB. This led to a higher bandgap of TAPB-BT than TAPT-BT, which agreed well with the experimental bandgap and photophysical property trend. Moreover, in line with the potential energy surface mapped total electron density, these results also suggested that ORR would take place on the BT, more specifically on the S-center of the BT.
With this knowledge and the experimental observation that the H2O2 production progressed via stepwise electron transfer, we calculated the theoretical free energies of the reaction for both TAPB-BT-COF and TAPT-BT-COF. As shown in Fig. 7d, the change in free energy during the first electron transfer to generate the superoxide intermediate at the S-center of the BT (*OOH) was found to be +0.35 eV and −0.14 eV for TAPB and TAPT respectively, whereas that for the second electron transfer (*H2O2) is −0.69 eV and −0.15 eV. This suggested that both electron transfers during ORR are thermodynamically favorable for the triazine containing COF, whereas the first step is thermodynamically uphill for TAPB-BT-COF justifying the better catalytic performance of the former. This further endorsed our claimed correlation between the catalytic activity and photo-physical properties of the COFs.
Conclusions
In summary, two BT-based COFs, containing phenyl and triazine nodes, respectively, were synthesized and their photophysical and electrochemical properties were thoroughly studied. The triazine-containing COF manifested superior photo-induced charge separation and many-fold diminished recombination. The materials were investigated for sacrificial agent-free photocatalytic H2O2 production from water. The results showed that the triazine-based COF significantly outperformed the phenyl analogue, which is attributed to the better photophysical properties of the former. This study revealed the importance of framework conjugation for metal-free materials and provides insights into the design of advanced photocatalytic framework materials for augmented charge separation.Author contributions
Linyang Wang: conceived the idea, designed the experiments and wrote the original draft. Jiamin Sun performed the data analysis, wrote and edited the draft. Maojun Deng: zata-potential measurement. Chunhui Liu conducted the fluorescence emission and decay time measurements. Servet Ataberk Cayan, Korneel Molkens, and Pieter Geiregat conducted the transient absorption (TA) spectroscopy measurement and analyzed the data. Rino Morent and Nathalie De Geyter conducted X-ray photoelectron spectroscopy (XPS) experiments and data analysis. Jeet Chakraborty performed the DFT calculation and revised the manuscript. Pascal Van Der Voort: funding acquisition, data analysis, and manuscript revision. All authors contributed to the revision and editing of the manuscript.Conflicts of interest
There are no conflicts to declare.Acknowledgements
L.-Y. Wang, J.-M. Sun, M.-J. Deng, and C.-H. Liu gratefully acknowledge the Chinese Scholarship Council (CSC) for financial support (No. 202108110055, 201908110280, 202107565003, 201906060159). J. Chakraborty acknowledges financial support from UGent (BOF.PDO.2022.0032.01). P. Van Der Voort acknowledges the Flemish Research Foundation (FWO Vlaanderen) for financial support via project G020521N, and for the Hercules Project AUGE/17/07 for the UV VIS DRS spectrometer and UGent BASBOF BOF20/BAS/015 for the powder X-Ray Diffractometer. The authors thank Katrien Haustraete for helping with the TEM measurements, and Ghent University for funding.References
- K. Mase, M. Yoneda, Y. Yamada and S. Fukuzumi, Nat. Commun., 2016, 7, 11470 CrossRef CAS PubMed.
- M. Melchionna, P. Fornasiero and M. Prato, Adv. Mater., 2019, 31, 1802920 CrossRef PubMed.
- Y. Shiraishi, T. Takii, T. Hagi, S. Mori, Y. Kofuji, Y. Kitagawa, S. Tanaka, S. Ichikawa and T. Hirai, Nat. Mater., 2019, 18, 985–993 CrossRef CAS PubMed.
- J. M. Campos-Martin, G. Blanco-Brieva and J. L. G. Fierro, Angew. Chem., Int. Ed., 2006, 45, 6962–6984 CrossRef CAS PubMed.
- X. Zeng, Y. Liu, X. Hu and X. Zhang, Green Chem., 2021, 23, 1466–1494 RSC.
- Y. Ding, S. Maitra, S. Halder, C. Wang, R. Zheng, T. Barakat, S. Roy, L.-H. Chen and B.-L. Su, Matter, 2022, 5, 2119–2167 CrossRef CAS.
- B. Zhu, B. Cheng, J. Fan, W. Ho and J. Yu, Small Struct., 2021, 2, 2100086 CrossRef CAS.
- X. Chen, Y. Kondo, Y. Kuwahara, K. Mori, C. Louis and H. Yamashita, Phys. Chem. Chem. Phys., 2020, 22, 14404–14414 RSC.
- L. Wang, J. Zhang, Y. Zhang, H. Yu, Y. Qu and J. Yu, Small, 2022, 18, e2104561 CrossRef PubMed.
- J. An, Y. Feng, Q. Zhao, X. Wang, J. Liu and N. Li, Environ. Sci. Ecotechnology, 2022, 11, 100170 CrossRef CAS PubMed.
- S. Wei, F. Zhang, W. Zhang, P. Qiang, K. Yu, X. Fu, D. Wu, S. Bi and F. Zhang, J. Am. Chem. Soc., 2019, 141, 14272–14279 CrossRef CAS PubMed.
- S. Yang, W. Hu, X. Zhang, P. He, B. Pattengale, C. Liu, M. Cendejas, I. Hermans, X. Zhang, J. Zhang and J. Huang, J. Am. Chem. Soc., 2018, 140, 14614–14618 CrossRef CAS.
- Y. Zhang, Y. Hu, J. Zhao, E. Park, Y. Jin, Q. Liu and W. Zhang, J. Mater. Chem. A, 2019, 7, 16364–16371 RSC.
- H. Wang, C. Yang, F. Chen, G. Zheng and Q. Han, Angew. Chem., Int. Ed., 2022, 61, e202202328 CrossRef CAS PubMed.
- C. Krishnaraj, H. Sekhar Jena, L. Bourda, A. Laemont, P. Pachfule, J. Roeser, C. V. Chandran, S. Borgmans, S. M. J. Rogge, K. Leus, C. V. Stevens, J. A. Martens, V. Van Speybroeck, E. Breynaert, A. Thomas and P. Van Der Voort, J. Am. Chem. Soc., 2020, 142, 20107–20116 CrossRef CAS PubMed.
- J. Sun, H. S. Jena, C. Krishnaraj, K. Singh Rawat, S. Abednatanzi, J. Chakraborty, A. Laemont, W. Liu, H. Chen, Y.-Y. Liu, K. Leus, H. Vrielinck, V. Van Speybroeck and P. van der Voort, Angew. Chem., Int. Ed., 2023, 135, e202216719 CrossRef.
- M. Deng, J. Sun, A. Laemont, C. Liu, L. Wang, L. Bourda, J. Chakraborty, K. Van Hecke, R. Morent, N. De Geyter, K. Leus, H. Chen and P. Van Der Voort, Green Chem., 2023, 25, 3069–3076 RSC.
- L. Zhai, Z. Xie, C.-X. Cui, X. Yang, Q. Xu, X. Ke, M. Liu, L.-B. Qu, X. Chen and L. Mi, Chem. Mater., 2022, 34, 5232–5240 CrossRef CAS.
- L. Chen, L. Wang, Y. Wan, Y. Zhang, Z. Qi, X. Wu and H. Xu, Adv. Mater., 2020, 32, 1904433 CrossRef CAS.
- M. Kou, Y. Wang, Y. Xu, L. Ye, Y. Huang, B. Jia, H. Li, J. Ren, Y. Deng, J. Chen, Y. Zhou, K. Lei, L. Wang, W. Liu, H. Huang and T. Ma, Angew. Chem., Int. Ed., 2022, 61, e202200413 CrossRef CAS.
- Y. Liu, W.-K. Han, W. Chi, Y. Mao, Y. Jiang, X. Yan and Z.-G. Gu, Appl. Catal., B, 2023, 331, 122691 CrossRef CAS.
- W.-K. Han, H.-S. Lu, J.-X. Fu, X. Liu, X. Zhu, X. Yan, J. Zhang, Y. Jiang, H. Dong and Z.-G. Gu, Chem. Eng. J., 2022, 449, 137802 CrossRef CAS.
- Q. Liao, Q. Sun, H. Xu, Y. Wang, Y. Xu, Z. Li, J. Hu, D. Wang, H. Li and K. Xi, Angew. Chem., Int. Ed., 2023, e202310556 CAS.
- W. Zhao, P. Yan, B. Li, M. Bahri, L. Liu, X. Zhou, R. Clowes, N. D. Browning, Y. Wu, J. W. Ward and A. I. Cooper, J. Am. Chem. Soc., 2022, 144, 9902–9909 CrossRef CAS.
- G.-B. Wang, S. Li, C.-X. Yan, Q.-Q. Lin, F.-C. Zhu, Y. Geng and Y.-B. Dong, Chem. Commun., 2020, 56, 12612–12615 RSC.
- Q. Li, J. Wang, Y. Zhang, L. Ricardez-Sandoval, G. Bai and X. Lan, ACS Appl. Mater. Interfaces, 2021, 13, 39291–39303 CrossRef CAS PubMed.
- N. Qin, A. Mao, L. Li, X. Yang, J. Liu, K. Chen, L. Zhai, R. Liang and L. Mi, Polymer, 2022, 262, 125483 CrossRef CAS.
- J.-N. Chang, Q. Li, J.-W. Shi, M. Zhang, L. Zhang, S. Li, Y. Chen, S.-L. Li and Y.-Q. Lan, Angew. Chem., Int. Ed., 2023, 62, e202218868 CrossRef CAS PubMed.
- A. Mähringer and D. D. Medina, Nat. Chem., 2020, 12, 985–987 CrossRef PubMed.
- W. Chen, Z. Yang, Z. Xie, Y. Li, X. Yu, F. Lu and L. Chen, J. Mater. Chem. A, 2019, 7, 998–1004 RSC.
- A. Iagatti, B. Patrizi, A. Basagni, A. Marcelli, A. Alessi, S. Zanardi, R. Fusco, M. Salvalaggio, L. Bussotti and P. Foggi, Phys. Chem. Chem. Phys., 2017, 19, 13604–13613 RSC.
- H. Urakami, K. Zhang and F. Vilela, Chem. Commun., 2013, 49, 2353–2355 RSC.
- J. Jiang, A. Alsam, S. Wang, S. M. Aly, Z. Pan, O. F. Mohammed and K. S. Schanze, J. Phys. Chem. A, 2017, 121, 4891–4901 CrossRef CAS.
- A. M. Funston, E. E. Silverman, J. R. Miller and K. S. Schanze, J. Phys. Chem. B, 2004, 108, 1544–1555 CrossRef CAS.
Footnote |
| † Electronic supplementary information (ESI) available. See DOI: https://doi.org/10.1039/d3cy01175e |
| This journal is © The Royal Society of Chemistry 2023 |

