 Open Access Article
Creative Commons Attribution 3.0 Unported Licence
Stability and decomposition pathways of the NiOOH OER active phase of NiOx electrocatalysts at open circuit potential traced by ex situ and in situ spectroscopies†
Julia
Gallenberger
 *a,
Harol
Moreno Fernández
 a,
Achim
Alkemper
 a,
Mohan
Li
 bc,
Chuanmu
Tian
a,
Bernhard
Kaiser
a and
Jan Philipp
Hofmann
 *a
*a
aSurface Science Laboratory, Department of Materials and Earth Sciences, Technical University of Darmstadt, Otto-Berndt-Strasse 3, 64287, Darmstadt, Germany. E-mail: jgallenberger@surface.tu-darmstadt.de; hofmann@surface.tu-darmstadt.de
bMaterials Research, GSI Helmholtzzentrum für Schwerionenforschung, 64291 Darmstadt, Germany
cMaterials and Earth Sciences, Technische Universität Darmstadt, 64287 Darmstadt, Germany
First published on 6th July 2023
Abstract
Ni based materials are studied widely for their application as electrocatalysts for alkaline water electrolysis. To further understand and improve these materials, the study of the oxygen evolution reaction (OER) active NiOOH phase is necessary. However, the reversibility of the phase transition from Ni(OH)2 to NiOOH renders the study of the active phase with ex situ techniques difficult. Therefore, we have investigated the pathways and time evolution of the NiOOH decomposition at open circuit potential after the chronamperometric polarization of sputtered NiO thin films. The samples are characterised in situ and ex situ using Raman and X-ray photoelectron spectroscopy, respectively. We show that the NiOOH phase formed under OER conditions (U > 1.5 V, 1 M KOH, room temperature) quickly degrades to Ni(OH)2 when set to open circuit potential both inside and emersed from the electrolyte. We demonstrate that NiOOH can be detected ex situ, but only within a limited timeframe unless it is stabilised in a vacuum environment. H2O adsorption in ultra-high vacuum reveals that the reduction of NiOOH requires protons and electrons, which need to be generated by an oxidative reaction. Our results emphasize the importance of using in situ methods for the characterization of the active phase of the electrocatalyst to observe and understand in detail the processes occurring when analyzing post-catalysis samples by ex situ techniques.
Introduction
The future demand for green hydrogen necessitates the implementation and optimization of water electrolysis technology, which is an environmentally friendly option if renewable energies are used for its operation.1 Within the current water electrolysis technologies, alkaline water electrolysis (AEL) has been shown to be more economical for large-scale hydrogen production compared to proton exchange membrane water electrolysis (PEM) and solid oxide electrolysis cells (SOEC).2 Also, in AEL, non-precious metal catalysts are used both for the hydrogen evolution reaction (HER) and the oxygen evolution reaction (OER).3–5 For instance, nickel-based catalysts have been widely studied and optimised due to their promising performance.6 When using NiO as a catalyst, immersion in KOH will form a thickening Ni(OH)2 layer.7 The hydroxylated Ni can be anodically oxidised to NiOOH. Here, the scheme from Bode et al.8 is generally accepted: Ni(OH)2 appears in the α- and β-phase, both of which are crystallised in a brucite structure, but α-Ni(OH)2 having intercalated water molecules or additional anions. Upon electrochemical polarization, α-Ni(OH)2 transforms to γ-NiOOH, still interlaid with water molecules and ions, whereas β-Ni(OH)2 transforms to the denser β-NiOOH phase. Transformations within the (oxy)hydroxide phases occur for α- to β-Ni(OH)2via ageing in alkaline solution, i.e., dehydration. The β- to γ-NiOOH transformation occurs via overcharging, that is, further oxidation.8 In alkaline OER, NiOOH is supposed to be the electrocatalytically active phase.9–12 A meaningful study of the active phase is only possible under in situ or operando conditions, which can be achieved in, e.g., Raman spectroscopy11–17 or X-ray absorption spectroscopy.17–20 According to the Pourbaix diagram of Ni, NiOOH is only stable in a potential window of about 0.90–1.25 V vs. SHE at pH 14.21 Under experimental conditions, we investigate the reversibility of the phase transformation between Ni(OH)2 and NiOOH on sputtered NiO thin films in 1 M KOH. Understanding the stability of the NiOOH phase and the NiIII/NiII reduction rate is crucial to interpret experimental results, which are performed outside the stability potential window of NiOOH. The instability of the OER active NiOOH phase is proven in situ and ex situ using Raman and X-ray photoelectron spectroscopy. The decomposition is studied in different environments, being 1 M KOH electrolyte, vacuum, air, and vacuum with up to 10−2 mbar pure H2O. The measurements reveal different reduction rates of NiOOH depending on the initial state of the sample and the environment during the reduction. Additionally, we present a mechanism for the decomposition of NiOOH inside 1 M KOH, in ultra-high vacuum (UHV) but exposed to H2O, and under ambient conditions.Experimental
Sample preparation
Gold plates of 12 mm diameter and 1 mm thickness (Schiefer & Co., 99.9% purity) were used as substrate. After polishing with 0.5 μm alumina paste (MicroPolish Alumina, Buehler), they were cleaned sequentially in an ultrasonic bath with acetone, isopropanol and Millipore water for ten minutes each and loaded into the deposition chamber, which is a UHV chamber containing a magnetron sputtering source from MeiVac (MAK 2′′). The chamber is part of the DAISY-FUN cluster tool (DArmstadt's Integrated SYstem for FUNdamental research), integrating thin film preparation and surface analysis. Before launching the coating process, the pressure was lowered to 2 × 10⁻⁸ mbar to ensure clean deposition conditions.NiO thin films were then prepared by DC magnetron sputtering using a Ni target (Kurt J. Lesker with purity 99.99%). Two mass flow controllers (MKS) were used to introduce 0.2 sccm of O2 and 19.8 sccm of Ar (Air Liquide with purity 99.995% and 99.999%, respectively). The working pressure was set to 3 × 10⁻² mbar and the plasma power to 15 W, while having a substrate to target distance of 20 cm. Two different NiO thicknesses were prepared: 120 nm and 6 nm. The deposition rate was calibrated following a linear extrapolation of three different deposition rate values measured with a profilometer and atomic force microscopy (AFM).
Raman spectroscopy
Spectra were acquired with a LabRAM Horiba HR-800 Raman microscope with a 633 nm laser. The power density was 1.9 mW at a spot size of 1.5 μm for a 50× long working distance objective. A 600 grooves per mm grating was chosen, the diameter of the pinhole was set to 200 μm and the entrance slit size to 200 μm. Spectra were accumulated 13 times for 10 s acquisition time per scan.For in situ measurements, a commercial cell named “TSC Raman” from rhd instruments was used. It was operated in a three-electrode configuration. As counter electrode, a gold-plated ring is installed in the base and as reference electrode a leak-free micro Ag/AgCl electrode from Innovative Instruments is used and calibrated against a reversible hydrogen electrode (RHE, HydroFlex, Gaskatel). Potential control was performed with a potentiostat from Gamry instruments (Interface 1000E). For plotting and interpretation of the Raman spectra a linear background was subtracted in the regions of interest.
Electrochemical measurements
Ex situ electrochemical measurements were conducted in a three-electrode setup in a PECC-2 cell from Zahner Elektrik, controlled by a potentiostat from Gamry Instruments (Interface 1000E). All measurements were performed in 1 M KOH (Carl Roth, ICP-OES: <0.6 ppb Fe). Before the measurement, a Hg/HgO reference electrode from ProSense was calibrated against the RHE (HydroFlex, Gaskatel), and the counter electrode was made of a platinum wire. By an electrochemical impedance measurement at open circuit potential (OCP), the current response during cyclic voltammetry was manually iR-corrected in the data post-treatment. Samples for ex situ spectroscopic measurements were exposed to 800 CVs between 1.10–1.55 V vs. RHE with a scan rate of 100 mV s−1. Additionally, 3 CVs before and after the conditioning were measured between 1.00–1.90 V vs. RHE with a scan rate of 50 mV s−1. The number of 800 CVs was chosen as this transformed most of the 6 nm NiO thin film to Ni(OH)2 (Fig. 4 and S2b†). To polarise the thin film, and to create the NiOOH phase, chronoamperometry (CA) was employed at 1.50–1.90 V vs. RHE for 30 min, corresponding to a potential above the Ni2+/Ni3+ oxidation wave.X-ray photoelectron spectroscopy
For the X-ray photoelectron spectroscopy (XPS) measurements, a SPECS PHOIBOS 150 spectrometer implemented at the DAISY-FUN cluster tool was used. It is equipped with an Al Kα X-ray source (monochromatic Focus 500 with XR50 M (SPECS), hv = 1486.74 eV). Survey and detail spectra were measured in fixed analyser transmission mode, while choosing a pass energy of 20 eV (step size of 0.5 eV) for the survey and 10 eV (step size of 0.05 eV) for the core levels. The system was calibrated to 0.00 eV binding energy of the Fermi level of sputter-cleaned Au and Cu as well as to the emission lines of Au 4f7/2 at 83.98 eV, Ag 3d5/2 at 368.26 eV, and Cu 2p3/2 at 932.67 eV binding energy with deviations ≤0.1 eV. The data analysis was performed with CasaXPS, version 2.3.22.22 The core level spectra were fitted with a Shirley background and peaks of a GL(30) line shape. Intensity calculations were done based on relative sensitivity factors published by Scofield.23Scanning Electron Microscopy (SEM) and Grazing-Incidence Wide-Angle X-ray Scattering (GIWAXS)
Scanning electron microscopy (SEM) was employed to characterise the surface morphology of the films. The measurements were performed on a Zeiss Gemini 500 field emission microscope at the GSI Helmholtz Centre for Heavy Ion Research.Grazing-Incidence Wide-Angle X-ray Scattering (GIWAXS) was carried out on a Rigaku Smartlab (Cu Kα radiation) diffractometer in a grazing incidence setup with θsource = 0.3°. Data were recorded between 5° and 90° (in units of 2θ) using a step size of 0.01°. For peak assignment the ICDD database was used for Au (PDF #04-0784) and NiO (PDF #44-1159).24
Results and discussion
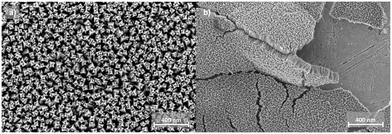
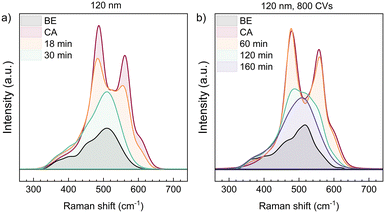
As shown in the following section, the transformation of NiOOH in different media depends on the material's phase and structure before the chronoamperometric creation of the NiOOH phase. In this article, we worked with NiO thin films on Au, which show a very dense and homogeneously distributed film morphology with a polycrystalline structure in well-separated pillars as shown in the SEM images (Fig. 1). By XRD, the preferential orientations of NiO ((101), (012), and (110)) were determined (Fig. S1d†). After electrochemical conditioning (800 CVs between 1.10–1.55 V vs. RHE), the NiO film undergoes cracking and delamination (Fig. 1b). Still, we continued using the Au substrate as it shows only little electrochemical activity in 1 M KOH (Fig. S3†) and because we obtained a better Raman signal of the Ni phases when using the 633 nm laser, compared to measuring on a Ni substrate with a 532 nm laser. We studied thin films of 6 nm and 120 nm thickness. The thinner 6 nm sample was used in XPS measurements to probe through the thin film and down to the substrate and therefore allowing us to study the full film thickness. The 120 nm thin films were used both in XPS and Raman. The thicker material resulted in more defined Raman spectra, which was useful to study the kinetics of the NiOOH decomposition.Phase instability of NiOOH followed by in situ electrochemical Raman spectroscopy
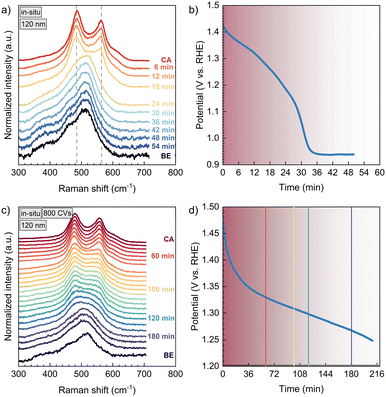
Thus far, several papers report the detection of NiOOH by in situ Raman spectroscopy. Two dominant peaks are commonly assigned to the Eg (480 cm−1) and A1g (560 cm−1) lattice vibrations of NiOOH.11,25,26Fig. 2 shows the in situ Raman spectra of two 120 nm NiO thin films. In a) the spectra of an untreated thin film are plotted, in b) the sample was conditioned with 800 CVs before the Raman measurements. The spectra are overlaid with their real intensities for a direct comparison of the spectral line shapes. First, we analysed the pristine sample at OCP before chronoamperometry (label: BE), and we assigned distinct phonon and magnon scattering at ∼380 cm.1 (1TO), ∼420 cm−1 (1TO), ∼460 cm−1 (1TO), and ∼520 cm−1 (1P + 1M).27,28 No Ni(OH)2 vibrations were observed as the hydroxide phase was not measured due to its low Raman scattering cross section or high structural disorder (Fig. S3a†).9,29–32In situ polarization at 1.50 V vs. RHE (label: CA) immediately leads to the emergence of the mentioned NiOOH vibrations. After stopping the polarization, that is at open circuit condition, the NiOOH phase relaxes, which is shown in sequential Raman spectra recorded as a function of time (Fig. 2, 3 and 5). As the Eg and A1g vibrations of NiOOH are decaying, the spectra transform back to the one before electrochemistry. We refrained from fitting these spectra, as the overlap and possible shifting of vibrations during the phase transformation could likely cause too many fitting parameters and thereby overfitting of the data.Fig. 2 already shows that the Raman peaks, that correspond to NiOOH, are decaying slower in the sample that was conditioned to more Ni(OH)2 by 800 CVs (2b). This is further discussed with respect to Fig. 3, where the instability of NiOOH inside the electrolyte with regard to time and OCP is shown. After stopping the polarization at 1.50 V vs. RHE (30 min), the vibrations of the NiOOH phase last for a specific amount of time, where the NiOOH lifetime depends on the film pre-treatment. In the non-conditioned NiO thin film (Fig. 3a and b), most of the NiOOH signal disappears after 18 to 24 min. During this time, the OCP drops from 1.50 V to 1.18–1.26 V vs. RHE. This correlates with the low potential boundary of the reduction wave of NiIII to NiII in cyclic voltammetry (Fig. S2b†). After 36 min, the OCP stays constant, implying that the backward phase transformation is completed and the capacitor is stabilized.
Fig. 3c) shows the sequential Raman spectra of a 120 nm thick NiO film, which was conditioned by 800 CVs between 1.10–1.55 V vs. RHE before in situ spectroscopy. This conditioning step transforms more NiO into Ni(OH)2, whereby more NiOOH is created during CA. As a result, it takes more than 120 min until most of the Ni3+ phase has decomposed, compared to the 30 min for the non-conditioned sample. This is accompanied by a slower OCP decay, which takes more than 180 min to approach a potential at the lower limit of the NiIII/NiII-reduction wave of this sample (Fig. S2a†).
Phase instability of NiOOH in air, vacuum and H2O atmosphere
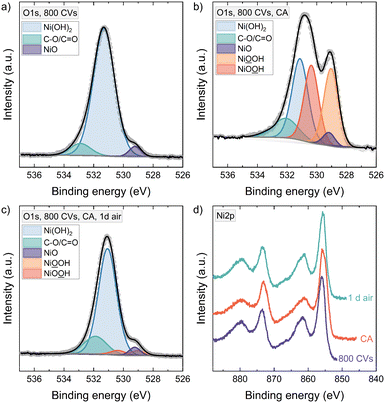
Since many characterization techniques for electrocatalytic reactions are usually operated ex situ, having a stable material phase becomes crucial. Therefore, the instability of NiOOH in 1 M KOH raises the question if the active OER phase can still be detected ex situ after taking out the sample from the electrochemical cell. Also, studying the NiOOH phase stability in different environments allows us to deduce a possible reduction mechanism for these conditions.Fig. 4 shows the O1s XPS spectra of a 6 nm NiO thin film. After conditioning with 800 CVs, where the sample is taken out of the electrochemical cell at a potential of 1.00 V vs. RHE, the sample was rinsed with Millipore water and transferred into UHV. We detect Ni(OH)2 at 531.3 eV, carbon compounds at 532.9 eV, and only a little signal of NiO is left at 529.2 eV.33–36 Measuring a hydroxylated thin film of 6 nm with XPS, we probed nearly or fully through the total film thickness as the escape depth is approximately 4.5–6.4 nm for the O1s core level electrons, using an IMFP of 2.206 nm for O1s photoelectrons in Ni(OH)2.37,38 Therefore, the remaining NiO signal in the O1s feature is the only or major NiO present throughout the film down to the substrate. After 30 min CA at 1.55 V vs. RHE, the potentiostat was switched off and the sample was quickly taken out of the electrochemical cell. It was rinsed with Millipore water and then transferred within 10 minutes into vacuum. The resulting O1s line shows a strong signal around 529.1 eV binding energy. Since we have shown that in the whole film only a little NiO was present before CA – and as a phase transformation back to NiO is unlikely21,39 – the emerging peak at 529.1 eV cannot be NiO. Therefore, we can confidently assign this peak to NiOOH.
The O1s core level region was fitted with two equally sized peaks for the oxy- and hydroxyl-groups of NiOOH respectively.40 Further constraints implemented in the fitting are outlined in the ESI.† Our fitting of the NiOOH portion in the sample is in contrast to some papers that have considered only one NiOOH peak above 530 eV.41–45 Surely, the details can be discussed further, since two peaks with the same area, as we used here, assumes a perfect stoichiometry of the NiOOH phase, for instance. But our data clearly shows that at least the peak at 529.1 eV belongs to NiOOH. After storing the sample for one day in air, the NiOOH signal diminished, proving the instability of NiOOH also outside the electrolyte.
In the Ni2p feature, the main peak at 856.0 eV is typical for Ni(OH)2.33,36 After CA an asymmetry towards lower binding energy develops. Combined with the O1s, we know this is not from NiO, but due to the formation of NiOOH, and the shape compares well with the Ni2p spectrum of Grosvenor et al. for β- and γ-NiOOH.46 Similar asymmetric Ni2p shapes have also been observed in our previous work on the activation of electrochemically deposited Ni(OH)2 thin films.9 The phase transition also leads to a broadening of the satellite peak at about 861.6 eV, a slight shift to lower binding energy and reduced intensity compared to the main peak.46 After CA, the valence band maximum shifts down by 0.65 eV and recovers by 0.57 eV after exposing the sample 1 d to air (Fig. S4†).
The instability of the NiOOH phase is reflected in Raman spectroscopy as well. Fig. 5 compares the ex situ relaxation of two samples of 120 nm NiO each, conditioned by 800 CVs. Foremost it can be stated that the reduction of NiOOH proceeds similarly as in situ. Ex situ, the first Raman spectrum could be recorded 10 min after stopping the polarization, which was done for 30 min at 1.90 V vs. RHE. Already then, the NiOOH phase has largely decomposed and the Eg and A1g vibrations contribute only weakly to the total Raman signal (Fig. 5a). However, in Fig. 5b), we show a similar sample, which was not rinsed with Millipore water after withdrawing it from of the electrolyte and only blow-dried with N2. Employing this procedure, the NiOOH phase seems to be stabilised. XPS measurements (Fig. S6†) detect KOH and air-formed K2CO3 (ref. 47) on the sample surface, which suggests, that they are acting as a protection layer on the NiOOH surface phase, preventing a fast phase decay to Ni(OH)2. This argumentation will be discussed further in the last section about the reduction mechanism of NiOOH.
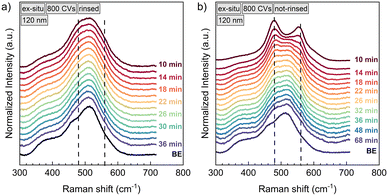 | ||
| Fig. 5 Ex situ Raman spectra of a 120 nm NiO thin film, that was conditioned with 800 CVs. After polarization at 1.90 V vs. RHE the sample was once rinsed with Millipore water (a) and once only dried with nitrogen (b). The labels indicate the time the Raman spectrum was taken after stopping chronoamperometry. The NiOOH vibrations at 480 cm−1 and 560 cm−1 formed during chronoamperometry are decaying outside polarization and the spectrum approaches the one of the pristine sample, labelled as “BE” (before electrochemistry). The reduction of NiOOH happens faster than in situ, which is shown in Fig. 2. b) Not-rinsing the sample results in a longer time period for the decomposition of NiOOH. | ||
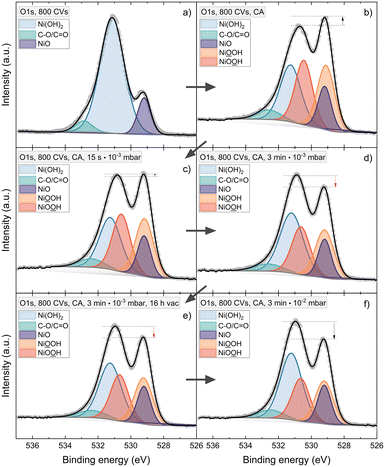
To further understand the instability of NiOOH in different conditions and possibly the reduction mechanisms of the phase, a water adsorption experiment was performed. Thereby the XPS spectra of the active phase were analysed after storing the sample in vacuum versus exposing it to pure H2O inside the vacuum. Fig. 6 shows the sequence for a 120 nm sample, conditioned by 800 CVs. Again, NiOOH is detected after CA (Fig. 6b). Exposing the phase to increasing water pressures from 10−3 to 10−2 mbar leads to a reduction of the NiOOH signal. On the other hand, the phases are stable when storing the sample for 16 h in vacuum (Fig. 6d and e).
Reduction mechanism of NiOOH in different media
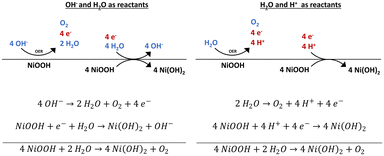
According to our findings, we can state that NiOOH is stable in vacuum but unstable in contact to H2O, air, and 1 M KOH. Based on these results, we propose a possible mechanism for the reduction of NiOOH. The water adsorption experiment reveals that only H2O is needed to reduce NiOOH in the absence of an applied potential. If only H2O is present, to obtain the protons and electrons needed for the reduction of NiOOH to Ni(OH)2, an OER reaction needs to occur on the NiOOH active phase. In the electrolyte, the abundance of OH− renders the alkaline pathway of the OER likely. Here, the OER provides the electrons, whereas the protons are delivered by H2O molecules (Scheme 1). In a (neutral) water atmosphere or in atmospheric air, the OER mechanism and NiOOH reduction can also proceed with H2O molecules and H+ as reactants.Considering the OCP decay shown in Fig. 3, the overpotential is quickly too low to catalyse the OER on the NiOOH surface. We suggest that an incomplete OER is occurring. In many DFT calculations, the second or third step of the 4-electron process was calculated to be the rate-determining step.48–50 However, the first step, which may require little or zero overpotential, can already release the needed electrons and protons to reduce NiOOH. Hereby, the step to release the needed e− and H+ and could be, for instance, the protonation of 2 H2O* to H2O* + OH* in the binuclear H2O–O mechanism or the step from OH* to O* in the alkaline pathway.51,52 But as the exact OER mechanism and individual steps that are occurring on our samples are unknown and difficult to determine, we are restricted to proposing a general concept.
With regard to the proposed mechanism, the evolution of the NiOOH phase in time is discussed. When the NiOOH is provided with protons and electrons only via the surface it is evident that it will take longer to reduce increased amounts of bulk NiOOH. Further, the decomposition of NiOOH occurs slower in the electrolyte than under ambient air conditions. Storing the sample in electrolyte keeps up the electrochemical double layer, which stabilises the potential of the working electrode. The more stable potential in turn stabilises the NiOOH phase. Contrary, when the samples are exposed to air, there is no such stabilisation of the surface potential, which could be the reason for the much faster initial decay of the NiOOH phase. However, our results show that the rate of decomposition slows down in air with time and the transformation is incomplete, as there are still small NiOOH vibrations in the final spectra in Fig. 5. If there is an OER like mechanism taking place, side products like OH− will be created on the surface. In the electrolyte, these species might go into solution. On the other hand, in air the surface might be saturated by OH− or other products, which hinders the arrival of new protons that are needed for the phase transformation. This also explains the observed function of KOH or K2CO3 as a protection layer, which might shield the NiOOH phase from H2O molecules.
Finally, when conducting research on NiOx catalysts the incorporation of Fe impurities needs to be discussed due to the impact on the catalytic properties.53,54 Although the general observations in this paper should hold, we do believe that the actual kinetics of the NiOOH decomposition might be dependent to some extend on Fe-impurities, but also on many other factors such as crystallinity or surface area. For that reason, we refrained from giving specific decomposition rates of NiOOH.
Conclusions
NiO thin films were prepared to investigate the stability of the OER active NiOOH phase ex situ and in situ at open circuit potential. Electrochemically created NiOOH is reduced to Ni(OH)2 immediately after stopping the polarization both inside the electrolyte and in air. Depending on the amount of NiOOH created and its environment outside polarization, the stability of the NiOOH phase will be affected. As a result, different characterisation techniques will measure a sample with varying amounts of NiOOH present. We want to stress that the assertion to have measured NiOOH ex situ needs to be carefully drawn, as the phase might have decomposed until the measurement was performed. At best, the interpretation of the results is supported by studies on the stability of NiOOH outside its stability potential in the individual samples.Additionally, we have shown that water adsorption inside vacuum induces the decomposition of NiOOH whereas the phase is stable in vacuum. From the above observations, we speculate that a mechanism similar to the OER delivers the electrons for the phase reduction. The necessary protons for the phase transformation can be delivered by H2O molecules either through dissociation or via an OER pathway. Shielding the NiOOH material from a supply of protons and electrons will stabilise the NiOOH phase. We show that this works for a limited time by a layer of dried KOH or K2CO2, which hinders the moisture in the air from reacting with the NiOOH. Coating the sample with a more stable protection layer should further increase the stability of NiOOH over time.
In view of our study, we hope that the dynamics of the NiOOH phase are considered in future in situ and ex situ experiments and that the characterisation of the genuinely active NiOOH phase, and not its decomposition product, will be further advanced in upcoming studies.
Data availability
All raw data and files used for this paper are openly accessible in the Zenodo repository: https://zenodo.org/record/8132701.Author contributions
Julia Gallenberger: investigation, analysis, writing-original draft. Harol Moreno Fernández: investigation, methodology, writing. Achim Alkemper: methodology, conceptualization, proofreading. Li Mohan: SEM measurements. Chuanmu Tian: XRD measurements. Bernhard Kaiser: proofreading, supervision. Jan Philipp Hofmann: proofreading, supervision, funding acquisition.Conflicts of interest
There are no conflicts to declare.Acknowledgements
We thank the German Federal Ministry of Education and Research (BMBF) for providing financial support within the cluster project PrometH2eus (Fkz: 03HY105H). We thank Maximilian Mellin and Marie Charlotte Neumann for the ICP-OES measurements.Notes and references
- M. Granovskii, I. Dincer and M. A. Rosen, J. Power Sources, 2007, 167, 461–471 CrossRef CAS.
- N. Tenhumberg and K. Büker, Chem. Ing. Tech., 2020, 92, 1586–1595 CrossRef CAS.
- R. L. Doyle, I. J. Godwin, M. P. Brandon and M. E. G. Lyons, Phys. Chem. Chem. Phys., 2013, 15, 13737–13783 RSC.
- M. S. Burke, L. J. Enman, A. S. Batchellor, S. Zou and S. W. Boettcher, Chem. Mater., 2015, 27, 7549–7558 CrossRef CAS.
- M. Ďurovič, J. Hnát and K. Bouzek, J. Power Sources, 2021, 493, 229708 CrossRef.
- Y. Chen, K. Rui, J. Zhu, S. X. Dou and W. Sun, Chem. – Eur. J., 2019, 25, 703–713 CrossRef CAS PubMed.
- S. L. Medway, C. A. Lucas, A. Kowal, R. J. Nichols and D. Johnson, J. Electroanal. Chem., 2006, 587, 172–181 CrossRef CAS.
- H. Bode, K. Dehmelt and J. Witte, Electrochim. Acta, 1966, 11, 1079–1087 CrossRef CAS.
- S. Tao, Q. Wen, W. Jaegermann and B. Kaiser, ACS Catal., 2022, 12, 1508–1519 CrossRef CAS.
- S. R. Mellsop, A. Gardiner, B. Johannessen and A. T. Marshall, Electrochim. Acta, 2015, 168, 356–364 CrossRef CAS.
- B. S. Yeo and A. T. Bell, J. Phys. Chem. C, 2012, 116, 8394–8400 CrossRef CAS.
- O. Diaz-Morales, D. Ferrus-Suspedra and M. T. M. Koper, Chem. Sci., 2016, 7, 2639–2645 RSC.
- H. Radinger, P. Connor, S. Tengeler, R. W. Stark, W. Jaegermann and B. Kaiser, Chem. Mater., 2021, 33, 8259–8266 CrossRef CAS.
- B. J. Trześniewski, O. Diaz-Morales, D. A. Vermaas, A. Longo, W. Bras, M. T. M. Koper and W. A. Smith, J. Am. Chem. Soc., 2015, 137, 15112–15121 CrossRef PubMed.
- K. S. Joya and X. Sala, Phys. Chem. Chem. Phys., 2015, 17, 21094–21103 RSC.
- Z. Qiu, Y. Ma and T. Edvinsson, Nano Energy, 2019, 66, 104118 CrossRef CAS.
- S. Klaus, Y. Cai, M. W. Louie, L. Trotochaud and A. T. Bell, J. Phys. Chem. C, 2015, 119, 7243–7254 CrossRef CAS.
- S. A. Chala, M.-C. Tsai, B. W. Olbasa, K. Lakshmanan, W.-H. Huang, W.-N. Su, Y.-F. Liao, J.-F. Lee, H. Dai and B. J. Hwang, ACS Nano, 2021, 15, 14996–15006 CrossRef CAS PubMed.
- X. Bo, R. K. Hocking, S. Zhou, Y. Li, X. Chen, J. Zhuang, Y. Du and C. Zhao, Energy Environ. Sci., 2020, 13, 4225–4237 RSC.
- D. Friebel, M. W. Louie, M. Bajdich, K. E. Sanwald, Y. Cai, A. M. Wise, M.-J. Cheng, D. Sokaras, T.-C. Weng, R. Alonso-Mori, R. C. Davis, J. R. Bargar, J. K. Nørskov, A. Nilsson and A. T. Bell, J. Am. Chem. Soc., 2015, 137, 1305–1313 CrossRef CAS PubMed.
- L.-F. Huang, M. J. Hutchison, R. J. Santucci, J. R. Scully and J. M. Rondinelli, J. Phys. Chem. C, 2017, 121, 9782–9789 CrossRef CAS.
- N. Fairley, V. Fernandez, M. Richard-Plouet, C. Guillot-Deudon, J. Walton, E. Smith, D. Flahaut, M. Greiner, M. Biesinger, S. Tougaard, D. Morgan and J. Baltrusaitis, Appl. Surf. Sci. Adv., 2021, 5, 100112 CrossRef.
- J. H. Scofield, J. Electron Spectrosc. Relat. Phenom., 1976, 8, 129–137 CrossRef CAS.
- S. Gates-Rector and T. Blanton, Powder Diffr., 2019, 34, 352–360 CrossRef CAS.
- J. Desilvestro, D. A. Corrigan and M. J. Weaver, J. Phys. Chem., 1986, 90, 6408–6411 CrossRef CAS.
- Y. L. Lo and B. J. Hwang, Langmuir, 1998, 14, 944–950 CrossRef CAS.
- N. Mironova-Ulmane, A. Kuzmin, I. Sildos, L. Puust and J. Grabis, Latv. J. Phys. Tech. Sci., 2019, 56, 61–72 CAS.
- N. Bala, H. K. Singh, S. Verma and S. Rath, Phys. Rev. B, 2020, 102, 024423 CrossRef CAS.
- D. S. Hall, D. J. Lockwood, S. Poirier, C. Bock and B. R. MacDougall, ACS Appl. Mater. Interfaces, 2014, 6, 3141–3149 CrossRef CAS PubMed.
- D. S. Hall, D. J. Lockwood, S. Poirier, C. Bock and B. R. MacDougall, J. Phys. Chem. A, 2012, 116, 6771–6784 CrossRef CAS PubMed.
- D. S. Hall, C. Bock and B. R. MacDougall, J. Electrochem. Soc., 2013, 160, F235 CrossRef CAS.
- R. Kostecki and F. McLarnon, J. Electrochem. Soc., 1997, 144, 485 CrossRef CAS.
- B. V. Crist, Handbooks of Monochromatic XPS Spectra, XPS International LLC, 2004, 2 Search PubMed.
- R. Poulain, J. Rohrer, Y. Hermans, C. Dietz, J. Brötz, J. Proost, M. Chatenet and A. Klein, J. Phys. Chem. C, 2022, 126, 1303–1315 CrossRef CAS.
- G. Beamson and D. Briggs, High Resolution XPS of Organic Polymers - The Scienta ESCA300 Database, Wiley Interscience, 1992 Search PubMed.
- M. C. Biesinger, B. P. Payne, A. P. Grosvenor, L. W. M. Lau, A. R. Gerson, R. St and C. Smart, Appl. Surf. Sci., 2011, 257, 2717–2730 CrossRef CAS.
- M. C. Biesinger, B. P. Payne, L. W. M. Lau, A. Gerson, R. St and C. Smart, Surf. Interface Anal., 2009, 41, 324–332 CrossRef CAS.
- S. Hofmann, Auger- and X-Ray Photoelectron Spectroscopy in Materials Science: A User-Oriented Guide, Springer-Verlag, Berlin Heidelberg, 2013 Search PubMed.
- T. S. Horányi, Thermochim. Acta, 1989, 137, 247–253 CrossRef.
- B. P. Payne, M. C. Biesinger and N. S. McIntyre, J. Electron Spectrosc. Relat. Phenom., 2009, 175, 55–65 CrossRef CAS.
- H. Duan, Z. Chen, N. Xu, S. Qiao, G. Chen, D. Li, W. Deng and F. Jiang, J. Electroanal. Chem., 2021, 885, 114966 CrossRef CAS.
- E. L. Ratcliff, J. Meyer, K. X. Steirer, A. Garcia, J. J. Berry, D. S. Ginley, D. C. Olson, A. Kahn and N. R. Armstrong, Chem. Mater., 2011, 23, 4988–5000 CrossRef CAS.
- H. Liu, Z. Yan, X. Chen, J. Li, L. Zhang, F. Liu, G. Fan and F. Cheng, Research, 2020, 2020, 9068270 CAS.
- A. Liu, G. Liu, H. Zhu, B. Shin, E. Fortunato, R. Martins and F. Shan, Appl. Phys. Lett., 2016, 108, 233506 CrossRef.
- S.-K. Kim, H.-J. Seok, D.-H. Kim, D.-H. Choi, S.-J. Nam, S.-C. Kim and H.-K. Kim, RSC Adv., 2020, 10, 43847–43852 RSC.
- A. P. Grosvenor, M. C. Biesinger, R. St, C. Smart and N. S. McIntyre, Surf. Sci., 2006, 600, 1771–1779 CrossRef CAS.
- K. Harting, U. Kunz, T. Turek and Z. Phys, Chem, 2012, 226, 151–166 CAS.
- Y.-F. Li, J.-L. Li and Z.-P. Liu, J. Phys. Chem. C, 2021, 125, 27033–27045 CrossRef CAS.
- J. C. Fornaciari, L.-C. Weng, S. M. Alia, C. Zhan, T. A. Pham, A. T. Bell, T. Ogitsu, N. Danilovic and A. Z. Weber, Electrochim. Acta, 2022, 405, 139810 CrossRef CAS.
- L.-F. Li, Y.-F. Li and Z.-P. Liu, ACS Catal., 2020, 10, 2581–2590 CrossRef CAS.
- A. J. Tkalych, H. L. Zhuang and E. A. Carter, ACS Catal., 2017, 7, 5329–5339 CrossRef CAS.
- X. Xie, L. Du, L. Yan, S. Park, Y. Qiu, J. Sokolowski, W. Wang and Y. Shao, Adv. Funct. Mater., 2022, 32, 2110036 CrossRef CAS.
- D. A. Corrigan, J. Electrochem. Soc., 1987, 134, 377 CrossRef CAS.
- L. Trotochaud, S. L. Young, J. K. Ranney and S. W. Boettcher, J. Am. Chem. Soc., 2014, 136, 6744–6753 CrossRef CAS PubMed.
Footnote |
| † Electronic supplementary information (ESI) available. See DOI: https://doi.org/10.1039/d3cy00674c |
| This journal is © The Royal Society of Chemistry 2023 |

