Assembly of gold nanorods functionalized by zirconium-based metal–organic frameworks for surface enhanced Raman scattering†
Juan
Li‡
 a,
Zhenfeng
Liu‡
a,
Dehua
Tian
a,
Baojun
Li
a,
Lei
Shao
a,
Zhenfeng
Liu‡
a,
Dehua
Tian
a,
Baojun
Li
a,
Lei
Shao
 *b and
Zaizhu
Lou
 *ac
*ac
aInstitute of Nanophotonics, Jinan University, Guangzhou, 511443, China. E-mail: zzlou@jnu.edu.cn
bShenzhen JL Computational Science and Applied Research Institute, Shenzhen 518110, China. E-mail: shaolei@csrc.ac.cn
cState Key Laboratory for Crystal Materials, Shandong University, Jinan, 250100, China
First published on 21st March 2022
Abstract
Surface-enhanced Raman scattering (SERS) is a promising detection technique providing outstanding molecular fingerprint identification and high sensitivity of analytes. Developing sensitive and stable SERS substrates is highly desirable but remains a challenge. We herein report a wet-chemistry approach for the preparation of (Au nanorod core)@(Zr-based metal–organic framework shell) (Au nanorod@Zr-MOF) nanostructures with the Zr-MOF shell thickness ranging from 3 nm to 90 nm. The stacked Au nanorod@Zr-MOF composites exhibit remarkably improved SERS sensitivity because the MOF shell enriches the molecules to the abundant plasmonic hotspots between the Au nanorod cores. The optimized Au nanorod@Zr-MOF structures exhibit superior SERS activity for detecting 4′-mercaptobiphenylcarbonitrile molecules at a concentration as low as 2 × 10⁻¹⁰ M, with the SERS enhancement factor 2 and 8 times as high as that of ordered bare Au nanorod arrays and random stacking bare Au nanorods, respectively. This study enriches the library of hybrid nanostructures of plasmonic nanocrystals and MOFs, providing an integrated SERS platform with molecular enrichment capability for the realization of sensitive and quantitative analyte identification.
Introduction
Surface-enhanced Raman scattering (SERS), a promising technique for sensitive molecular fingerprint detection, has been widely utilized in diverse fields including chemical analysis, food safety, environmental monitoring, biomedicine etc.1–6 One of the key issues of SERS technology research is to develop effective SERS substrates. Nanostructured materials that support surface plasmon resonances, such as Au and Ag nanoparticles, are excellent candidates for SERS substrates.7–9 The localized surface plasmon resonances (LSPRs) of plasmonic nanostructures result in remarkably enhanced local electromagnetic fields. The increase of the local electric field dominates the SERS enhancement, with SERS enhancement factor approximately proportional to the fourth power of the local electric field enhancement.10,11 In addition, coupled plasmonic nanostructures constructed from assembling metal nanoparticles can produce significant electric field enhancement in the interparticle gaps, forming plasmonic “hotspots” that further boost the SERS enhancement factor to the range of 103–1010.4,10,12 Despite their extremely large electric field enhancement, the employment of bare plasmonic metal nanostructures for SERS applications suffers from the difficult control of the adsorption of analyte molecules, especially those without metal-specific binding groups, to the metal surface. The commonly utilized colloidal noble metal nanoparticles possess high surface energy and tend to aggregate, which leads to the damping of LSPR and thus low SERS activity.13 Besides, most of the current assembling approaches require strong coordinating ligands on metal surface, which largely block the access of analytes to the plasmonic hotspots, thus significantly reducing the SERS intensities.14 To prevent colloidal noble metal nanoparticles from aggregation, many stabilizing materials such as polymers, transition-metals, etc., were proposed as protective shells. Such core@shell nanostructures can give rise to more intense, reproducible and stable SERS signals by enabling an improved metal–analyte interaction through concentrating target analytes close to the plasmonic nanostructure surface.15–17 Therefore, developing core@shell nanostructure SERS substrates that can concentrate target molecules into the plasmonic hotspots is highly desirable, but remains a challenge.Porous materials such as alumina and silica have been employed as depositions on plasmonic nanostructures to improve the SERS detection performance because of the adsorption of target molecules enabled by such materials.18,19 Metal–organic frameworks (MOFs), which are highly ordered porous crystalline materials consisting of metal cations or cluster nodes linked by organic ligands, have recently attracted considerable attention because of their intriguing features, such as tunable pore size, extremely high surface area, and versatile functionalities.20,21 Core@shell nanostructures formed by encapsulating plasmonic nanocrystals within MOFs have been demonstrated as multi-functional platforms for SERS detection, catalysis and drug delivery.22–25 The MOF shell can stabilize the plasmonic nanocrystals and enrich target molecules close to the metal surface, which are beneficial for improving the performance of the plasmonic nanocrystal-based SERS platform.23 Necklace-like core@shell Ag@zeolitic imidazolate frameworks-8 (ZIF-8) heterostructured nanowires were reported for SERS detection of crystal violet molecules with an excellent reproducibility.26 ZIF-8 coated Au nanobipyramids were presented as SERS probes for 4-aminothiophenol detection.27 Although the SERS activity of MOF-encapsulated nanocrystals have been demonstrated, it remains challenging to create numerous plasmonic hotspots at the nanoparticle junctions while maintaining the MOF structures.
In this work, we demonstrate a simple wet-chemistry approach for the preparations of (Au nanorod core)@(Zr-based metal–organic framework shell) (Au nanorod@Zr-MOF) nanostructures with the Zr-MOF shell thickness ranging from 3 nm to 90 nm. The stacked Au nanorod@Zr-MOF composites exhibit remarkably improved SERS performance for detecting 4′-mercaptobiphenylcarbonitrile (BPTCN) molecules because the target molecules are concentrated at the gap areas between the neighboring Au nanorods where the electromagnetic fields are greatly enhanced. The enrichment of the target molecules at the plasmonic gap is achieved by chemical and physical absorption of the MOF shell on the Au nanorods. The gap distance and thus the electromagnetic fields are modulated by varying the thickness of the Zr-MOF shell. The randomly stacked Au nanorod@Zr-MOF with a MOF thickness of 3 nm has the optimal SERS enhancement for detecting the BPTCN molecules at a concentration as low as 2 × 10⁻¹⁰ M, with the SERS enhancement factor 2 and 8 times as high as that of ordered bare Au nanorod arrays and random stacking bare Au nanorods, respectively. Our work provides a promising strategy to enrich analyte molecules on plasmonic hotspots for superior SERS detection. The employment of the Zr-MOF shell is also expected to exhibit excellent detection selectivity.22
Results and discussion
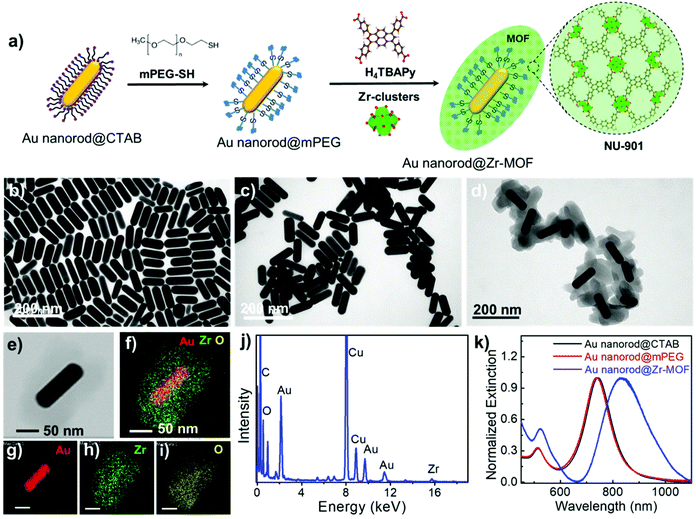
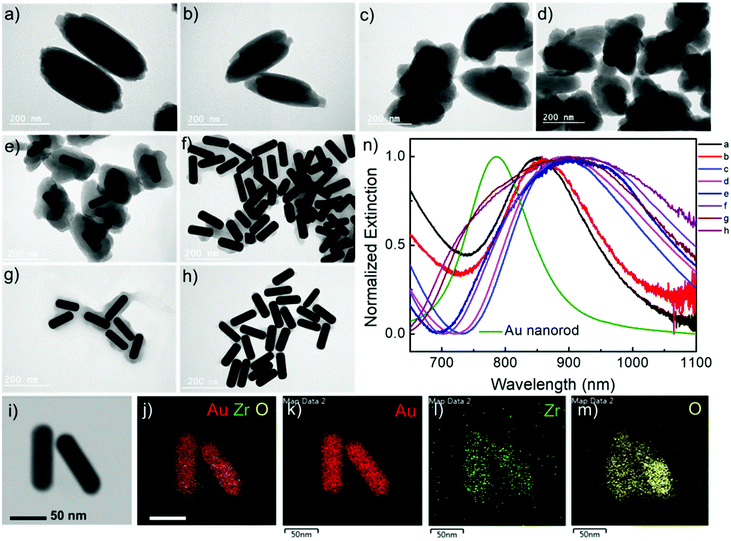
Au nanorods are the most versatile plasmonic nanoparticles with well-developed synthesis approaches and tunable LSPRs.28 In our experiments, the Au nanorod@Zr-MOF structures were prepared by two steps of modifications on the Au nanorods that were first synthesized following the conventional seed-mediated growth method (Fig. 1a).29 The as-prepared Au nanorods that are stabilized with a cetyltrimethylammonium bromide (CTAB) bilayer have an average length and diameter of 113 nm and 37 nm with an aspect ratio of 3 (Fig. 1b and Fig. S1†). The CTAB capping agent was replaced by thiol-terminated methoxy poly(ethylene glycol) (mPEG-SH) following a two-step ligand exchange method30 to prevent the aggregation of the Au nanorods during the deposition of MOF on their surface. The obtained Au nanorod@mPEG structures maintain the morphology of the Au nanocrystal core (Fig. 1c). The mPEG shell then interacts with the precursors and facilitates the nucleation of the MOF crystals on the Au nanorod surface. The core@shell Au nanorod@Zr-MOF structures were therefore prepared via a room-temperature MOF assembly process (see Methods).31 The encapsulating MOF used here is microporous NU-901 with aperture size of 12 Å × 26 Å, consisting of eight-connected Zr6(μ3-O)4(μ3-OH)4–(H2O)4(OH)4 clusters that are linked by 1,3,6,8-tetrakis(p-benzoic acid)pyrene (H4TBAPy). The Zr-clusters pre-prepared by a reported approach32 were dispersed in a mixture of dimethylformamide (DMF) and glacial acetic acid. The mPEG-capped Au nanorods were then added into the obtained mixture, following by a slow addition of the H4TBAPy linker under vigorous stirring (see Methods). Core@shell Au nanorod@Zr-MOF products were therefore successfully prepared after an overnight reaction (Fig. 1d and e). The core@shell structures were further analyzed by elemental mapping (Fig. 1f–i) and energy-dispersive X-ray (EDX) spectroscopy (Fig. 1j) characterizations of individual Au nanorod@Zr-MOF structures. The elemental mapping results clearly verified the core@shell configuration of the Au nanorod@Zr-MOF structures. The optical extinction spectrum of the colloidal Au nanorods stabilized by CTAB exhibited distinct peaks at around 514 nm and 744 nm, respectively (Fig. 1k), which are originated from the transverse and longitudinal LSPRs of the Au nanorod. The spectral shape and wavelength of the two LSPR peaks are rarely changed after the CTAB capping agent is replaced by mPEG-SH. In contrast, after the deposition of the Zr-MOF shell with a thickness of around 35 nm, the transverse LSPR peak undergoes a slight red shift while the longitudinal LSPR that is much more sensitive to the environmental refractive index change shows a distinct red shift from 744 nm to 825 nm. The remarkable plasmon shift is attributed to the larger refractive index of the Zr-MOF in comparison to that of the water environment.The Au nanorod LSPRs strongly interact with the incident light and generate intense electric fields that are distributed around several nanometers near the Au nanorod surface. The plasmonic electric field rapidly decays with increasing distance from the Au surface. In our experiments, the thickness of the MOF coating on the Au nanorods can be effectively tuned by varying the concentration of H4TBAPy linker during the MOF growth. Au nanorod@Zr-MOF structures with eight different thicknesses therefore were prepared as the H4TBAPy concentration decreased from 80 to 10 μg mL−1 with a step of 10 μg mL−1 (Fig. 2a–h). The synthesized Au nanorod@Zr-MOF structures exhibit a prolate spheroid shape similar to that of pristine MOF and have their major axes along the length axis of the Au nanorod cores, showing that the Au nanorod core directs the shell formation. The Zr-MOF shell thickness decreases as the H4TBAPy concentration decreases. The average Zr-MOF shell thicknesses, defined as the average length along the long and short axis of Au nanorods, of these samples are 90, 75, 60, 45, 30, 12, 7, and 3 nm, respectively. For sample that has the thinnest Zr-MOF shell (3 nm), elemental mapping images (Fig. 2i–m) suggest that the Au nanorods are still completely coated by the MOF shell. The optical extinction measurements reveals that the longitudinal LSPR peak of the Au nanorod@Zr-MOF structure first red shifts and then becomes broadening as the MOF shell thickness decreases, indicating that the colloidal Au nanorod@Zr-MOF structures tend to aggregate and forming assemblies in solution (Fig. 2n). Specifically, the core@shell structures with 7 nm and 3 nm shell thicknesses exhibit significant spectra broadening due to the strong coupling of neighboring Au nanorods with small gap distances. The assembled plasmonic nanostructures with their gap distances finely controlled by the Zr-MOF shell thickness during sample preparation are largely favorable for SERS applications, since they provide multiple plasmonic hot spots with uniformly distributed electric fields.
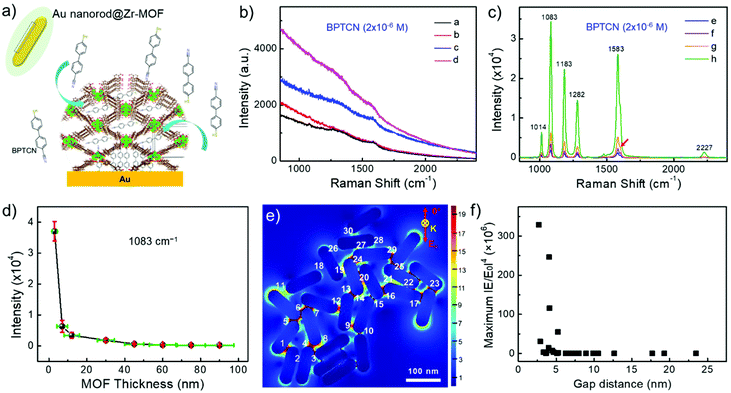
The as-fabricated Au nanorod@Zr-MOF structures are expected to become promising SERS substrates for sensitive detection of analytes that can diffuse into the MOF shell. Before molecular detection experiments, control Raman spectrum of Zr-MOF in powder form was measured as shown in Fig. S2.† Two characteristic peaks at 1264 and 1606 cm−1 are observed, which are assigned to ring breathing modes for the single and polyaromatic species of NU-901, respectively. 4′-mercaptobiphenylcarbonitrile (BPTCN) molecules with a small size (10 Å) was chosen as the target molecules and a 785 nm laser was employed to explore the SERS performance of the core@shell nanostructures. The BPTCN molecules (2 × 10⁻⁶ M) were added into the solutions of Au nanorod@Zr-MOF structures and the mixtures were incubated for 12 h, allowing the molecules to diffuse into the porosity of the nanostructure MOF shell. The Zr-MOF enables strong physical adsorption of BPTCN molecules and therefore enriches the BPTCN molecules close to Au nanorod surface (Fig. 3a). Before the SERS measurement, the nanostructures were washed to remove excess BPTCN molecules and deposited onto silicon wafers. Raman peaks were not observed for the core@shell structures with a shell thickness larger than 45 nm because the electric field enhancement is limited (Fig. 3b). Besides, most of the targeted molecules physically adsorbed on the thick MOF shell are far away from the Au nanorod surface. As the Zr-MOF shell thickness decreased to 30 nm, Raman peaks of the target molecules started to appear and gradually became stronger as the shell thickness further decreased. The core@shell structure with the thinnest Zr-MOF shell (3 nm) presents the strongest SERS signal as expected. Distinct Raman peaks at 1014, 1083, 1183, 1282, 1583 and 2227 cm−1 are clearly seen (Fig. 3c), agreeing well with the reported Raman signals of BPTCN molecules.33 Note that only a small shoulder signal of Zr-MOF around 1606 cm−1 (red arrow) can be observed due to its relatively low content. The strong SERS signals of BPTCN indicate that the molecules have indeed been enriched by the Zr-MOF shell and been confined in the plasmonic gaps between the Au nanorods, where the optical electric fields are greatly enhanced. The Raman modes at 1083, 1183, 1282, 2227 cm−1 are interpreted as due to the bending of C–H of the thiol-phenyl ring, the bending of C–H of both phenyl rings, the vibration of the ring, and the vibration of C![[triple bond, length as m-dash]](https://www.rsc.org/images/entities/char_e002.gif) N, respectively. The intensity of the strongest Raman peak at 1083 cm−1vs. Zr-MOF shell thickness was plotted in Fig. 3d. As the Zr-MOF shell thickness increases, the SERS intensity dramatically decreases as expected, mainly ascribing to the increased gap distance between Au nanorods caused weak electrical field. The SERS enhancement factor (EF) for the Au nanorod@Zr-MOF with a thickness of 3 nm is estimated to be 4.7 × 10⁵, with BPTCN powder as the control group (see Fig. S3† and calculation details in the ESI†).34 Moreover, to investigate the MOF shell thickness-dependent enrichment speed, the BPTCN molecules were incubated with different Au nanorod@Zr-MOF structures and SERS spectra were collected at every 2 h interval (Fig. S4†). It can be seen that Au nanorod@Zr-MOF with 3 nm MOF shell exhibits the strongest SERS signal and remains stable after 4 h incubation, demonstrating its fast molecular enrichment speed. Overall, the Au nanorod@Zr-MOF with 3 nm MOF shell is an optimized SERS substrate in terms of SERS signal, enrichment increasing and speed.
N, respectively. The intensity of the strongest Raman peak at 1083 cm−1vs. Zr-MOF shell thickness was plotted in Fig. 3d. As the Zr-MOF shell thickness increases, the SERS intensity dramatically decreases as expected, mainly ascribing to the increased gap distance between Au nanorods caused weak electrical field. The SERS enhancement factor (EF) for the Au nanorod@Zr-MOF with a thickness of 3 nm is estimated to be 4.7 × 10⁵, with BPTCN powder as the control group (see Fig. S3† and calculation details in the ESI†).34 Moreover, to investigate the MOF shell thickness-dependent enrichment speed, the BPTCN molecules were incubated with different Au nanorod@Zr-MOF structures and SERS spectra were collected at every 2 h interval (Fig. S4†). It can be seen that Au nanorod@Zr-MOF with 3 nm MOF shell exhibits the strongest SERS signal and remains stable after 4 h incubation, demonstrating its fast molecular enrichment speed. Overall, the Au nanorod@Zr-MOF with 3 nm MOF shell is an optimized SERS substrate in terms of SERS signal, enrichment increasing and speed.
To further reveal the SERS enhancement, the finite-difference time-domain (FDTD) simulations were additionally performed to provide the spatial distribution of electric field intensity with different incident polarization direction (Fig. 3e and Fig. S5a–c†). Considering the random orientation of Au nanorods in Fig. 2h, four incident light polarization directions (0°, 30°, 60°, 90°) were applied. The localized electric field enhancement occurs at the tips and gaps between the Au nanorods for all cases, regardless of the polarization direction. The maximum electric field enhancement factor (|E/E0|4) over 30 spots were calculated and statistically analyzed in Fig. 3f and Fig. S5d–f.† Compared with the experimental observation above, the maximum electric field enhancement factor (|E/E0|4) exhibits a more rapidly decay tendency with increase of gap distance in all cases. Consequently, both electrical field enhancement of Au nanorods and the molecular enrichment effect of the MOF shell contributed to the strong SERS signals. As the MOF shell becomes thin, more plasmonic hotspots with amplified electric field are formed between neighboring Au nanorods, where BPTCN molecules are extensively enriched, giving rise to the strongest Raman signals.
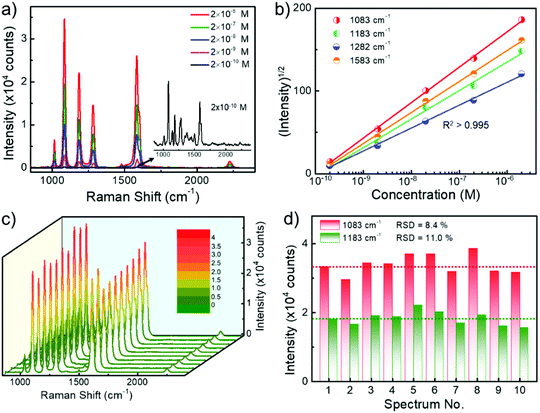
To explore the sensitivity of SERS sensing using randomly stacked Au nanorod@Zr-MOF structures, we incubated the nanostructures with a MOF shell of 3 nm in BPTCN molecule solutions with concentrations varying from 2 × 10⁻¹⁰ M to 2 × 10⁻⁶ M, and performed SERS measurements. As the target molecule concentration decreased, the Raman intensity decreased monotonically (Fig. 4a). The characteristic Raman peaks of BPTCN could still be identified even at a BPTCN concentration as low as 2 × 10⁻¹⁰ M. Moreover, the square root of the SERS intensities I of different Raman peaks and the logarithm of the BPTCN concentration (log10[C]) follow a good linear dependence (Fig. 4b). The measured data could be well fitted by the equation I1/2 = A·log10[C] + B with squared correlation coefficients R2 > 0.995. Such linear dependence enables the SERS measurement for the quantitative analysis of low concentration molecules.32 We also examined the uniformity and reproducibility of the core@shell nanostructure SERS performance, which are important criterions for evaluating the performance of SERS substrates in practical applications. Fig. 4c shows the Raman spectra taken at randomly selected spots of the deposited Au nanorod@Zr-MOF structures incubated in BPTCN solution (10−6 M). The corresponding Raman intensities at 1083 and 1183 cm−1 peaks are summarized in Fig. 4d. The SERS intensity fluctuates with the collected spot because of the varying distribution of the target molecules around the plasmonic hot spots. The relative standard deviation (RSD) values for these two peaks were calculated as 8.4% and 11.1%, respectively, demonstrating the good uniformity of the randomly stacked Au nanorod@Zr-MOF structures on the substrate.
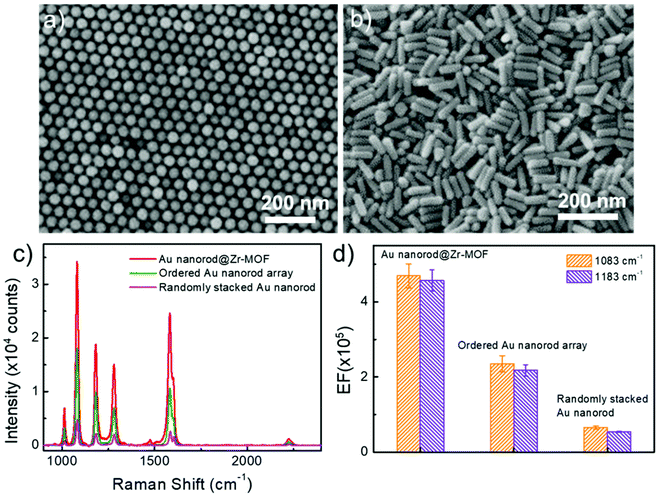
We further performed control experiments by using other two SERS-active substrates that consist of ordered and randomly stacked arrays of Au nanorods (Fig. 5a and b). The Au nanorod arrays were prepared using the same batch of colloidal Au nanorods (see Methods). After incubation in BPTCN molecule solutions (2 × 10⁻⁶ M), the three different nanostructures, i.e. ordered Au nanorod array, randomly stacked Au nanorod, and randomly stacked Au nanorod@Zr-MOF (shell thickness 3 nm) nanostructures, were examined by measuring the Raman spectra (Fig. 5c). It is clear that the randomly stacked Au nanorod@Zr-MOF exhibited the strongest SERS signal. The corresponding SERS EFs were calculated for Raman peaks at 1083 cm−1 and 1183 cm−1 (Fig. 5d). The EF of the randomly stacked Au nanorod@Zr-MOF is 2 and 8 times as large as that of ordered Au nanorod array and randomly stacked bare Au nanorod, respectively. For comparison, the Raman spectrum of BPTCN (2 × 10⁻⁶ M) using porous MOF as substrate was also collected (Fig. S6†). No obvious Raman signal of BPTCN could be observed, which is mainly due to that the SERS effect of molecular enrichment is weaker than that of plasmonic hotspots. Moreover, the Raman spectra of BPTCN at different concentrations (2 × 10⁻⁹ to 2 × 10⁻⁶ M) using randomly stacked Au nanorod as SERS substrate were measured (Fig. S7a†). Under all the molecular concentrations, the Raman intensities measured with Au nanorod@Zr-MOF substrate are much higher (7–11 times) than that of randomly stacked Au nanorods substrate (Fig. S7b†). As the concentration is as low as 2 × 10⁻¹⁰ M, randomly stacked Au nanorod substrate is unable to detect any BPTCN Raman signal. These above results further indicates that both plasmonic hotspots and the molecular enrichment effect of the MOF shell contribute to the superior SERS activity of the randomly stacked Au nanorod@Zr-MOF structures. The porous MOF shell with molecular enrichment function can dramatically improve the sensing selectivity of the SERS measurement and strengthen the molecule identification capability. The uniformity and reproducibility of the ordered Au nanorod array and randomly stacked bare Au nanorod substrates were also evaluated (Fig. S8†), and we found that the corresponding RSD values of ordered Au nanorod arrays were higher than that of random-stacking Au nanorods and Au nanorod@Zr-MOF structures. To evaluate the chemical stability of Au nanorod@Zr-MOF, additional oxidation and corrosion resistance tests were performed. The Au nanorod@Zr-MOF remains stable in crystal structure and SERS performance after annealing in air for 4 h or immersion in 3.5 wt% NaCl solution for one week (Fig. S9†), confirming its good chemical stability and practical applicability. The above results confirm that Au nanorod@Zr-MOF structures exhibit superior SERS performance in terms of the sensitivity, uniformity, reproducibility and stability. Apart from BPTCN molecule, other common molecules such as crystal violet (CV) and R6G were also used for SERS measurements. Fig. S10 and S11† show the Raman spectra of R6G and CV molecules when randomly stacked Au nanorod@Zr-MOF structures, ordered Au nanorod arrays, and randomly stacked Au nanorods were employed as SERS substrates, respectively. As expected, the Au nanorod@Zr-MOF substrate exhibits the strongest Raman signals for both R6G and CV molecules. Taken 1361 cm−1 of R6G as example, the EF of Au nanorod@Zr-MOF is 2 and 6 times as large as that of ordered Au nanorod array and randomly stacked bare Au nanorod, respectively. The detection limits of Au nanorod@Zr-MOF for both R6G and CV molecules are as low as 10−10 M, further suggesting that this SERS substrate has a wide application prospect in the optical detection field.
Conclusion
In summary, the core@shell Au nanorod@Zr-MOF structures with different Zr-MOF shell thickness (from 3 nm to 90 nm) were controllably synthesized via a simple room-temperature MOF assembly process. The Au nanorod@Zr-MOF exhibits increasing SERS activity when detecting small molecules as the MOF shell thickness decreases. Randomly stacked Au nanorod@Zr-MOF with the thinnest shell (3 nm) provides abundant plasmonic hotspots with large electric field enhancement. Besides, the thin MOF shell can enrich BPTCN molecules on sites of the plasmonic hot spots. Therefore, such Au nanorod@Zr-MOF structures exhibit superior SERS activity on sensitive BPTCN molecules detection, even at a molecular concentration as low as 2 × 10⁻¹⁰ M. The measured SERS EF is up to 4.7 × 10⁵, which is 2 and 8 times as high as that when ordered Au nanorod arrays and randomly stacked Au nanorods were employed as the SERS substrates, respectively. This work provides a promising strategy to prepare SERS substrates based on Au nanorods loaded with MOF structures with remarkably improved SERS performance.Conflicts of interest
The authors declare no competing financial interest.Acknowledgements
This work was supported by the National Natural Science Foundation of China (No. 51872125, 11904133, 22175076), Guangdong Natural Science Funds for Distinguished Young Scholar (2018B030306004) and GDUPS (2018), Guangzhou Basic and Applied Basic Research Foundation (No. 202102020217). L.S. acknowledges the support from the Pearl River Talent Recruitment Program (2019QN01C216) and Shenzhen Science and Technology Program (JCYJ20210324140805014).References
- G. C. Phan-Quang, X. Han, C. S. L. Koh, H. Y. F. Sim, C. L. Lay, S. X. Leong, Y. H. Lee, N. Pazos-Perez, R. A. Alvarez-Puebla and X. Y. Ling, Acc. Chem. Res., 2019, 52, 1844–1854 CrossRef CAS PubMed.
- S. Yang, X. Dai, B. B. Stogin and T.-S. Wong, Proc. Natl. Acad. Sci. U. S. A., 2016, 113, 268–273 CrossRef CAS PubMed.
- Y. Zhang, Y. Zhu and J. Li, Acta Phys.-Chim. Sin., 2021, 37, 2004052 Search PubMed.
- M. F. Cardinal, E. Vander Ende, R. A. Hackler, M. O. McAnally, P. C. Stair, G. C. Schatz and R. P. Van Duyne, Chem. Soc. Rev., 2017, 46, 3886–3903 RSC.
- G. Bodelón, V. Montes-García, V. López-Puente, E. H. Hill, C. Hamon, M. N. Sanz-Ortiz, S. Rodal-Cedeira, C. Costas, S. Celiksoy, I. Pérez-Juste, L. Scarabelli, A. La Porta, J. Pérez-Juste, I. Pastoriza-Santos and L. M. Liz-Marzán, Nat. Mater., 2016, 15, 1203–1211 CrossRef PubMed.
- J. Langer, D. Jimenez de Aberasturi, J. Aizpurua, R. A. Alvarez-Puebla, B. Auguié, J. J. Baumberg, G. C. Bazan, S. E. J. Bell, A. Boisen, A. G. Brolo, J. Choo, D. Cialla-May, V. Deckert, L. Fabris, K. Faulds, F. J. García de Abajo, R. Goodacre, D. Graham, A. J. Haes, C. L. Haynes, C. Huck, T. Itoh, M. Käll, J. Kneipp, N. A. Kotov, H. Kuang, E. C. Le Ru, H. K. Lee, J.-F. Li, X. Y. Ling, S. A. Maier, T. Mayerhöfer, M. Moskovits, K. Murakoshi, J.-M. Nam, S. Nie, Y. Ozaki, I. Pastoriza-Santos, J. Perez-Juste, J. Popp, A. Pucci, S. Reich, B. Ren, G. C. Schatz, T. Shegai, S. Schlücker, L.-L. Tay, K. G. Thomas, Z.-Q. Tian, R. P. Van Duyne, T. Vo-Dinh, Y. Wang, K. A. Willets, C. Xu, H. Xu, Y. Xu, Y. S. Yamamoto, B. Zhao and L. M. Liz-Marzán, ACS Nano, 2020, 14, 28–117 CrossRef CAS PubMed.
- H. Dang, S. Park, Y. Wu, N. Choi, J. Yang, S. Lee, S. Joo, L. Chen and J. Choo, Adv. Funct. Mater., 2021, 31, 2105703 CrossRef CAS.
- X. Song, W. Yi, J. Li, Q. Kong, H. Bai and G. Xi, Nano Lett., 2021, 21, 4410–4414 CrossRef CAS PubMed.
- F. X. Xiang, H. X. Li, L. J. Ping, G. X. Guang, J. Jian and Q. Z. Mei, Acta Phys.-Chim. Sin., 2016, 32, 1036–1042 Search PubMed.
- H. Xu, E. J. Bjerneld, M. Käll and L. Börjesson, Phys. Rev. Lett., 1999, 83, 4357–4360 CrossRef CAS.
- H. K. Lee, Y. H. Lee, C. S. L. Koh, G. C. Phan-Quang, X. Han, C. L. Lay, H. Y. F. Sim, Y.-C. Kao, Q. An and X. Y. Ling, Chem. Soc. Rev., 2019, 48, 731–756 RSC.
- G. C. Phan-Quang, H. K. Lee, H. W. Teng, C. S. L. Koh, B. Q. Yim, E. K. M. Tan, W. L. Tok, I. Y. Phang and X. Y. Ling, Angew. Chem., Int. Ed., 2018, 57, 5792–5796 CrossRef CAS PubMed.
- D. Li, X. Cao, Q. Zhang, X. Ren, L. Jiang, D. Li, W. Deng and H. Liu, J. Mater. Chem. A, 2019, 7, 14108–14117 RSC.
- X. Yan, Q. Chen, Q. Song, Z. Huo, N. Zhang and M. Ma, Nano Res., 2021, 14, 275–284 CrossRef CAS.
- J.-F. Li, Y.-J. Zhang, S.-Y. Ding, R. Panneerselvam and Z.-Q. Tian, Chem. Rev., 2017, 117, 5002–5069 CrossRef CAS PubMed.
- J. Chen, G. Liu, Y. Zhu, M. Su, P. Yin, X. Wu, Q. Lu, C. Tan, M. Zhao, Z. Liu, W. Yang, H. Li, G.-H. Nam, L. Zhang, Z. Chen, X. Huang, P. M. Radjenovic, W. Huang, Z. Tian, J. Li and H. Zhang, J. Am. Chem. Soc., 2020, 142, 7161–7167 CrossRef CAS PubMed.
- Z. Liu, Y. Gao, L. Jin, H. Jin, N. Xu, X. Yu and S. Yu, ACS Sustainable Chem. Eng., 2019, 7, 8168–8175 CrossRef CAS.
- F. Liu, L. Zhang and Q. Dong, Acta Phys.-Chim. Sin., 2019, 35, 651–656 CAS.
- Z. Gao, N. D. Burrows, N. A. Valley, G. C. Schatz, C. J. Murphy and C. L. Haynes, Analyst, 2016, 141, 5088–5095 RSC.
- G. Férey, Chem. Soc. Rev., 2008, 37, 191–214 RSC.
- O. M. Yaghi, M. O'Keeffe, N. W. Ockwig, H. K. Chae, M. Eddaoudi and J. Kim, Nature, 2003, 423, 705–714 CrossRef CAS PubMed.
- X. Yang, Y. Liu, S. H. Lam, J. Wang, S. Wen, C. Yam, L. Shao and J. Wang, Nano Lett., 2021, 21, 8205–8212 CrossRef CAS PubMed.
- C. S. L. Koh, H. Y. F. Sim, S. X. Leong, S. K. Boong, C. Chong and X. Y. Ling, ACS Mater. Lett., 2021, 3, 557–573 CrossRef CAS.
- Y. Li, J. Jin, D. Wang, J. Lv, K. Hou, Y. Liu, C. Chen and Z. Tang, Nano Res., 2018, 11, 3294–3305 CrossRef CAS.
- L.-W. Chen, Y.-C. Hao, Y. Guo, Q. Zhang, J. Li, W.-Y. Gao, L. Ren, X. Su, L. Hu, N. Zhang, S. Li, X. Feng, L. Gu, Y.-W. Zhang, A.-X. Yin and B. Wang, J. Am. Chem. Soc., 2021, 143, 5727–5736 CrossRef CAS PubMed.
- Q. Li, S. Gong, H. Zhang, F. Huang, L. Zhang and S. Li, Chem. Eng. J., 2019, 371, 26–33 CrossRef CAS.
- Y. Li, H. Guo, Z. Yin, K. Lyle and L. Tian, ACS Appl. Mater. Interfaces, 2021, 13, 5564–5573 CrossRef CAS PubMed.
- J. Zheng, X. Cheng, H. Zhang, X. Bai, R. Ai, L. Shao and J. Wang, Chem. Rev., 2021, 121, 13342–13453 CrossRef CAS PubMed.
- X. Ye, C. Zheng, J. Chen, Y. Gao and C. B. Murray, Nano Lett., 2013, 13, 765–771 CrossRef CAS PubMed.
- C. Kinnear, H. Dietsch, M. J. D. Clift, C. Endes, B. Rothen-Rutishauser and A. Petri-Fink, Angew. Chem., Int. Ed., 2013, 52, 1934–1938 CrossRef CAS PubMed.
- J. W. M. Osterrieth, D. Wright, H. Noh, C.-W. Kung, D. Vulpe, A. Li, J. E. Park, R. P. Van Duyne, P. Z. Moghadam, J. J. Baumberg, O. K. Farha and D. Fairen-Jimenez, J. Am. Chem. Soc., 2019, 141, 3893–3900 CrossRef CAS PubMed.
- H. Noh, C. Kung, T. Islamoglu, A. Peters, Y. Liao, P. Li, S. Garibay, X. Zhang, M. DeStefano, J. Hupp and O. Farha, Chem. Mater., 2018, 30, 2193–2197 CrossRef CAS.
- J. W. M. Osterrieth, D. Wright, H. Noh, C. W. Kung, D. Vulpe, A. Li, J. E. Park, R. P. Van Duyne, P. Z. Moghadam, J. J. Baumberg, O. K. Farha and D. Fairen-Jimenez, J. Am. Chem. Soc., 2019, 141, 3893–3900 CrossRef CAS PubMed.
- J. Li, W. Zhang, H. Lei and B. Li, Nano Res., 2018, 11, 2181–2189 CrossRef CAS.
Footnotes |
| † Electronic supplementary information (ESI) available: Methods including materials, preparation of involved Au nanorods and hybrid nanostructures, additional data including size distributions, control experiments, Raman spectra, simulated spectra and field intensity enhancement distributions. See DOI: https://doi.org/10.1039/d2nr00298a |
| ‡ These authors contributed equally to this work. |
| This journal is © The Royal Society of Chemistry 2022 |

