
 Open Access Article
 This Open Access Article is licensed under a Creative Commons Attribution-Non Commercial 3.0 Unported Licence
Molecular dynamics investigation of the structural and energetic properties of CeO2–MOx (M = Gd, La, Ce, Zr) nanoparticles†
João Paulo A.
de Mendonça
 a,
Tuanan C.
Lourenço
a,
Luis Paulo M.
Freitas
b,
Anderson A. E.
Santo
b,
Gustavo T.
Feliciano
b and
Juarez L. F.
Da Silva
*a
a,
Tuanan C.
Lourenço
a,
Luis Paulo M.
Freitas
b,
Anderson A. E.
Santo
b,
Gustavo T.
Feliciano
b and
Juarez L. F.
Da Silva
*a
aSão Carlos Institute of Chemistry, University of São Paulo, PO Box 780, 13560-970, São Carlos, SP, Brazil. E-mail: juarez_dasilva@iqsc.usp.br
bInstitute of Chemistry, São Paulo State University, PO Box 55, 14800-900, Araraquara, São Paulo, Brazil
First published on 28th September 2021
Abstract
CeO2-based materials have played a critical role in catalysis, where the substrate particles have reduced in size year by year due to experimental achievements in synthesis control. Thus, there is increasing interest to improve our atomistic understanding of the structural and energetic properties of mixed CeO2-based nanoparticles of 1 nm to 5 nm. Here, we employed classical molecular dynamics (MD) simulations to study the following solid solutions, CeO2–Gd2O3, CeO2–La2O3, CeO2–Ce2O3, and CeO2–ZrO2, using 5 compositions (0, 25, 50, 75, and 100%). The amorphization and re-cystallization process via MD simulations was employed to generate the nanoparticles, which were characterized by several analyses. We found that even in small CeO2 concentrations, the systems maintain the cubic fluorite structure and the truncated octahedron shape found in pure ceria, evidencing the strong influence of Ce4+ on the nanoparticle morphology due to the higher phase transition temperature of the CeO2 compound. On the other hand, the addition of the 3+ species leads to the spontaneous appearance of higher concentrations of solvated cations and vacancies near to the surface of the CeO2-based solutions. Beyond that, the 3+ species also influence the electrostatic potential in the nanoparticle surface, and hence controlling the 3+–4+ ratio may be an interesting approach to control the nanoparticle physicochemical properties for catalytic purposes.
1 Introduction
Cerium-based oxides have played an important role in several industrial applications,1,2 which spread from catalytic3,4 to biomedical applications.5,6 Recently, G. Lu et al. highlighted their importance in electrocatalysis, namely, in the hydrogen and oxygen evolution reactions.7 Those applications have been possible due to the high figures of merit of cerium oxides (CeOx, ), in particular, their oxygen storage capacity, which is interconnected with the formation of oxygen vacancies and changes in the oxidation state of Ce cations, i.e., from Ce4+ (CeO2) to Ce3+ (Ce2O3).8,9
CeO2 (ceria) has a fluorite crystal structure (space group Fm![[3 with combining macron]](https://www.rsc.org/images/entities/char_0033_0304.gif) m), in which each cerium atom is bound to 8 oxygen atoms, while each oxygen is bound to 4 Ce atoms,10 and its reduced form (Ce2O3) crystallizes in the hexagonal La2O3-type structure.11 The CeO2(111) surface has the lowest surface energy, and hence it is the most abundant surface on ceria particles, while the (100) and (110) surfaces are less stable.12 Those less stable surfaces have been found in large truncated octahedron-like particles with diameters from nano up to micro size.13,14 Several studies have indicated a direct correlation between the morphology of cerium oxide particles and their applications, especially in the field of catalysis, in which the surface termination and defects play a crucial role in the presence of oxygen vacancy formation, oxygen diffusion, low-coordination sites, oxidation state of the Ce cations, etc.9,12
m), in which each cerium atom is bound to 8 oxygen atoms, while each oxygen is bound to 4 Ce atoms,10 and its reduced form (Ce2O3) crystallizes in the hexagonal La2O3-type structure.11 The CeO2(111) surface has the lowest surface energy, and hence it is the most abundant surface on ceria particles, while the (100) and (110) surfaces are less stable.12 Those less stable surfaces have been found in large truncated octahedron-like particles with diameters from nano up to micro size.13,14 Several studies have indicated a direct correlation between the morphology of cerium oxide particles and their applications, especially in the field of catalysis, in which the surface termination and defects play a crucial role in the presence of oxygen vacancy formation, oxygen diffusion, low-coordination sites, oxidation state of the Ce cations, etc.9,12
Although ceria has high figures of merit, its applications in particular fields require higher stability, easiness to create oxygen vacancies, higher oxygen diffusion, etc. In the literature, we can see that some recent applications of ceria are built taking advantage of the tunability and engineering of those properties in nanoparticles. For example, it is already known that ceria can be used to build hydrophobic nanoparticles for coating, although powder or bulk ceria is slightly hydrophilic.15 The CeO2(111) surface is more hydrophobic and the edges are the main factor in the surface–water interaction,13 so this application is only possible because of the particle edge abundance. However, our atomistic understanding of the CeO2 surface–edge relation is far from satisfactory when compared with surface–edge effects in metallic nanoparticles.16–19 Additional to that, Tarnuzzer et al.20 proposed the use of ceria nanoparticles with diameters from 2 up to 5 nm to repair cell damage induced by radiation, which explores the antioxidant properties of ceria particles with a similar ratio of Ce3+ and Ce4+ cations on the particle surfaces.
Doping or mixing of CeOx with different oxides is an alternative strategy to tune its physical–chemical properties.21–25 For instance, it is already established that the formation of a solid solution of ZrO2 with CeO2 can enhance the reducibility of Ce4+ towards Ce3+ cations;22 at the same time, solid solutions with different lanthanide atoms can enhance the oxygen conductibility.21,26 Furthermore, the formation of solid solutions of CeO2 with Gd2O3, La2O3, and ZrO2 has attracted attention for catalysis applications. For example, Gd2O3 doped Ce2O3 has already been reported as a good ionic conductor for catalytic applications27 and its properties can be improved with co-doping with different rare-earth elements.28 Since these materials are applied typically at high temperatures, the phase diagram is also of interest and some important insights have been obtained in this direction. For example, Andrievskaya et al. reported the La2O3–CeO2 phase equilibrium on large systems for temperatures of 1100 °C to 1500 °C,29 while Zguns et al. theoreticaly predicted similar results for Gd2O3–CeO2 mixtures.30
In theoretical studies, ceria-based mixed oxides can be approached in many different methodologies and scales. To cite a few examples, Balducci et al. studied the surface and reduction energies of CeO2–ZrO2 using slab models,31 while Bulgakov et al. analysed the solution stability and oxygen diffusion in CeO2–ZrO2 bulk models32 and Koleva et al. studied the impact of Zr on the reducibility of small CeO2 clusters.33 On the other hand, little is known about the behavior of those mixtures in large solid solution particles with more than 1000 atoms.34 Based on density functional theory (DFT) calculations, Felício-Sousa et al. studied the energetic stability of small CenZr15−nO30 nanoalloy particles, where they reported a negative excess energy (stable) for all compositions,25 while Mucelini et al. addressed the formation of ZrO2-like structures on CeO2(111).24 Although DFT calculations yield an accurate description of the electronic and structural properties, those calculations have an expensive computational cost, and hence the study of temperature effects via molecular dynamics is forbidden for large particles.
A less expensive alternative, based on force field molecular dynamics (MD), was employed by Sayle et al. to study the amorphization and recrystallization of ceria particles, in which it was possible to address successfully CeO2 particles with diameters up to 8 nm with different shapes, such as nanorods, polyhedral nanoparticles and mesoporous ceria, with a good correlation with the experimental findings.35–37 Using MD simulations, Sayle and coworkers were also able to correlate the reactivity, morphology, and composition of CeO2 nanoparticles in different applications such as supercapacitors and the oxi-reduction process.36,37 Beyond that, the amorphization and recrystallization methodology can be easily extended to mixed particles and other systems with an adequate force-field.38,39
Therefore, all those experimental5,6,10,11,14,15,21,26–29 and theoretical8,9,13,22,25,30,31,33,35 studies have provided a great contribution to improve our atom-level understanding of mixed CeO2–MOx nanoparticles; however, our atomistic understanding is far from complete. To improve our atomistic understanding, we employed classical MD simulations to investigate the crystallization process of mixed ceria-based nanoparticles, namely, CeO2–Gd2O3, CeO2–La2O3, CeO2–Ce2O3, and CeO2–ZrO2. For that, we employed nanoparticles formed by 500 or 864 cations combined with the appropriate number of oxygen anions, which generates particles with sizes from 1 nm to 5 nm.
We found from our analyses that the CeO2 morphology and structure (fluorite crystal truncated octahedron-like particles) are preserved for all mixed nanoparticles, which can be explained as an equilibrium mechanism between the crystal lattice and the surface energy of each pure material. For CeO2–M2O3, M3+ cations and oxygen vacancies (defects) are abundant on the surface region, showing that Coulomb interactions and the ionic radii have a key role as a stabilising mechanism on oxide alloys. In addition, the final alloyed structures have a complex combination of positive and negative electrostatic potentials, modulated by the concentration of the metal atoms, which is advantageous in the catalysis context.
2 Theoretical approach and computational details
We have the aim to obtain a deep atomistic understanding of the crystallization process of finite-size CeO2–MOx solid solutions, which is crucial knowledge to enhance the applications of CeO2-based compounds in catalysis.40,41 Thus, it requires a description of temperature effects, time-dependent phenomena, point defect formation (e.g., oxygen vacancies), shape (surface) evolution along the crystallization process, etc., where particle size effects play a crucial role. Therefore, it is a challenging problem that requires a strategical balance between an atom-level description and computational cost.42 To achieve our goals, we considered two particle sizes, namely, 500 and 864 cations with the appropriate number of oxygen anions, which yields oxide particles with diameters similar to experimental observations,43,44 which are large enough to show ordered core regions, internal nucleation, and domain walls. Systems with that size are not affordable by ab initio MD calculations, and hence all MD simulations were based on atomistic force field simulations, as described below.2.1 Molecular dynamics and force field
Our MD simulations are based on the Born-like force field, which is based on the combination of the long-range Coulomb potential and the short-range Buckingham potential.46 It has been used for several CeO2-based studies for a wide range of applications,47,48 including amorphization/recrystallization simulations of finite-size oxide systems.45,49 The total charge of each system was set to zero by adjusting the number of oxygen atoms to balance the positive charge (cations), e.g., by building the system directly as the combination of Ce4+O22− and M23+O32−. This can be seen as an advantage of the approach proposed here, since the system can be optimized for a given configuration that preserves a specific 3+/4+ ion ratio, which is desirable to understand the oxygen vacancy distribution and its effect on the structural and energetic properties in relation to the system composition.From several initial tests, we selected the force field parameters developed by Grimes and coworkers45 instead of Sayle's original ones.49 From our knowledge, the parameters proposed by Sayle were built for different applications, in particular, with a focus on unalloyed oxide systems, and they do not include parameters for all the desired cations in our simulations. On the other hand, Grimes's parameters were derived from mixed oxides of 3+ and 4+ cations, and hence are more suitable for our applications.
The potential term for the total energy of the system is written as follows,
 | (1) |
| Interaction | A (eV) | ρ (Å) | C (eV Å) |
|---|---|---|---|
| Ce4+–O2− | 1809.68 | 0.35470 | 20.40 |
| Ce3+–O2− | 2010.18 | 0.34490 | 23.11 |
| Gd3+–O2− | 1885.75 | 0.33990 | 20.34 |
| La3+–O2− | 2088.89 | 0.34600 | 23.25 |
| Zr4+–O2− | 1502.11 | 0.34770 | 5.10 |
| O2−–O2− | 9547.96 | 0.21920 | 32.00 |
| M–M′ | 0.00 | ∞ | 0.00 |
All the molecular dynamics simulations were carried out using the LAMMPS package50 with a time step of 1 fs and using the standard implementation of the Verlet integration for the canonical (NVT) ensemble. Cubic simulation boxes of 20 nm were set for all simulations, which are approximately five times larger than the largest particles. Periodic boundary conditions were employed for all simulations. Thus, in order to avoid nanoparticle translation and anomalous rotations being counted as contributions to the thermal energy, the particles were re-centered at the origin coordination system at each time step and the angular and linear momentum were set to zero for each 500 time steps. For analysis, the atomic positions and energies were saved at each 500 steps.
2.2 Amorphization and annealing
The framework for the amorphization of ordered structures and their recrystallization was adapted from the procedures reported by Sayle for CeO2 nanoparticles.35 Based on several MD simulations for smaller and larger particles, our amorphization process includes seven separate steps of NVT simulations:(1) 200 ps at 4500 K using 2 layers free and 4 layers frozen.
(2) 300 ps at 4500 K using 4 layers free and 2 layers frozen.
(3) 100 ps at 4500 K with all atoms free.
(4) 300 ps at 4500 K with external tension.
(5) Simulation with a temperature ramp from 4500 K to 5500 K for 400 ps.
(6) Simulation at 5500 K for 100 ps.
(7) Simulation over 1000 ps with a temperature ramp from 5500 K to 8500 K, and the amorphous CeO2 samples were obtained.
To reduce the computational cost, we transformed the amorphous CeO2 samples into the initial amorphous structures for the recrystallization process for all mixed-oxides systems, namely, CeO2–Ce2O3, CeO2–Gd2O3, CeO2–La2O3, and CeO2–ZrO2 with 0, 25, 50, 75, and 100% CeO2 concentration, by random cation substitution and creation of oxygen vacancies to maintain the total charge of the particles as zero. The recrystallization procedure performs 1 ns lowering of the temperature from 8500 K to 5500 K. Then, we ran subsequent 1 ns production simulations at a constant temperature and 1 ns ramps that decreased the total temperature 100 K at a time. It finishes once the temperature simulation reaches 10−3 K (replaces 0 K), i.e., a total simulation time of 112 ns for each system.
2.3 Analyses
Several analyses were performed along the present study, which are defined below, while additional technical details can be found in the ESI.†After the minimization step, we performed a short NVT equilibration simulation over 10 ps at 2000 K. This temperature is justified, as it is still far from the melting point of the material55 and it is enough to enable oxygen diffusion. All the US simulations were performed over 15 ns using the GROMACS package,56 version 2018.3, and its in-built tools for data analysis.57 Because of the large number of possible atomic arrangements in the CeO2-based mixtures,58 we carried out US simulations focusing only on the pure CeO2 nanoparticles, which was combined with the oxygen vacancy analysis to improve our atomistic understanding of the oxygen mobility.
3 Results and discussion
Based on the structures obtained by MD calculations, we characterized the nanoparticle morphology, phase transition, stability, radial distribution functions, oxygen vacancy distribution, oxygen mobility, electrostatic potential, etc. For simplicity, our analysis and discussion here will be based only on the largest particles (i.e., the ones with 864 cations). Similar results were found for the smaller particles and are fully reported within the ESI.†3.1 Nanoparticle morphologies
In the present MD simulations, the liquid to solid phase transition occurs at the temperature at which the shape of the nanoparticle consolidates itself, i.e., there are no significant structural changes for smaller temperatures, except for local atomic rearrangements. Fig. 1a shows the structures of the pure oxides for all systems at 3 selected temperatures, in which the structures obtained below the phase transition are visually similar for all the pure oxides. Thus, for simplicity, we will focus our discussion only on the obtained 0 K final structures. | ||
| Fig. 1 Molecular representation of the mixed oxide nanoparticles: (a) Sample geometries for pure nanoparticles at different temperatures during the annealing process. (b) Graphical representation of all the mixed nanoparticle geometries with respect to the M/Ce4+ ratio (M = Ce3+, Gd3+, La3+ and Zr4+) at 0 K obtained from the annealing simulations for the structures based on 2592 atoms. | ||
The pure CeO2 nanoparticle shows a truncated octahedron-like structure, which is expected from previous experimental61,62 and theoretical studies,13,35 showing that the combination of the procedure and force-field parameters is working well and presenting proper results. The octahedron-like structure is characterized by the presence of the close-packed (111) surface, which covers most of the nanoparticle facets, which are interconnected by small (100) facets. Those trends can be explained by the highest stability of the oxygen terminated close-packed (111) surface (lowest surface energy) compared with the less stable and open (100) and (110) surfaces. For example, the DFT-PBE surface energies are 0.45 J m−2 for (111), 1.28 J m−2 for (100), and 0.86 J m−2 for (110).63
The pure ZrO2 and Gd2O3 systems also presented the truncated octahedron-like shape with dominance of the (111) surface. In this case, comparatively larger (100) and smaller (111) facets are observed, which is indicative of a different (111)/(100) surface energy ratio compared to the CeO2 system.64 The edges in the polyhedron created by the ZrO2 nanoparticles are also more irregular, with substantial oxygen rearrangements. In particular, Gd2O3 is found in a configuration that has a crystal grain boundary, which originated from a phase transition as a consequence of a double nucleation in the critical temperature. As a consequence, the Gd2O3 nanoparticles do not show a perfect octahedron shape, but the combination of two pieces of different truncated octahedra, Fig. 1a. Ce2O3 and La2O3 present an irregular scheme of faces in the surface, with a more complex final geometry with no clear face definition. Thus, this evidence indicates that these two systems are in different crystal structures than the cubic fluorite structure reported for CeO2. Furthermore, those structures have weaker non-local ordering, which will be proved by X-ray analysis in the section below.
All nanoalloys ended the annealing process with a nanoparticle shape similar to the pure CeO2, i.e., in a truncated octahedron-like structure, Fig. 1b. Our results show that the behavior of the mixed systems in the case of ZrO2 and Gd2O3 alloys with CeO2 can be explained by the combination of the pure system behavior. A decrease in the concentration of cerium species results in an increase in the surface area of (100) faces and a decrease in the (111) ones (even with this decrease, the (111) faces are the largest ones in all cases). Ce2O3 and La2O3 alloys have the same geometry and face structure as the pure CeO2, which implies that the more amorphous systems just follow the crystal structure and arrangement imposed by CeO2. In particular, (CeO2)0.25(La2O3)0.75/2 also presents a grain boundary like the one observed in pure Gd2O3. Grain boundary formation was observed in two simulations with different materials; however, we cannot conclude that this phenomenon is related to the atomic species itself. In our observation, it is associated with multiple nucleation sites along the phase transition, which is more likely in larger particles. In agreement, this behavior was not observed for any of the 500 cation particles.
3.2 Atomic local ordering and arrangement
From Fig. 2, we can conclude that the CeO2, Gd2O3 and ZrO2 particles have truncated octahedra-like structures and display almost the same crystalline XRD signature. In the case of the CeO2 and ZrO2 systems, XRD confirms the fluorite cubic structure with space group Fmm, associated with the well ordered bulk in the nanoparticle core, and different lattice parameters. The small peaks near 20° and 45° also show that the Gd2O3 nanoparticle is, in fact, a more intricate cubic structure with space group Ia, as expected for this material.65
 | ||
| Fig. 2 X-ray diffraction pattern obtained for the nanoparticles based on our 864 cation model in 500 ps molecular dynamics at 300 K starting from the 0 K geometry. The simulation aims to capture the signature with a Cu X-ray source (λ = 1.541838 Å). | ||
Pure Ce2O3 and La2O3 have a common behavior that is not the traditional one shown by any other sample, including the mixtures. Their XRD patterns, Fig. 2, display broader peaks and no strong signal for larger angles. This by itself is a signal that the particle does not show long range order. Fig. 3(a) shows the partial Ce3+–O2−g(r) for our obtained Ce2O3 nanoparticle, comparing it to the same three crystals. In this case, the structure does not show exactly any of the patterns, but it has a strong resemblance with the cubic phase, e.g., the same Ia of the Gd2O3 nanoparticle. But, in any of the cases, it is impossible to attribute a specific crystal structure to those two particles.
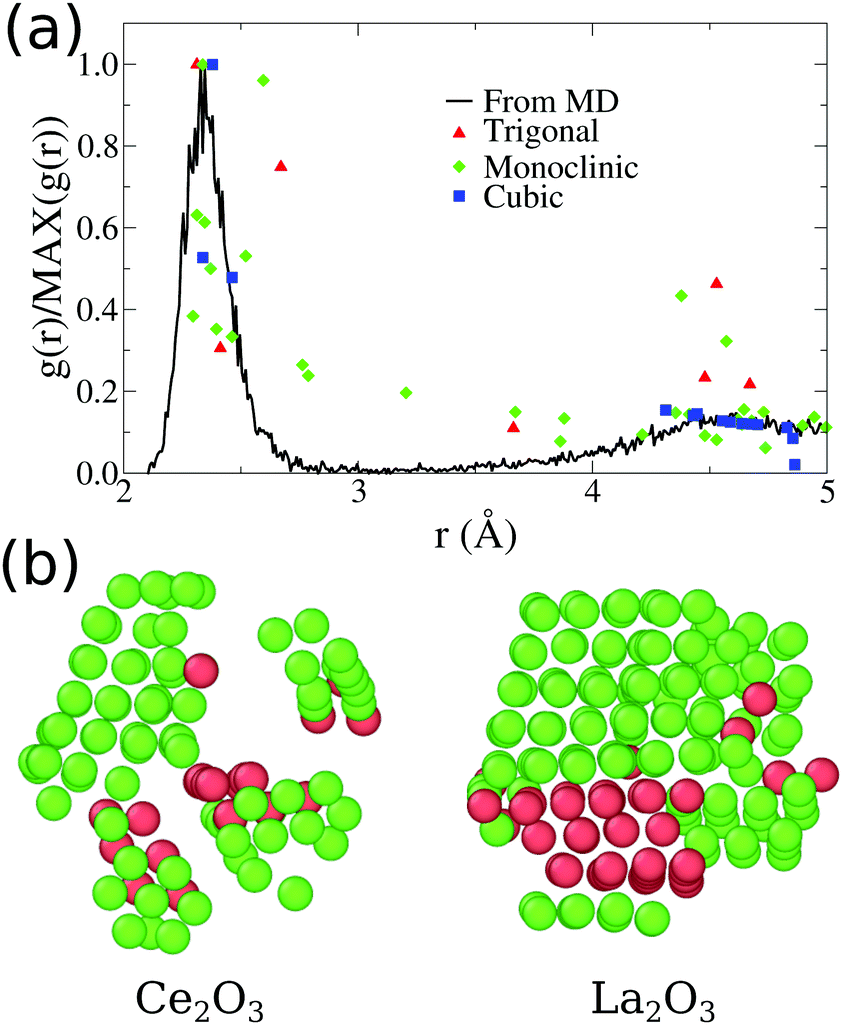 | ||
| Fig. 3 (a) Comparative plot for partial Ce3+–O2−g(r) for our final Ce2O3 nanoparticles obtained from molecular dynamics. The points indicated in the plot are the position and intensities for the pure infinite crystal in three different phases. (b) Visualization of low strain cations obtained for our final Ce2O3 and La2O3 models, using OVITO.51 The atoms shown as green are classified as cubic crystal atoms, while the red ones are trigonal. | ||
A direct inspection of those two systems reveals an intricate structure with many local crystallographic domains. In Fig. 3(b), we used the OVITO51 analysis tool to exclude all oxygen atoms of the structure and analyse only the cation sublattice. The atoms with low strain, except for the surface atoms, were classified as FCC (green atoms) or HCP (red atoms) sub-lattices, which correspond directly to the cubic Ia and trigonal Pm1 phases of Ce2O3, respectively. Additionally, this analysis shows that 88.4% of the cerium atoms and 77.3% of the lanthanum atoms are in the surface or in non-crystalline sites. As seen in Fig. 1, the surface shows local order and it is responsible for 36.23% of cerium and 34.95% of lanthanum in those systems (computed using the cation FCC sub-lattice coordination number, considering as part of the surface the atoms with coordination smaller or equal to 10). That points us to the conclusion that the grain boundaries and amorphous internal regions are responsible for the larger part of the cations in the structure. In conclusion to that, the pure Ce2O3 and La2O3 nanoparticles obtained in this work have a complex topology, with grains of cubic and trigonal structures and amorphous grain boundaries.
For the mixed systems, we see the same behavior as for the pure CeO2 system. Even with only 25% of the cations as Ce4+, the nanoparticle displays the truncated octahedron shape, Fig. 1. Also, both g(r) and the XRD (Fig. 2) of those systems indicate that even locally the system behaves as CeO2, regarding the local and global ordering. The major changes are the lattice parameters, which adjust to better suit the mixed species, and the loss of precision in the partial g(r) for the O2−–O2− interaction, which indicates a less ordered oxygen sub-lattice.
3.3 Phase transition
The annealing process simulated here covers a wide range of temperatures, starting from 8500 K and going up to 0 K. As discussed before, those systems start in completely amorphous configurations, which led to different crystal arrangements by the simulations. In order to do so, we found that the system undergoes a phase transition that can be associated with the liquid/amorphous to solid/crystal transition, Fig. 1. In this section, we discuss the process of the phase transition of the nanoparticles.Fig. 4 presents the overall phase transition observed in all samples, which is illustrated by the pure CeO2 nanoparticles. The phase transition starts by a nucleation process that takes place in the atomic positions near to the surface of the nanoparticle. Those atoms are in a region that provides more disorder, since the surface yields additional freedom and mobility to the atoms. This mobility, as the temperature decreases, helps the atoms to find the optimal positions, e.g., the lowest energy coordinates, in relation to the others and it starts the nucleation. Once the initial crystal seed is formed, the structure is completely converted to its final crystalline form in less than 100 ps. In the already discussed cases in which the final crystal has interfaces or grain boundaries, the geometry is defined at this time, and the grain boundaries consolidate in the same time window.
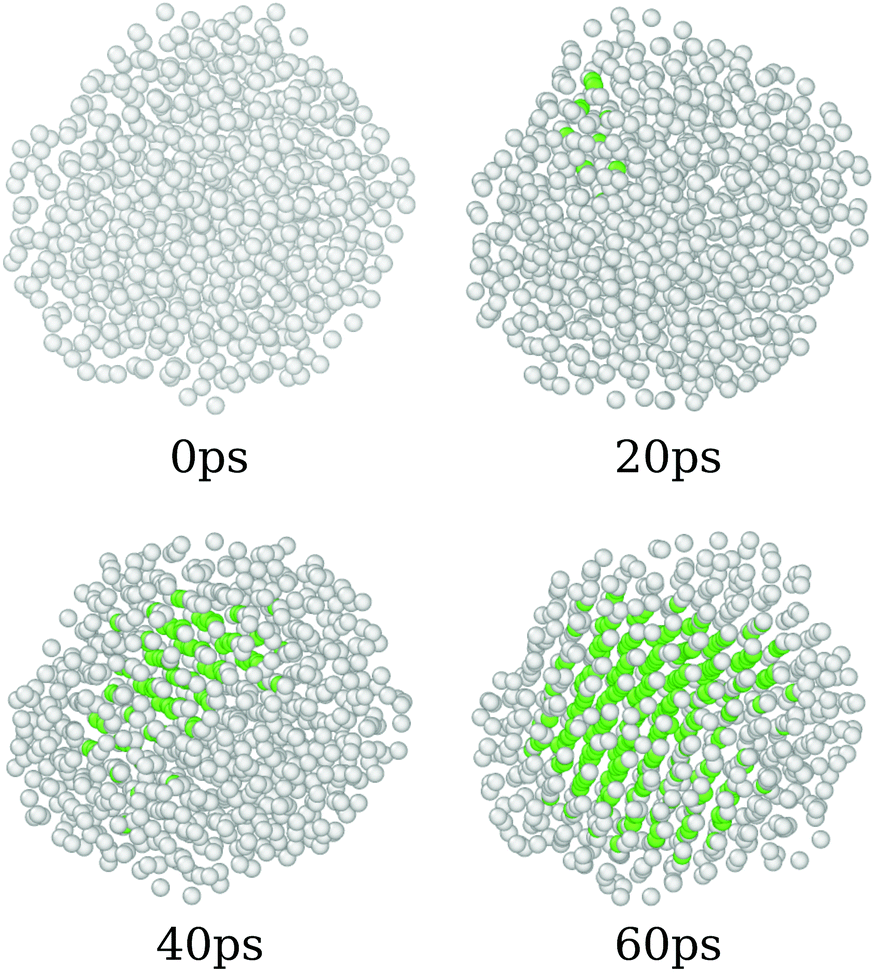 | ||
| Fig. 4 Cations of the pure CeO2 nanoparticle, colored by the neighborhood crystalline structure. Green atoms are located in the face-centered cubic sub-lattice sites, which are expected in the bulk fluorite CeO2 crystal, while white ones are in an amorphous or incomplete neighbourhood. | ||
The phase transition temperature observed here is not enough to estimate a specific value for the systems, since there is only one experiment and the compositions of the crystal in the nucleation seed can influence its value. Hence, we studied the phase transition temperature in two ways, both exploring the fluctuation of extensive variables. As both ways describe the same phenomena, we present here the energy evolution over temperature, Fig. 5, and in the ESI† we present the density evolution over time in the simulation, Section 6.3. As shown in Fig. 5, the pure CeO2 has the highest phase transition temperature in Fig. 5, and hence the decrease in the Ce4+ ratio in the nanoparticles leads to a decrease in the temperatures at which the transitions happen. The observed phase transition temperatures are not linear with the nanoparticle composition, fluctuating around this behavior. This pattern is seen for all nanoparticles, except for the CeO2–ZrO2 mixtures. While the other systems show a correlation between the phase transition temperature and the relative Ce4+ concentrations in the mixture, in the Zr4+-based systems, the 50% nanoparticle shows a phase transition at higher temperature than the 25% and 75%.
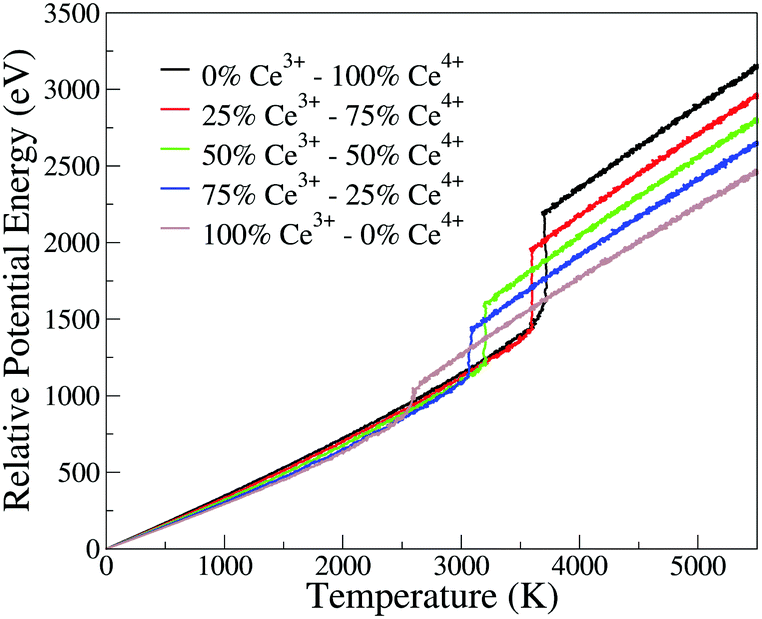 | ||
| Fig. 5 Potential energy of the nanoparticle (relative to the 0 K configuration) as a function of instantaneous temperature for the CeO2–Ce2O3 864 cation nanoparticles. Analogous plots for all systems are provided as ESI.† | ||
3.4 Relative stability via excess energy
To address the relative stability of those systems, we calculated the excess energy for the mixed systems, EA+Bexc, which is defined as follows,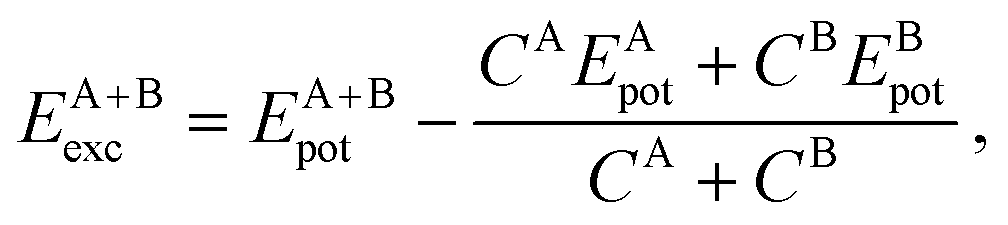 | (2) |
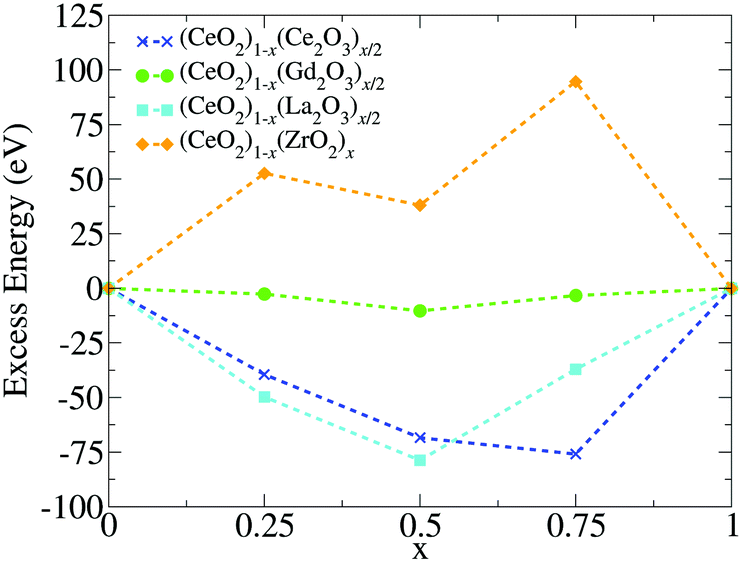 | ||
| Fig. 6 Excess energy (Eexc) calculated from the structures at zero temparature. | ||
The apparent anomaly observed in the phase transition of the CeO2–ZrO2 mixtures is here explained by the lower excess energy at the 50% composition, when compared with the 25% and 75% mixtures. This behaviour seems to be a characteristic of the scale, since previous DFT studies have shown that CeO2–ZrO2 mixtures are stable on smaller scales and have a non trivial dependency between concentration and excess energy.25 In the negative excess energy cases, the minimal excess energy observed for each composition is −75.9 eV in (CeO2)0.25(Ce2O3)0.75/2, −10.4 eV in (CeO2)0.5(Gd2O3)0.5/2, and −78.8 eV in (CeO2)0.5(La2O3)0.5/2. So, the observed stability of these solid mixtures follows the order La3+, Ce3+, Gd3+, and Zr4+. In this same order, the Buckingham potential loses strength (i.e., A and C decrease) and the Coulomb interaction contribution to the total energy of the system increases. Thus, in our results, the relative strength of the Coulomb term in the atomic interactions has a negative correlation with the solution stability.
3.5 Oxygen vacancy distribution
So far, we have analyzed these oxide structures from the point of view of the morphology and the involved chemical species. However, if we are interested in applying this material in catalysis, we also have to focus on its ability to accept oxygen atoms in its structure. To analyze this, we studied the vacancies from both the point of view of their positions and the temporal evolution of their population in the nanoparticles. First, we found a very small number of oxygen vacancies in the pure CeO2 structures (17 in the final structure at 0 K), which are related to surface edges and defects on the (100) surfaces, as shown in Fig. 8. The remaining systems show more vacancies in general, and this can be seen in Fig. 7a. The Ce2O3 and La2O3 systems are the ones that present the largest number of vacancies, followed by the cubic Gd2O3 and ZrO2 systems. The mixtures display a behavior that is intermediate between the pure systems with small deviations, which indicates that the mixing of the materials induces the formation of vacancies in the nanoparticles.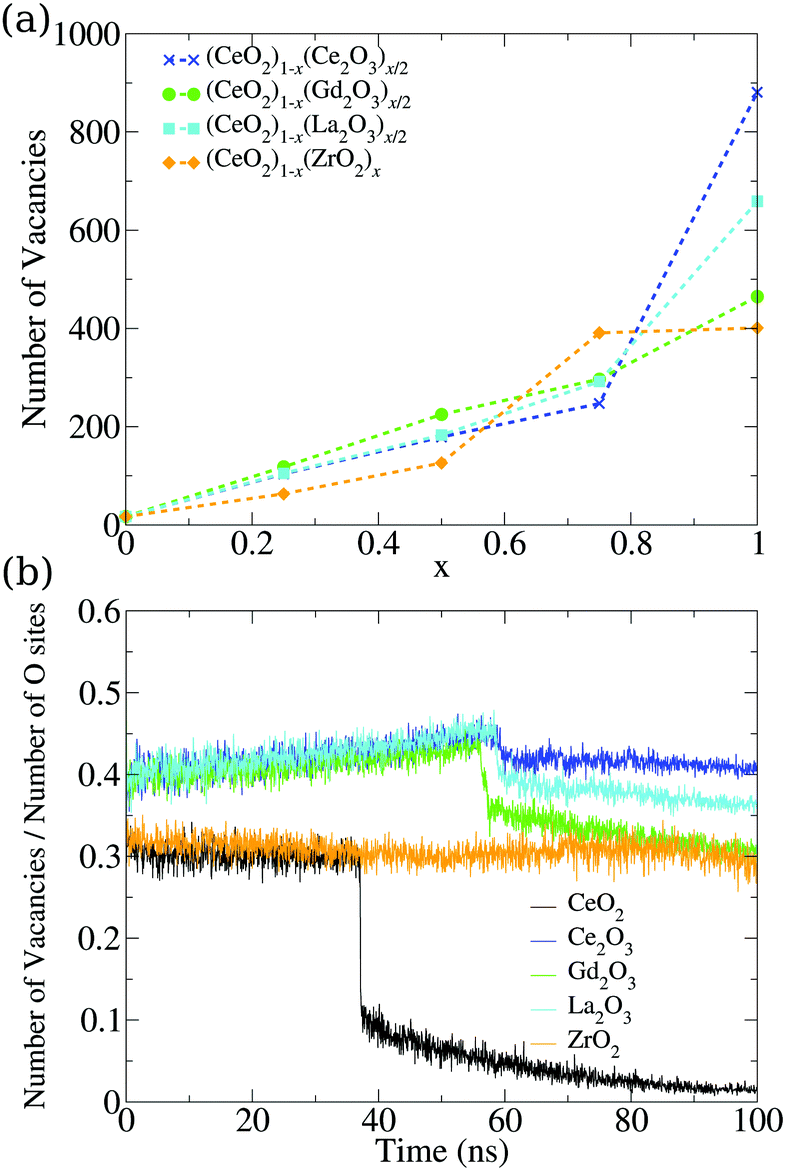 | ||
| Fig. 7 (a) Dependency of the number of oxygen vacancies in the final structure on the relative concentration of the cations in mixed nanoparticles. (b) Evolution of the vacancy percentile in the oxygen sites of the pure structures. The total number of oxygen sites is also evolving, and is presented in Fig. S36 (ESI†). | ||
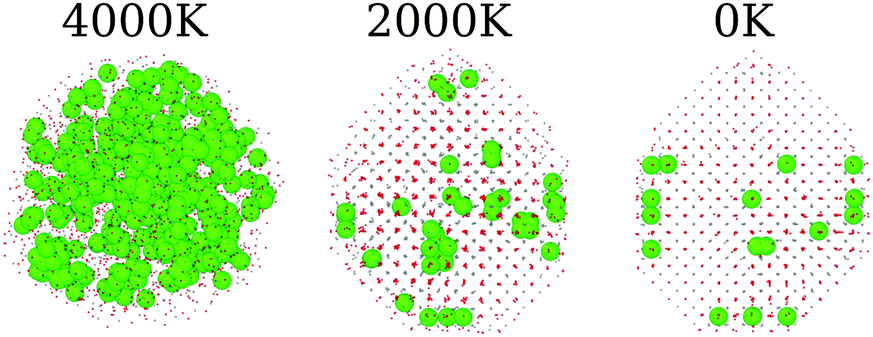 | ||
| Fig. 8 Vacancy (represented as green spheres) distribution on CeO2 pure systems at three different temperatures. The Ce and O atoms are represented by gray and red dots, respectively, for ease of visualization of the vacancy positions. | ||
The same behavior can be seen in the evolution of the ratio between the number of vacancies and the number of oxygen sites in the structures seen in Fig. 7b. Crystallization generates a discontinuity in the occupation of vacancies for most of the systems, with the exception of ZrO2, which is indicative of the low or no mobility of the oxygen atoms in the system. The M2O3 systems displayed a small discontinuity, which showcases the oxygen mobility and the local rearrangement to fill the vacancies in the phase transition. Comparing this graph and the evolution of the number of oxygen sites, we found that Ce2O3 and La2O3 do not show discontinuities in the number of oxygen sites in the phase transition, which is a sign of a smooth transition from a liquid to a more amorphous solid in those materials.
CeO2 and Gd2O3 have transitions that lower the number of oxygen sites, while in the ZrO2 nanoparticle this number increases. In both cases, there is a strong reorganization of the system that indicates crystallization. The slow increase in the vacancy site count even in the liquid phase is again a sign of low oxygen mobility in ZrO2. The increase seen in the phase transition shows that the system undergoes strong reorganization that gives the oxygen and cations the “chance” to rearrange themselves and go to a number of sites similar to the ones obtained continuously by the other systems in the liquid phase. This strong rearrangement is in agreement with the energy fluctuation in the phase transition, e.g., Fig. 5, where ZrO2 is the largest one after CeO2.
3.6 Oxygen mobility
As described above, we analyzed the energy barriers when moving an oxygen atom to a vacancy in different regions in the pure CeO2 nanoparticle structure as in the schematic representation of Fig. 9b. In the first case, when moving an oxygen atom located in the first layer to a vacancy located at the second layer of the nanoparticle, this motion is energetically unfavorable. Hence, the displacement of anions from the second layer of oxygen to fill vacancies on the surface of the particle is energetically favorable, which can be seen in Fig. 9a(i).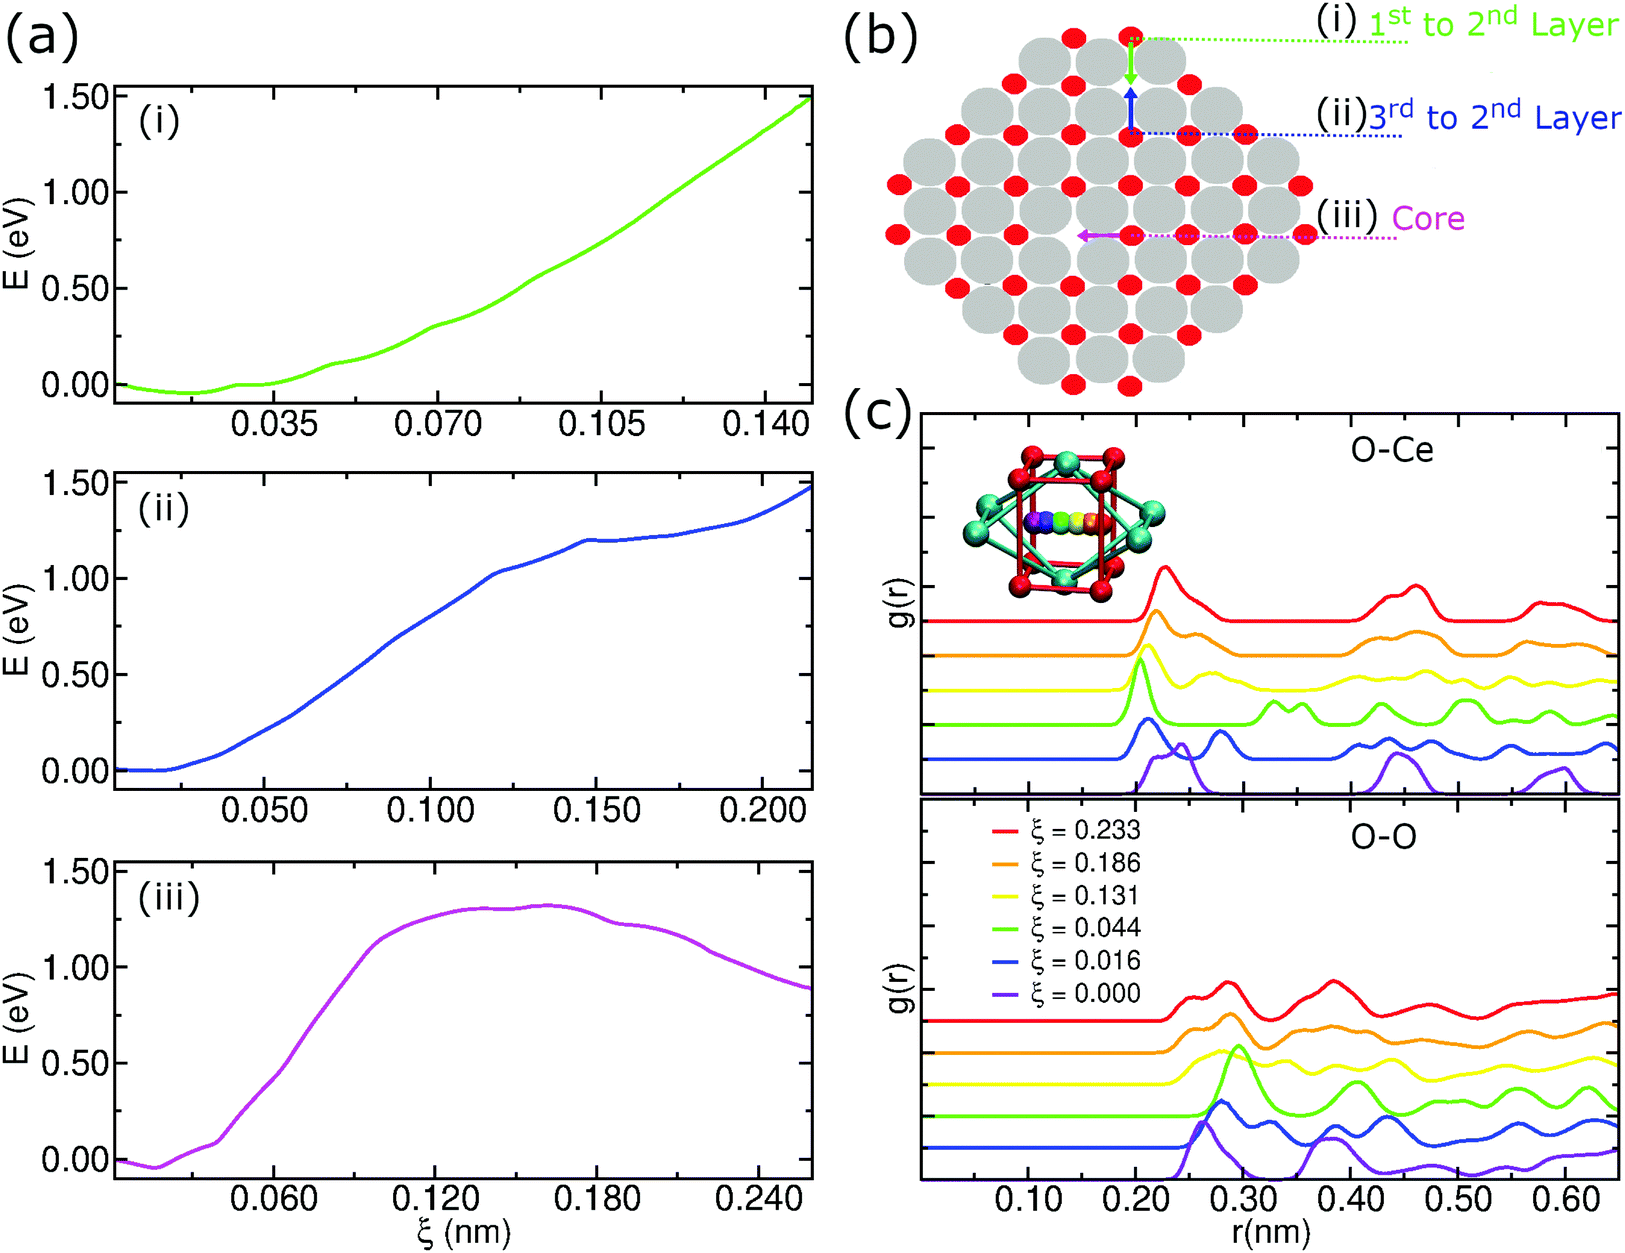 | ||
| Fig. 9 (a) Energy barriers for oxygen atom migration to a vacancy. The US was calculated in three different regions of the particle, where the oxygen atoms were moved from their initial position to vacant positions in which they were the first neighbors. All initial positions coincide with the origin of the plot. (b) Schematic representation of the moving oxygen atom trajectories for the US simulation. (c) Radial distribution function obtained for the oxygen atom migration in the core indicating the Ce atom and O atom distribution relative to the moving O atom. The coordinate ξ is the distance traveled by the moving O atom in nm, which represents different windows of the US simulations. | ||
We also considered the energy barrier to move an oxygen atom located in the third oxygen layer to a vacancy site in the second layer, Fig. 9a(ii). The energy difference between the start position, i.e., the origin of the graph, and the end position at ξ ≈ 2.15 Å is close to 1.5 eV. Although it may be overestimated due to the limitations of the US technique, this value allows a qualitative interpretation that shows that the migration of the O anions from the third oxygen layer to a vacancy site of the particle is also energetically unfavorable. In this scenario, O atoms in the second oxygen layer are strongly susceptible to local rearrangement if located near an oxygen vacancy.
Finally, we considered the displacement of an oxygen atom to a vacancy site that was artificially created by removing the oxygen atom nearest to the geometric center of the nanoparticle. Even in this case, we notice an energy barrier of the order of 1.5 eV, but, unlike the previous situations, there is a peak of energy during the displacement, Fig. 9a(iii). This result shows that even at the center of the nanoparticle there is a potential difference that could induce atomic rearrangements. But, the presence of a strong potential barrier that originates from the crystalline order itself lets us conclude that this displacement is improbable at low temperatures.
An additional concern when using US to determine an energy barrier is to check the integrity of the crystalline structure. In this case, we employed radial distribution functions to check for possible changes in the structure of the nanoparticle during the displacement of the moving oxygen atom in the core, as we see in Fig. 9c. Because it is a periodic structure, the g(r)s show that there is not much difference between the starting position and the ending position. In Fig. 9c, we notice for the O–Ce g(r) that the start and end positions (ξ = 0.000 and 0.233) have 3 peaks at almost equal distances. During the trajectory there is an almost perfect symmetry in the first peaks. For the O–O g(r), we notice a symmetry in the first 2 peaks, with these maxima occurring in the initial and final positions. This result shows that the integrity of the crystalline structure remains cohesive during the umbrella sampling simulations.
3.7 Electrostatic potential
We analysed the map of the electrostatic potential in the nanoparticles in relation to the M/Ce4+ molar ratio (M = Ce3+, Gd3+, La3+, Zr4+) using the electrostatic potential in the range from −0.52 to 2.08, Fig. 10. The red regions in the nanoparticle structures represent low electrostatic potential regions, e.g., large concentrations of negative charges in the structure, while the blue-colored atoms indicate the most positive regions.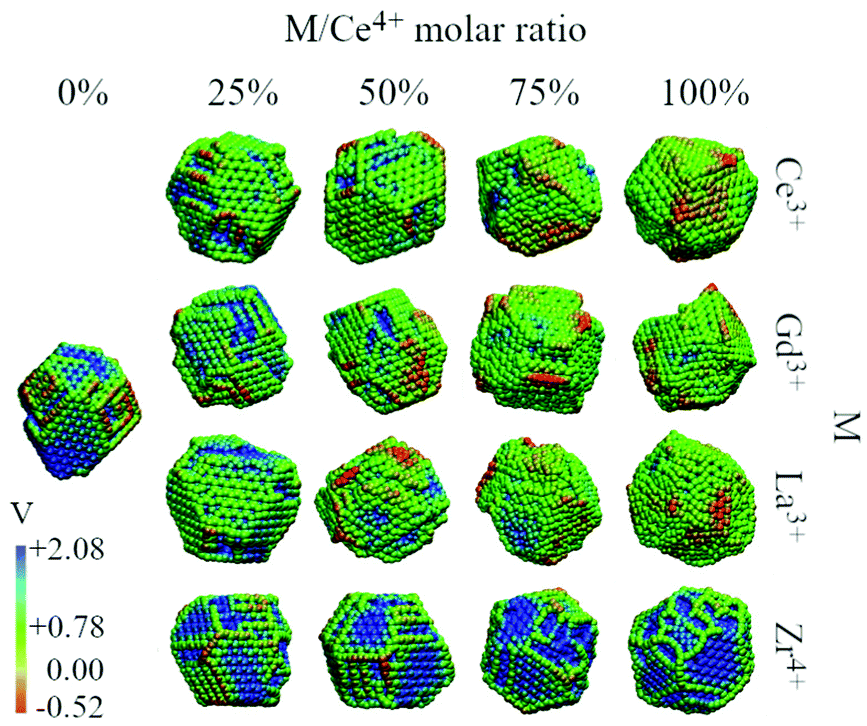 | ||
| Fig. 10 Electrostatic potential map obtained with the particle-mesh Ewald method analysis for all nanoparticle structures at 0 K in relation to the M/Ce4+ ratio. | ||
Migani and coworkers investigated the vacancy formation energy in small (CeO2)n nanoclusters where n = 21, 30, 40 and 80 using DFT calculations. They found that the energy formation of an O vacancy is related to the electrostatic potential of the material, and then the reactivity can be rationalized using the electrostatic potential, in particular, at the surface region.66 Along this line, Sayle and coworkers have employed the map of the electrostatic potential as a descriptor to identify reactivity “fingerprints” on Ce3+/Ce4+ nanoparticles obtained by MD simulations. They found that the Ce3+/Ce4+ ratio and morphology play crucial roles in the oxygen vacancy formation energy and consequently in the oxygen storage capability and reactivity of the material.13,67
The concentration and predominance of blue or red regions on the nanoparticle surface, Fig. 10, is related not only to the point charge of each atom, q, but also to the van der Waals radius, r. As mentioned before, both parameters, q and r, are required to calculate the reciprocal sum of the PME and the charge q is distributed on the surface of the sphere with radius r. Thus, atoms with small radius contribute with higher charge density and larger homogeneous regions. We would like to highlight that the electrostatic potential in Fig. 10 is the contribution of all atoms in the nanoparticle and not only the surface atoms.
The presence of M3+ cations in the nanoparticles decreases the electrostatic potential, which is related to the larger populations of M3+ cations in the surface and agrees with the greater reactivity of Ce3+/Ce4+, e.g., lower O2− vacancy energy and higher oxygen storage capacity, in relation to the neat Ce4+ particles.13,67 Beyond the influence of the M3+ cations, we also see a larger occurrence of negative regions in the edges and defects of the nanoparticles, which can be related to the lower bound of the oxygen in these regions.66
On the other hand, the CeO2–ZrO2 nanoparticles present the largest and homogeneous blue regions on the surface, e.g., positive regions, and it can be understood by relating the Zr4+ high charge q = +4 with the small zirconium ionic radius, e.g., r = 1.75 Å. Moreover, as the Zr4+/Ce4+ molar ratio increases, the blue regions get more dominant over the negative potential, which is also the consequence of the high density of the positive charge generated by Zr4+ in comparison with q = +4 and r = 2.04 Å of the Ce4+ cation. Hence, the MEP in Fig. 10 indicates that the M3+/Ce4+ nanoparticles may present interesting activity in reactions involving C–H bond activation in hydrocarbons, a key process in conversion of CH species to CO species.68
On the other hand, the M4+/Ce4+ nanoparticles may be promising materials for conversion of O2-species to molecular O2. This can in principle be done by adsorbing ions on the particle surface (in the positive potential region) leading to oxidation, as in O2− → O0 + 2e−. As an example, this is an already explored application of CeO2 in the context of water splitting.69,70 Thus, with the classical point of view of the electrostatic potential, by combining red and blue regions nearby, a nanoparticle could be for instance an interesting candidate as a catalyst for oxi-reduction reactions.68,71,72
4 Insights in the role of temperature and composition in mixed CeO2-based nanoalloys
Within this section, we discuss the general remarks and the knowledge that arises from our results. First of all, the shapes of the particles are unchanged by temperature effects below the phase transition point, and only change by the effect of the particle composition. The truncated octahedron shape seen in the pure ceria is inherited by the mixtures, even with the small 25% CeO2 concentration. In the particular case of the Ce2O3 and La2O3 systems, the final particles have a less regular morphology that follows the more irregular (locally trigonal) crystal arrangement seen in this work.In mixed particles, the presence of Ce4+ and the lower melting point of CeO2 lead to the nucleation and growth of a crystal that follows the cubic fluorite structure of pure ceria, with vacancies appearing both by temperature effects and the presence of 3+ species. The pure systems present locally the same morphology expected from the bulk configurations, but for Ce2O3 and La2O3 the balance between bulk and surface stress favored a less globally ordered structure with irregular faceting. For pure La2O3, this can be associated with the weaker bond energy expected from lanthanum to oxygen due to its small electronegativity, which is the smallest among all the metals studied here (1.10 on the Pauling scale). Ce has a similar electronegativity (1.12 on the Pauling scale), which also results in the weakening of the Ce3+–O2− bond in comparison to Ce4+–O2−.
Even without having an impact on the particle shape, the temperature effects below the phase transition have a strong connection with the oxygen mobility and distribution. From the evolution of the number of vacancies on the particles, we have shown that different oxides show different resistance for oxygen mobility, in which CeO2 presents the largest mobility and ZrO2 the smallest. The intermediate mobility seems to be similar in all the three 3+ cations studied here, and more detailed experiments are necessary to evaluate their exact relation. When combined with the relative concentration distribution of the cations on the nanoparticle, we can conclude that the CeO2–ZrO2 mixture will behave more linearly with respect to mobility, since the cations are more homogeneously distributed in the particle. The other mixtures will display a more nonlinear behavior since the surface is richer in 3+ cations in relation to the bulk.
This last point connects directly with our observations on the excess energy of those systems. The high excess energy shown in the ZrO2 mixtures indicates that, if the systems were annealed at a slower rate, the cations could segregate even more. In complete opposition, we observed a small segregation of the 3+ cations towards the surface, even with negative excess energy. This is expected, since the 3+ cations do not need the same coordination as the 4+ ones to minimize the system energy. This surface preference for 3+ cations can be useful since it creates the possibility of a high dopant concentration in the chemically active surface using a small M3+/Ce4+ molar ratio.
The Ce4+ abundance in the bulk of CeO2–M2O3 systems is an explanation for why those mixtures can maintain the fluorite crystal structure even at a lower relative Ce4+ concentration. The other explanation is that CeO2 has a higher phase transition temperature in comparison to the other oxides and can nucleate first in the simulations. The surface of the final CeO2 nanoparticle has an interesting mixture of positive and negative electrostatic potential, in which the (111) surface is more positive and the (100) more negative. As the mixtures tend to maintain the geometry of the CeO2 particle, we observe that the addition of 3+ cations lowers the potential on the (111) face, i.e., makes the surface in general less positive.
The addition of ZrO2 up to 50% changes the surface only slightly, but higher concentrations generate a particle that has a completely positive surface. This result agrees qualitatively with the observations from Pengpanich et al., in which they observed that the addition of Zr4+ up to 25% leads to an “optimal” methane conversion performance for the Ce1−xZrxO2 nanoparticle, while a higher concentration leads to the decay of the catalytic performance.73
The positive profile of the surface in Ce4+/Zr4+ is strongly associated with the oxygen mobility we observed in this work using the umbrella sampling technique. We observed that to move the O2− anions from the first layer of the particles to the surface is more favorable than moving in the opposite direction. On the other hand, the combination of these results points to a general path of conduction that is only reliable for neutral particles. If the systems are unbalanced in charge, more complex behaviors can appear.
5 Conclusion
We employed classical molecular dynamics simulations and the process of amorphization and recrystallization to investigate the structural formation of mixed CeO2-based nanoparticles with different concentrations of Ce2O3, Gd2O3, La2O3, and ZrO2. The studied systems covered two different nanoparticle sizes and 5 compositions for each CeO2–MOx system. Our results regarding the nanoparticle morphology revealed that the process of annealing makes the CeO2 morphology overcome the other oxide ones, which gives to the mixture the fluorite crystal structure in a truncated octahedron-like particle. The CeO2 concentration is also detrimental to the phase transition in those systems, both in the temperature and in the fluctuation of extensive variables such as density and potential energy. For these three properties, the relation with concentration is closely approximated by a linear combination of isolated species. CeO2–ZrO2 is the only solid solution found to have positive excess energy and more abrupt fluctuations in the phase transition temperature as a function of the concentration, which is the opposite of the DFT results obtained for small CeO2–ZrO2 clusters.25Our findings showed that the nanoparticles have a good combination of positive and negative electrostatic potential regions on the surface, with a good modulation of this value with the 3+ or 4+ species. Also, oxygen mobility and vacancies were investigated, revealing the strong potential barriers that exist for oxygen transport in those solids. CeO2 crystals eliminate most of the vacancies in the annealing process, but the 3+ mixtures retain the vacancies even at low temperature. The sites near the surface are the more energetic ones, but vacancies in the bulk generate stronger energy fluctuations by virtue of atomic rearrangement. These characteristics observed and explained here are signs that particles in this size range may present catalytic properties such as observed in experiments and can be used as more realistic models for computational simulation than few atoms clusters. Therefore, we expect these results to motivate future research on the direct observation of oxi-reduction reactions over those nanoparticles.
Author contributions
João Paulo A. de Mendonça – methodology, software, formal analysis, investigation, data curation, writing – original draft, visualization. Tuanan C. Lourenço – methodology, software, validation, formal analysis, investigation, writing – review & editing. Luis Paulo M. Freitas – formal analysis, writing – review & editing. Anderson A. E. Santo – formal analysis. Gustavo T. Feliciano – formal analysis, writing – review & editing, supervision. Juarez L. F. Da Silva – conceptualization, methodology, resources, data curation, writing – review & editing, visualization, supervision, project administration, funding acquisition.Conflicts of interest
There are no conflicts to declare.Acknowledgements
The authors gratefully acknowledge support from FAPESP (São Paulo Research Foundation, Grant Numbers 2017/11631-2, 2018/21401-7 and 2019/23681-0), Shell and the strategic importance of the support given by ANP (Brazils National Oil, Natural Gas and Biofuels Agency) through the R&D levy regulation and also to the University of São Paulo for providing the computational resources for the project execution. The authors acknowledge also the Laboratory of Advanced Scientific Computing (University of São Paulo) and the Department of Information Technology – Campus São Carlos, for hosting our cluster. The authors acknowledge also the National Laboratory for Scientific Computing (LNCC/MCTI, Brazil) for providing HPC resources of the SDumont supercomputer, which have contributed to the research results reported within this paper. URL: http://sdumont.lncc.br.References
- R. Schmitt, A. Nenning, O. Kraynis, R. Korobko, A. I. Frenkel, I. Lubomirsky, S. M. Haile and J. L. M. Rupp, A review of defect structure and chemistry in ceria and its solid solutions, Chem. Soc. Rev., 2020, 49, 554–592, 10.1039/C9CS00588A
.
- Y. Shan, Y. Liu, Y. Li and W. Yang, A review on application of cerium-based oxides in gaseous pollutant purification, Sep. Purif. Technol., 2020, 250, 117181, DOI:10.1016/j.seppur.2020.117181
- P. Li, X. Chen, Y. Li and J. W. Schwank, A Review on Oxygen Storage Capacity of CeO2-Based Materials: Influence Factors, Measurement Techniques, and Applications in Reactions Related to Catalytic Automotive Emissions Control, Catal. Today, 2019, 327, 90–115, DOI:10.1016/j.cattod.2018.05.059
- A. Vita, Catalytic Applications of CeO2-Based Materials, Catalysts, 2020, 10, 576, DOI:10.3390/catal10050576
- P. Bellio, C. Luzi, A. Mancini, S. Cracchiolo, M. Passacantando, L. Di Pietro, M. Perilli, G. Amicosante, S. Santucci and G. Celenza, Cerium oxide nanoparticles as potential antibiotic adjuvant. Effects of CeO2 nanoparticles on bacterial outer membrane permeability, Biochim. Biophys. Acta, Biomembr., 2018, 1860, 2428–2435, DOI:10.1016/j.bbamem.2018.07.002
- S. Rajeshkumar and P. Naik, Synthesis and biomedical applications of Cerium oxide nanoparticles - A Review, Biotechnol. Rep., 2018, 17, 1–5, DOI:10.1016/j.btre.2017.11.008
- G. Lu, H. Zheng, J. Lv, G. Wang and X. Huang, Review of recent research work on CeO2-based electrocatalysts in liquid-phase electrolytes, J. Power Sources, 2020, 480, 229091, DOI:10.1016/j.jpowsour.2020.229091
- J. L. F. Da Silva, M. V. Ganduglia-Pirovano, J. Sauer, V. Bayer and G. Kresse, Hybrid Functionals Applied to Rare-Earth Oxides: The Example of Ceria, Phys. Rev. B: Condens. Matter Mater. Phys., 2007, 75, 045121, DOI:10.1103/physrevb.75.045121
- M. V. Ganduglia-Pirovano, J. L. F. Da Silva and J. Sauer, Density-Functional Calculations of the Structure of Near-Surface Oxygen Vacancies and Electron Localization on CeO2(111), Phys. Rev. Lett., 2009, 102, 026101, DOI:10.1103/physrevlett.102.026101
- V. Goldschmidt and L. Thomassen, Crystal structure of natural and synthetic oxides of U, Th and Ce. Skrifter utgitt av det Norske Videnskaps-Akademi i Oslo 1: Matematisk-Naturvidenskapelig Klasse, 1923, 1923, 1–48.
- H. Whitfield, D. Roman and A. Palmer, X-ray study of the system ThO2-CeO2-Ce2O3, J. Inorg. Nucl. Chem., 1966, 28, 2817–2825 CrossRef CAS
- D. R. Mullins, The Surface Chemistry of Cerium Oxide, Surf. Sci. Rep., 2015, 70, 42–85, DOI:10.1016/j.surfrep.2014.12.001
- T. X. Sayle, M. Molinari, S. Das, U. M. Bhatta, G. Möbus, S. C. Parker, S. Seal and D. C. Sayle, Environment-mediated structure, surface redox activity and reactivity of ceria nanoparticles, Nanoscale, 2013, 5, 6063–6073, 10.1039/c3nr00917c
- P. Li, Y. Zhou, Z. Zhao, Q. Xu, X. Wang, M. Xiao and Z. Zou, Hexahedron Prism-Anchored Octahedronal CeO2: Crystal Facet-Based Homojunction Promoting Efficient Solar Fuel Synthesis, J. Am. Chem. Soc., 2015, 137, 9547–9550, DOI:10.1021/jacs.5b05926
- S. Yasmeen, M. R. Khan, K. Park, Y. Cho, J. W. Choi, H.-S. Moon and H.-B.-R. Lee, Preparation of a Hydrophobic Cerium Oxide Nanoparticle Coating with Polymer Binder via a Facile solution route, Ceram. Int., 2020, 46, 12209–12215, DOI:10.1016/j.ceramint.2020.01.268
- J. C. Hamilton, Edge Energies: Atomistic Calculations of a Continuum Quantity, Phys. Rev. B: Condens. Matter Mater. Phys., 2006, 73, 125447, DOI:10.1103/PhysRevB.73.125447
- S. F. Li, X. J. Zhao, X. S. Xu, Y. F. Gao and Z. Zhang, Stacking Principle and Magic Sizes of Transition Metal Nanoclusters Based on Generalized Wulff Construction, Phys. Rev. Lett., 2013, 111, 115501, DOI:10.1103/physrevlett.111.115501
- X. J. Zhao, X. L. Xue, Z. X. Guo and S. F. Li, Relative Edge Energy in the Stability of Transition Metal Nanoclusters of Different Motifs, Nanoscale, 2016, 8, 12834–12842, 10.1039/C6NR00486E
- J. P. A. de Mendonça, M. G. Monteiro, S. de Andrade Leonel and F. Sato, Modeling Surface Energy in Porous metallic Nanostructures, Eur. Phys. J. B, 2018, 91, 1–12, DOI:10.1140/epjb/e2018-80655-2
- R. W. Tarnuzzer, J. Colon, S. Patil and S. Seal, Vacancy Engineered Ceria Nanostructures for Protection from Radiation-Induced Cellular Damage, Nano Lett., 2005, 5, 2573–2577, DOI:10.1021/nl052024f
- H. Yahiro, Y. Eguchi, K. Eguchi and H. Arai, Oxygen Ion Conductivity of the Ceria-Samarium Oxide System with Fluorite Structure, J. Appl. Electrochem., 1988, 18, 527–531, DOI:10.1007/BF01022246
- J. J. Plata, A. M. Márquez and J. F. Sanz, Understanding the Interplay of Dopants, Interfaces, and Anionic Conductivity in Doped Ceria/Zirconia Heteroepitaxial Structures, Chem. Mater., 2014, 26, 3385–3390, DOI:10.1021/cm500415h
- T. Montini, M. Melchionna, M. Monai and P. Fornasiero, Fundamentals and Catalytic Applications of CeO2-Based Materials, Chem. Rev., 2016, 116, 5987–6041, DOI:10.1021/acs.chemrev.5b00603
- J. Mucelini, R. Costa-Amaral, Y. Seminovski and J. L. F. Da Silva, Ab initio investigation of the formation of ZrO2-like structures upon the adsorption of Zrn on the CeO2(111) surface, J. Chem. Phys., 2018, 149, 244702, DOI:10.1063/1.5063732
- P. Felício-Sousa, J. Mucelini, L. Zibordi-Besse, K. F. Andriani, Y. Seminovski, R. C. Prati and J. L. F. Da Silva,
Ab initio Insights Into the Structural, Energetic, Electronic, and Stability Properties of Mixed CenZr15−nO30 Nanoclusters, Phys. Chem. Chem. Phys., 2019, 21, 26637–26646, 10.1039/c9cp04762j
- K. Jiang, S. Liu and X. Wang, Low-Thermal-Conductivity and High-Toughness CeO2-Gd2O3 Co-Stabilized Zirconia Ceramic for Potential Thermal Barrier Coating Applications, J. Eur. Ceram. Soc., 2018, 38, 3986–3993, DOI:10.1016/j.jeurceramsoc.2018.04.065
- Z. Tianshu, Ionic Conductivity in the CeO2–Gd2O3 System (0.05 ≤ Gd/Ce ≤ 0.4) Prepared by Oxalate Coprecipitation, Solid State Ionics, 2002, 148, 567–573, DOI:10.1016/s0167-2738(02)00121-2
- V. P. Kumar, Y. Reddy, P. Kistaiah, G. Prasad and C. V. Reddy, Thermal and Electrical Properties of Rare-Earth Co-Doped Ceria Ceramics, Mater. Chem. Phys., 2008, 112, 711–718, DOI:10.1016/j.matchemphys.2008.06.030
- E. Andrievskaya, O. Kornienko, A. Sameljuk and A. Sayir, Phase Relation Studies in the CeO2-La2O3 System at 1100-1500 °C, J. Eur. Ceram. Soc., 2011, 31, 1277–1283, DOI:10.1016/j.jeurceramsoc.2010.05.024
- P. A. Žguns, A. V. Ruban and N. V. Skorodumova, Phase Diagram and Oxygen–Vacancy Ordering in the CeO2–Gd2O3 System: a Theoretical Study, Phys. Chem. Chem. Phys., 2018, 20, 11805–11818, 10.1039/c8cp01029c
- G. Balducci, J. Kašpar, P. Fornasiero, M. Graziani and M. S. Islam, Surface and Reduction Energetics of the CeO2-ZrO2 Catalysts, J. Phys. Chem. B, 1998, 102, 557–561, DOI:10.1021/jp972400n
- N. N. Bulgakov, V. Sadykov, V. V. Lunin and E. Kemnitz, React. Kinet. Catal. Lett., 2002, 76, 103–110, DOI:10.1023/a:1015621613212
- I. Z. Koleva, H. A. Aleksandrov, K. M. Neyman and G. N. Vayssilov, Preferential Location of Zirconium Dopants in Cerium Dioxide Nanoparticles and the Effects of Doping on Their Reducibility:
A DFT Study, Phys. Chem. Chem. Phys., 2020, 22, 26568–26582, 10.1039/D0CP05456A
- K. Reed, A. Cormack, A. Kulkarni, M. Mayton, D. Sayle, F. Klaessig and B. Stadler, Exploring the properties and applications of nanoceria: Is there still plenty of room at the bottom?, Environ. Sci.: Nano, 2014, 1, 390–405, 10.1039/c4en00079j
- T. X. T. Sayle, S. C. Parker and D. C. Sayle, Shape of CeO2 nanoparticles using simulated amorphisation and recrystallisation, Chem. Commun., 2004, 2438–2439, 10.1039/b408752f
- T. X. Sayle, F. Caddeo, X. Zhang, T. Sakthivel, S. Das, S. Seal, S. Ptasinska and D. C. Sayle, Structure-Activity Map of Ceria Nanoparticles, Nanocubes, and Mesoporous Architectures, Chem. Mater., 2016, 28, 7287–7295, DOI:10.1021/acs.chemmater.6b02536
- A. Jeyaranjan, T. S. Sakthivel, M. Molinari, D. C. Sayle and S. Seal, Morphology and Crystal Planes Effects on Supercapacitance of CeO2 Nanostructures: Electrochemical and Molecular Dynamics Studies, Part. Part. Syst. Charact., 2018, 35, 1–9, DOI:10.1002/ppsc.201800176
- T. X. T. Sayle, P. E. Ngoepe and D. C. Sayle, Generating structural distributions of atomistic models of Li2O nanoparticles using simulated crystallisation, J. Mater. Chem., 2010, 20, 10452, 10.1039/c0jm01580f
- R. S. Ledwaba, D. C. Sayle and P. E. Ngoepe, Atomistic Simulation and Characterization of Spinel Li1+xMn2O4 (0 ≤ x ≤ 1) Nanoparticles, ACS Appl. Energy Mater., 2020, 3, 1429–1438, DOI:10.1021/acsaem.9b01870
- A. H. Tamboli, A. A. Chaugule, S. W. Gosavi and H. Kim, CexZr1-xO2 Solid Solutions for Catalytic Synthesis of Dimethyl Carbonate from CO2: Reaction Mechanism and the Effect of Catalyst Morphology on Catalytic Activity, Fuel, 2018, 216, 245–254, DOI:10.1016/j.fuel.2017.12.008
- Y. Shu, J. Bao, S. Yang, X. Duan and P. Zhang, Entropy-Stabilized Metal-CeOx Solid Solutions for Catalytic Combustion of Volatile Organic Compounds, AIChE J., 2020, 67, 1–13, DOI:10.1002/aic.17046
- B.-H. Kim, J. Kullgren, M. J. Wolf, K. Hermansson and P. Broqvist, Multiscale Modeling of Agglomerated Ceria Nanoparticles: Interface Stability and Oxygen Vacancy Formation, Front. Chem., 2019, 7, 203, DOI:10.3389/fchem.2019.00203
- R. Álvarez Asencio, R. W. Corkery and A. Ahniyaz, Solventless Synthesis of Cerium Oxide Nanoparticles and Their Application in UV Protective Clear Coatings, RSC Adv., 2020, 10, 14818–14825, 10.1039/D0RA01710H
- S. Carvajal, M. Perramón, G. Casals, D. Oró, J. Ribera, M. Morales-Ruiz, E. Casals, P. Casado, P. Melgar-Lesmes, G. Fernández-Varo, P. Cutillas, V. Puntes and W. Jiménez, Cerium Oxide Nanoparticles Protect against Oxidant Injury and Interfere with Oxidative Mediated Kinase Signaling in Human-Derived Hepatocytes, Int. J. Mol. Sci., 2019, 20, DOI:10.3390/ijms20235959
- L. Minervini, M. O. Zacate and R. W. Grimes, Defect cluster formation in M2O3-doped CeO2, Solid State Ionics, 1999, 116, 339–349, DOI:10.1016/S0167-2738(98)00359-2
- R. A. Buckingham, The Classical Equation of State of Gaseous Helium, Neon and Argon, Proc. R. Soc. A, 1938, 168, 264–283 CAS
- H. Hojo, T. Mizoguchi, H. Ohta, S. D. Findlay, N. Shibata, T. Yamamoto and Y. Ikuhara, Atomic Structure of a CeO2 Grain Boundary: The Role of Oxygen Vacancies, Nano Lett., 2010, 10, 4668–4672, DOI:10.1021/nl1029336
- G. Balducci, M. S. Islam, J. Kašpar, P. Fornasiero and M. Graziani, Reduction Process in CeO2-MO and CeO2-M2O3 Mixed Oxides: A Computer Simulation Study, Chem. Mater., 2003, 15, 3781–3785 CrossRef
- T. X. Sayle, S. C. Parker and C. R. Catlow, The role of oxygen vacancies on ceria surfaces in the oxidation of carbon monoxide, Surf. Sci., 1994, 316, 329–336, DOI:10.1016/0039-6028(94)91225-4
- S. Plimpton, Fast Parallel Algorithms for Short-Range Molecular Dynamics, J. Comput. Phys., 1995, 117, 1–19, DOI:10.1006/jcph.1995.1039
- A. Stukowski, Visualization and Analysis of Atomistic Simulation Data With OVITO–the Open Visualization Tool, Modell. Simul. Mater. Sci. Eng., 2019, 18, 015012, DOI:10.1088/0965-0393/18/1/015012
- S. P. Coleman, D. E. Spearot and L. Capolungo, Virtual diffraction analysis of Ni [010] symmetric tilt grain boundaries, Modell. Simul. Mater. Sci. Eng., 2013, 21, 055020, DOI:10.1088/0965-0393/21/5/055020
- G. Patey and J. Valleau, The Free Energy of Spheres with Dipoles: Monte Carlo with Multistage Sampling, Chem. Phys. Lett., 1973, 21, 297–300, DOI:10.1016/0009-2614(73)80139-3
- G. Torrie and J. Valleau, Nonphysical Sampling Distributions in Monte Carlo Free-Energy Estimation: Umbrella Sampling, J. Comput. Phys., 1977, 23, 187–199, DOI:10.1016/0021-9991(77)90121-8
-
A. Blackman and L. R. Gahan, Aylward and Findlay's SI chemical data, John Wiley & Sons, 2014 Search PubMed
- M. J. Abraham, T. Murtola, R. Schulz, S. Páll, J. C. Smith, B. Hess and E. Lindahl, GROMACS: High Performance Molecular Simulations Through Multi-Level Parallelism from Laptops to Supercomputers, SoftwareX, 2015, 1–2, 19–25, DOI:10.1016/j.softx.2015.06.001
- J. S. Hub, B. L. de Groot and D. van der Spoel, g_wham—A Free Weighted Histogram Analysis Implementation Including Robust Error and Autocorrelation Estimates, J. Chem. Theory Comput., 2010, 6, 3713–3720, DOI:10.1021/ct100494z
- J. Koettgen, S. Grieshammer, P. Hein, B. O. H. Grope, M. Nakayama and M. Martin, Understanding the Ionic Conductivity Maximum in Doped Ceria: Trapping and Blocking, Phys. Chem. Chem. Phys., 2018, 20, 14291–14321, 10.1039/c7cp08535d
- A. Aksimentiev and K. Schulten, Imaging alpha-Hemolysin with Molecular Dynamics: Ionic Conductance, Osmotic Permeability, and the Electrostatic Potential Map, Biophys. J., 2005, 88, 3745–3761, DOI:10.1529/biophysj.104.058727
- W. Humphrey, A. Dalke and K. Schulten, VMD: Visual molecular dynamics, J. Mol. Graphics, 1996, 14, 33–38, DOI:10.1016/0263-7855(96)00018-5
- M. Baalousha, P. L. Coustumer, I. Jones and J. R. Lead, Characterisation of structural and surface speciation of representative commercially available cerium oxide nanoparticles, Environ. Chem., 2010, 7, 377, DOI:10.1071/en10003
- S. Takami, S. Ohara, T. Adschiri, Y. Wakayama and T. Chikyow, Continuous Synthesis of Organic–Inorganic Hybridized Cubic Nanoassemblies of Octahedral Cerium Oxide Nanocrystals and Hexanedioic Acid, Dalton Trans., 2008, 5442, 10.1039/b801099d
- Y. Jiang, J. B. Adams and M. van Schilfgaarde, Density-Functional Calculation of CeO2 Surfaces and Prediction of Effects of Oxygen Partial Pressure and Temperature on Stabilities, J. Chem. Phys., 2005, 123, 064701 CrossRef PubMed
- U. Castanet, C. Feral-Martin, A. Demourgues, R. L. Neale, D. C. Sayle, F. Caddeo, J. M. Flitcroft, R. Caygill, B. J. Pointon, M. Molinari and J. Majimel, Controlling the {111}/{110} Surface Ratio of Cuboidal Ceria Nanoparticles, ACS Appl. Mater. Interfaces, 2019, 11, 11384–11390, DOI:10.1021/acsami.8b21667
- M. Scavini, M. Coduri, M. Allieta, M. Brunelli and C. Ferrero, Probing Complex Disorder in Ce1-xGd_xO_2-x/2 Using the Pair Distribution Function Analysis, Chem. Mater., 2012, 24, 1338–1345, DOI:10.1021/cm203819u
- A. Migani, G. N. Vayssilov, S. T. Bromley, F. Illas and K. M. Neyman, Dramatic Reduction of the Oxygen Vacancy Formation Energy in Ceria Particles: A Possible Key to their Remarkable Reactivity at the Nanoscale, J. Mater. Chem., 2010, 20, 10535–10546, 10.1039/c0jm01908a
- T. X. T. Sayle, M. Cantoni, U. M. Bhatta, S. C. Parker, S. R. Hall, G. Möbus, M. Molinari, D. Reid, S. Seal and D. C. Sayle, Strain and architecture-tuned reactivity in ceria nanostructures; Enhanced catalytic oxidation of CO to CO2, Chem. Mater., 2012, 24, 1811–1821, DOI:10.1021/cm3003436
- M. M. Nair and S. Abanades, Solid-State Redox Kinetics of CeO2 in Two-Step Solar CH4 Partial Oxidation and Thermochemical CO2 Conversion, Catalysts, 2021, 11, 723 CrossRef CAS
- J. R. Scheffe and A. Steinfeld, Thermodynamic Analysis of Cerium-Based Oxides for Solar Thermochemical Fuel Production, Energy Fuels, 2012, 26, 1928–1936, DOI:10.1021/ef201875v
- R. R. Bhosale, G. Takalkar, P. Sutar, A. Kumar, F. AlMomani and M. Khraisheh, A decade of ceria based solar thermochemical H2O/CO2 splitting cycle, Int. J. Hydrogen Energy, 2019, 44, 34–60, DOI:10.1016/j.ijhydene.2018.04.080
- M. Capdevila-Cortada, M. García-Melchor and N. López, Unraveling the Structure Sensitivity in Methanol Conversion on CeO2: A DFT+U Study, J. Catal., 2015, 327, 58–64, DOI:10.1016/j.jcat.2015.04.016
- G. Righi, R. Magri and A. Selloni, Methane Activation on Metal-Doped (111) and (100) Ceria Surfaces with Charge-Compensating Oxygen Vacancies, J. Phys. Chem. C, 2020, 124, 17578–17585, DOI:10.1021/acs.jpcc.0c03320
- S. Pengpanich, V. Meeyoo, T. Rirksomboon and K. Bunyakiat, Catalytic oxidation of methane over CeO2-ZrO2 mixed oxide solid solution catalysts prepared via urea hydrolysis, Appl. Catal., A, 2002, 234, 221–233, DOI:10.1016/s0926-860x(02)00230-2
Footnote |
| † Electronic supplementary information (ESI) available: We included several additional details, namely, generation of the initial mixed oxide structures, the amorphization protocol, recrystallization tests, relaxation at zero temperature, etc. Furthermore, all the results obtained for the smallest particles (500 cations) are also reported. See DOI: 10.1039/d1ma00543j |
| This journal is © The Royal Society of Chemistry 2021 |