 Open Access Article
Slowness curve surface acoustic wave transducers for optimized acoustic streaming†
Richard O'Rorke a,
Andreas Winkler
 b,
David Collins
 c and
Ye Ai
 *a
*a
aPillar of Engineering Product Development, Singapore University of Technology and Design, Singapore. E-mail: aiye@sutd.edu.sg
bLeibniz Institute for Solid State and Materials Research (IFW), Dresden, Germany
cDepartment of Biomedical Engineering, University of Melbourne, Parkville, Victoria, Australia
First published on 20th March 2020
Abstract
Surface acoustic waves can induce force gradients on the length scales of micro- and nanoparticles, allowing precise manipulation for particle capture, alignment and sorting activities. These waves typically occupy a spatial region much larger than a single particle, resulting in batch manipulation. Circular arc transducers can focus a SAW into a narrow beam on the order of the particle diameter for highly localised, single-particle manipulation by exciting wavelets which propagate to a common focal point. The anisotropic nature of SAW substrates, however, elongates and shifts the focal region. Acousto-microfluidic applications are highly dependent on the morphology of the underlying substrate displacement and, thus, become dependent on the microchannel position relative to the circular arc transducer. This requires either direct measurement or computational modelling of the SAW displacement field. We show that the directly measured elongation and shift in the focal region are recapitulated by an analytical model of beam steering, derived from a simulated slowness curve for 128° Y-cut lithium niobate. We show how the negative effects of beam steering can be negated by adjusting the curvature of arced transducers according to the slowness curve of the substrate, for which we present a simple function for convenient implementation in computational design software. Slowness-curve adjusted transducers do not require direct measurement of the SAW displacement field for microchannel placement and can capture smaller particles within the streaming vortices than can circular arc IDTs.
1. Introduction
Surface acoustic waves (SAWs) are widely used for non-contact micromanipulation of particles in microfluidic systems as they can generate force gradients on length scales similar to the particles.1–10 When placed beneath a microfluidic channel, the displacement of a SAW generates a pressure wave in the liquid. The attenuation of this pressure wave in the liquid causes acoustic streaming that can act on suspended particles via a drag force, as well as acoustic radiation forces (ARFs) which direct suspended particles along time-averaged pressure gradients.8 Recently, these two effects have been used in synergy to trap suspended particles (with diameter smaller than the acoustic wavelength) near the stagnation points inside acoustic streaming vortices.11–16 Similarly, particles can be translated to specific streamlines in a continuous flow microchannel according to their size.13 The pressure gradient at the beam edge generates an ARF that drives suspended particles away from the beam axis and across flow streamlines towards the vortex centres. As the streaming flow recirculates suspended particles past these vortices, the concentration of trapped particles increases. A critical particle size below which the drag force dominates the ARF and particles cannot be captured has been reported previously:16
 | (1) |
 where w is the beam width. Ψ is a channel geometry dependent factor relating the second order streaming velocity, v2, to the first order fluid displacement velocity, v1:
 | (2) |
To capture smaller particles, one must generate a narrower acoustic beam. SAWs are typically generated by interdigitated transducers (IDTs), which resonate at a frequency f = v/λ, where v is the acoustic velocity in the substrate and λ is the acoustic wavelength, which corresponds to the pitch of the IDT. Focused SAWs are produced by IDTs with a curvature that directs wavelets to a common focal point. Circular arc IDTs have been used for particle focusing activities, but SAW substrates are anisotropic, meaning that the propagation directions of the excited wavelets are altered by beam steering.17 Ultimately, the steered wavelets converge to an elongated focal region that is displaced from the geometric centre of the IDT arc. The effects of beam steering can be negated by adjusting the IDT curvature according to the slowness curve of the substrate. Such slowness-curve-adjusted IDTs have been explored to produce a focused spot,18 nebulization,19 fluidic jetting20 and acoustic tweezing,21 but their use in microfluidic particle capture has not been explored. They offer a distinct advantage over circular arc IDTs by correcting the travel time for wavelets propagating from the electrode to the focal point so that wavelets interfere constructively at the geometric centre of the IDT. Circular IDTs, in contrast, require specialised tools to measure the substrate displacement and determine the focal point.12,22 The location of the focal point is critical in particle capture studies, since the acoustic beam width is narrowest at the focal point and this influences the balance of the drag force and ARF. The design of slowness-curve-adjusted IDTs requires knowledge of the slowness curve for the substrate material, which can be obtained laboriously from the stiffness matrix by solving the surface Green's function,18,23 finding Eigenvalues to the substrate Christoffel matrix24,25 or by numerical simulation.26
This work explores the use of slowness-curve-adjusted IDTs for particle capture in acoustic streaming vortices. IDTs are designed using a simulated slowness curve, to which we fit a convenient function to simplify IDT design in CAD software. The effects of IDT design parameters (number of finger pairs, focal length and angle subtended at the focal point) are discussed in relation to a numerical model of SAW propagation which has been validated using laser Doppler vibrometry measurements of real devices. A subset of IDT designs was selected for particle focusing studies to compare particle capture in streaming vortices generated by circular arc and slowness-curve-adjusted IDTs.
2. Experimental
2.1 Simulation of slowness curve
The phase velocity was determined for 128° Y-cut lithium niobate as a function of propagation direction (defined at an angle ϕ to the crystallographic X axis) via an Eigenfrequency study using COMSOL Multiphysics (v5.0). The simulation domain comprised one straight IDT finger pair measuring λ in the X and Y directions and 3λ in the Z direction. Periodic boundary conditions were applied to the XY and XZ faces. The phase velocity was defined as v(ϕ) = f(ϕ)λ, where ϕ is the Eigenfrequency for the propagation direction. The geometry was rotated by intervals ϕ = 10° about the Z axis to find the phase velocity for 0 < ϕ < 180°; symmetry about the crystallographic X direction was assumed to construct a slowness curve between 0 < ϕ < 360°. A mesh convergence study was conducted as described in ESI S2.†2.2 Design of focused IDTs
Circular arc IDTs are defined here by the curvature of the inner-most finger (which is equal to the geometric focal length, L0, and is an integer number of acoustic wavelengths, L0 = nλ0) and the angle, θ, subtended at the geometric focal point. Subsequent fingers are offset in the -X direction by where
where  v(ϕ = 0) is the phase velocity in the crystallographic X direction and f0 is the resonant frequency of the IDT. The aperture, a, of a circular arc IDT is given by
Slowness-curve adjusted IDTs are also defined by the curvature of the innermost finger however, the curvature is an integer number of acoustic wavelengths in all propagation directions, i.e. L0 = nλ(ϕ), where  illustrated in Fig. 1a. The curvature thus follows the slowness curve of the substrate. The slowness-curve adjusted IDT geometry was defined in SolidWorks (2015 x64) with L0 = 10λ(ϕ); λ(ϕ) was calculated from the simulated slowness curve for λ0 = 20 μm.
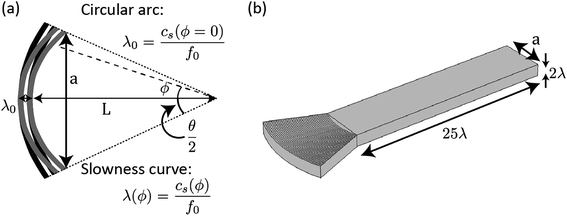 | ||
| Fig. 1 (a) Schematic of circular arc (black) and slowness-curve-adjusted (grey) IDT structures. (b) Illustration of FEM simulation domain. | ||
2.3 Simulation of SAW displacement fields
Out-of-plane surface displacements on 128° Y-cut lithium niobate were modelled using frequency-domain FEM analysis (COMSOL Multiphysics, v5.0). Both circular arc and slowness-curve-adjusted IDTs were investigated with a range of L0 and θ values (see Fig. 1a). The computational domain was reduced to an IDT region and a propagation region extending 25λ in the X direction and 2λ in Z. The top XY face is stress free and all other faces are treated as low-reflecting boundaries to reduce spurious reflections and approximate a semi-infinite substrate domain. IDT fingers are defined as alternating equipotential and ground planes. Wave attenuation and mechanical reflection at the electrodes is ignored, which is a suitable approximation for light-weight metals as Al on LiNbO3 used here. A free tetrahedral mesh was used, which converged for a maximum element size of λ/6 with a 1.96% error; a coarser mesh was required for IDTs with θ = 60° (maximum element size of λ/5, with an error of 5.39%) owing to computational limitations. Mesh convergence was evaluated using the method reported elsewhere;27 this is described in ESI† and a mesh convergence plot is provided in ESI Fig. S1.†Surface-normal displacement profiles were exported to code in MATLAB for analysis. The focal length (defined as the distance in X between the IDT and the point of minimum beam width), minimum beam width and peak displacement amplitude were evaluated for 0 < θ < 60° (where L0 = 10λ0), 2λ0 < L0 < 14λ0, (where θ = 60°) and λ0 = 20 μm.
2.4 SAW device fabrication
IDT structures were defined on 128° Y-cut lithium niobate wafers with 200 nm aluminium on top of a 10 nm chromium adhesion layer using conventional photolithography, metal sputtering and lift-off. Wafers were diced into 16 mm-square chips with a wafer saw (DAD 3240, DISCO, Japan) and mounted in a custom, 3D-printed chip holder containing custom printed circuit boards for electrical connections.2.5 LDV measurements
Acoustic wave field measurements, i.e. the determination of the surface-normal displacement amplitude and phase, were carried out in a laser Doppler vibrometer (UHF-120, Polytec GmbH, Germany) with temperature insulation and an autofocus system for up to 5115 measurement points. A multi-carrier (MC) signal in the frequency range of 182–192 MHz (slowness-curve IDTs) or 183–193 MHz (circular IDTs) was used with a frequency resolution of 250 kHz. Twenty-fold complex averaging for each point and 1.5 V forward voltage for the MC signal were applied. The data presented is not averaged, interpolated or otherwise modified.2.6 Acoustic streaming experiments
Microfluidic channels were formed by replica moulding of polydimethylsiloxane (PDMS) on a silicon wafer with channel features defined in SU-8 using optical lithography. A 10![[thin space (1/6-em)]](https://www.rsc.org/images/entities/char_2009.gif) :
:![[thin space (1/6-em)]](https://www.rsc.org/images/entities/char_2009.gif) 1 ratio of elastomer to curing agent was used and PDMS was bonded to the SAW device after exposing both bonding surfaces to air plasma for 1 minute, bringing into contact and heating for 10 minutes at 70 °C on a hotplate. A custom-made 6-axis alignment jig was used to precisely position the microchannels relative to the IDTs, using alignment markers on the microchannel and SAW device. The channel was perfused with an aqueous suspension of fluorescent microparticles (diameters 5.1, 2.1, 1 and 0.3 μm) and surfactant (0.5% w/w pluronic F127). The IDTs were excited at the resonant frequency of 185 MHz (determined as the S11 minima; see ESI Fig. S5†) with an applied power of 2 mW using a function generator and power amplifier. Videos and still images of particle motion in streaming vortices with no applied fluid flow were recorded via a fluorescence microscope and analysed using Image J.28
1 ratio of elastomer to curing agent was used and PDMS was bonded to the SAW device after exposing both bonding surfaces to air plasma for 1 minute, bringing into contact and heating for 10 minutes at 70 °C on a hotplate. A custom-made 6-axis alignment jig was used to precisely position the microchannels relative to the IDTs, using alignment markers on the microchannel and SAW device. The channel was perfused with an aqueous suspension of fluorescent microparticles (diameters 5.1, 2.1, 1 and 0.3 μm) and surfactant (0.5% w/w pluronic F127). The IDTs were excited at the resonant frequency of 185 MHz (determined as the S11 minima; see ESI Fig. S5†) with an applied power of 2 mW using a function generator and power amplifier. Videos and still images of particle motion in streaming vortices with no applied fluid flow were recorded via a fluorescence microscope and analysed using Image J.28
3. Results and discussion
3.1 Design and simulation of slowness-curve-adjusted IDTs
The simulated phase velocities for propagation directions 0 < ϕ < 90° along 128° Y-cut lithium niobate are plotted as data points in Fig. 2a. To facilitate analysis of beam steering, we fitted the following continuous fourth-order Fourier series to the discrete, simulated phase velocities:
 | (3) |
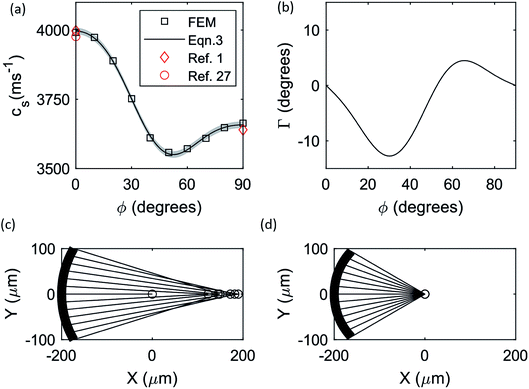 | ||
| Fig. 2 (a) Simulated phase velocity as a function of propagation direction, alongside eqn (3) and literature values.1 (b) Plot of beam steering angle (Eqn (4)), Γ, as a function of propagation direction. (c) and (d) illustration of power flow from (a) a circular arc IDT and (b) a slowness-curve-adjusted IDT (θ = 60°) showing the effect of beam steering in the former; circular markers indicate the individual focal points for each power flow vector. | ||
Eqn (3) is plotted alongside simulated values in Fig. 2a, with the 95% confidence interval shaded; fitted parameters are given in ESI Table S1,† which yielded goodness of fit r2 = 0.999. The simulated phase velocities are in excellent agreement with published values,1 which are also plotted for comparison.
Beam steering causes the power flow angle to deviate from the propagation direction by an angle Γ, defined as the angle between the propagation direction and the group velocity vector, which is the normal vector to (the tangent of) the slowness curve at the intersection with the propagation vector (see ESI Fig. S2†). This angle is zero for the propagation directions ϕ = 0°, ϕ = 52.8° and ϕ = 90°, and non-zero for intermediate angles. The beam steering angle, Γ, is a function of the wavevector,  and is given by:29
 | (4) |
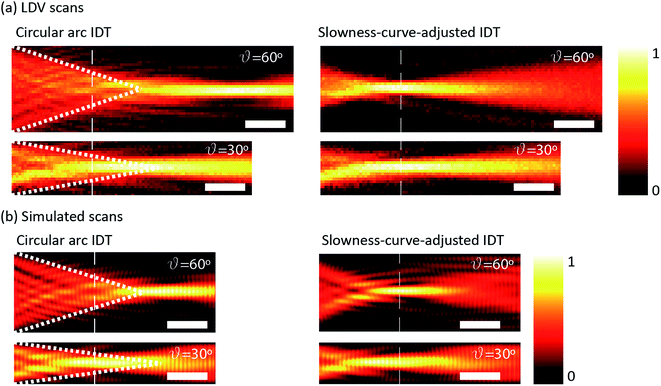
Eqn (4) was evaluated for f = 185 MHz using wavevectors obtained from eqn (3) and is plotted in Fig. 2b. These beam steering angles were used to plot power flow vectors emanating from circular arc and slowness-curve-adjusted IDTs (with θ = 60°, L0 = 10λ0 and λ0 = 20 μm) in Fig. 2c and d, respectively. The intersections of the power flow vectors with the crystallographic X axis are indicated by circular markers and the geometric focal point is located at x = 0. For circular arc IDTs, the focal length and focal region are both extended by beam steering. In contrast, the curvature of slowness-curve-adjusted IDTs negates beam steering and all power flow vectors converge at the geometric focal point. The simulated power flow vectors correspond precisely with the near-field regions in the measured displacement fields (normalised to a maximum value of one), which are given in Fig. 3a (the power flow vectors are plotted as dotted white lines). The focal length is clearly extended for circular arc IDTs, in contrast to slowness-curve-adjusted IDTs (the x-location of the geometric focal point is indicated by the vertical dashed white lines). Fig. 3b shows the simulated displacement fields (normalised to a maximum value of one) for circular arc and slowness-curve-adjusted IDTs, which accurately predict the extended near-field region of circular arc IDTs.
Previous work on slowness-curve-adjusted IDTs has approximated the curvature, R, of the innermost IDT finger to a function of the substrate anisotropy parameter, γ, and propagation direction, ϕ:29
 | (5) |
 | (6) |
It should be noted that eqn (5) assumes a constant γ however, the anisotropy parameter for 128° Y-cut lithium niobate varies significantly, as shown in Fig. 4a. Nonetheless, eqn (5) can provide a sufficient approximation to the slowness-curve-adjusted curvatures. By extracting the curvatures, R(ϕ), used here from the simulated slowness curve according to:
 | (7) |
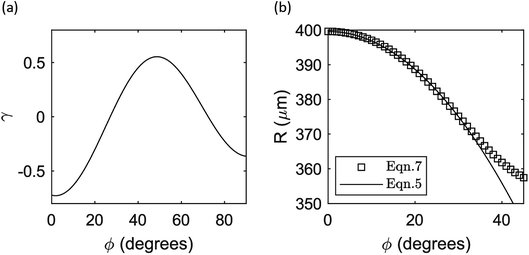 | ||
| Fig. 4 Plots of (a) anisotropy parameter, γ, and (b) the curvature, R, of the innermost IDT finger as a function of propagation direction, ϕ; the solid line in b is for a fitted value of γ = −0.31. | ||
3.2 Effect of transducer geometry on acoustic beam morphology
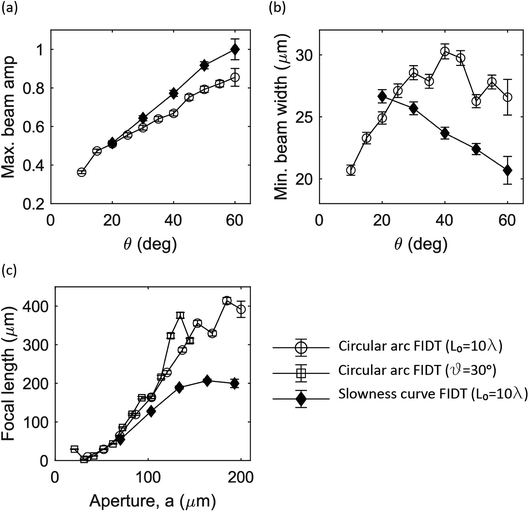
Simulated displacement fields were characterised by their peak displacement amplitude, minimum beam width and measured focal length, which are plotted in Fig. 5 as a function of the angle subtended at the focal point, θ, and the aperture, a. Exemplary simulated displacement fields are shown alongside measured fields in Fig. 3b for comparison. For circular arc IDTs the aperture was varied by changing θ and L0, whilst for slowness-curve-adjusted IDTs the aperture was varied by changing θ.Slowness-curve-adjusted IDTs exhibit consistently larger displacement amplitudes and smaller beam widths than circular arc IDTs for θ > 20°, which indicates superior focusing. The morphologies of the measured displacements fields are consistent with the simulated fields however, we note that the measured peak displacement amplitudes were actually larger for circular arc IDTs than slowness-curve-adjusted IDTs (134 pm and 82.4 pm for circular arc and slowness-curve-adjusted IDTs, respectively). This small difference in measured displacement amplitudes is likely a result of a difference in the electrical impedance of the devices (S11 minima were −5.48 dB and −3.20 dB for circular arc and slowness-curve-adjusted IDTs). The relationship between the number of finger pairs, aperture and electrical impedance has been well characterised for straight IDT devices.30–32 We may extend this analysis to curved IDTs by dividing the IDT into segments across which the curvature is negligible; then, the overall IDT impedance is the parallel sum of individual segment impedances. Given that the crystallographic X direction exhibits the strongest electromechanical coupling coefficient, we expect the impedance to be lowest for the segments oriented in this direction. Although the variation in impedance across the arc of the IDT will depend on the anisotropy of the electromechanical coupling coefficient, the lowest impedance will dominate the overall IDT impedance. As such, we expect to see little impact on the overall impedance by altering either the arc (θ) or the curvature of the IDT. The morphologies of the simulated displacement fields agree exceptionally well with the measured displacement fields, which validates the use of simulated displacement fields to investigate the design of focused IDTs.
Not surprisingly, the focal length of circular arc IDTs increases with aperture, regardless of whether the aperture was altered by varying θ or L0. In contrast, the focal length converges at the geometric focal length for slowness-curve-adjusted IDTs. Whilst this is consistent with our expectations of beam steering effects, slowness-curve-adjusted IDTs also exhibit a linear relationship between focal length and aperture for a < 100 μm (corresponding to θ < 40°). We speculate that as the aperture approaches several acoustic wavelengths, diffraction will dominate the anticipated focusing behaviour.
3.3 Impact of IDT structure on particle capture in streaming vortices
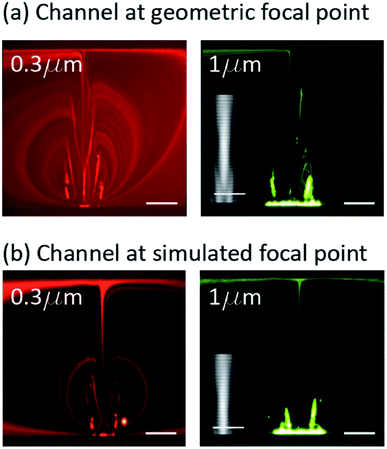
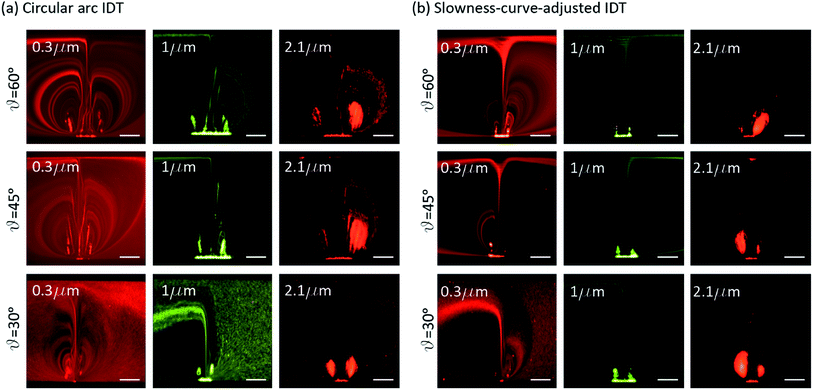
We investigated the impact of microchannel placement with respect to the focused IDTs on particle capture in streaming vortices. Microchannels were located such that the near channel wall was aligned with either the geometric or simulated focal regions of a circular arc IDT with θ = 45°. Fluorescence micrographs of 0.3 and 1 μm particles during SAW excitation are shown for these two channel configurations in Fig. 6, with the simulated time-averaged substrate displacement field shown in the inset. The extended near-field region enlarges the beam width near the channel wall and causes prominent side lobes (see Fig. 6a inset), which are mimicked in the image of 0.3 μm particles. By locating the microchannel above the simulated focal point, beyond the extended near-field region, the side lobes are eliminated and the beam width is significantly narrowed, which can likewise be seen in the 0.3 μm particle image. The narrower beam width at the channel wall results in complete particle focusing into the stagnation points of the streaming field. Whilst locating the focal region for a given IDT design is a tractable problem either by simulation or direct measurement, this is not practical.An alternative, more straightforward approach is to use slowness-curve-adjusted IDT designs, as we now demonstrate. Fluorescent micrographs of 2.1, 1 and 0.3 μm diameter particles aligned in the focused acoustic field at circular arc and slowness-curve-adjusted IDTs with θ values of 30, 45 and 60° are given in Fig. 7. Particle focusing can be seen in real-time in ESI Videos 1 and 2† for 5 μm particles at circular arc and slowness-curve-adjusted IDTs, respectively for θ = 60°. Considering first the circular arc IDTs, more particles are concentrated into streaming vortices at higher θ values. This is consistent with our simulated and measured displacement fields, which indicate that steeper displacement gradients, thus larger acoustic forces, are produced at the beam edges for higher θ values. Accordingly, we observe similar improvement in focusing by replacing the circular arc IDT design with a slowness-curve-adjusted one, as shown in Fig. 7b. Whilst both IDT designs capture 2.1 μm particles in tightly circulating vortices, slowness-curve-adjusted IDTs collect a larger portion of suspended 1 μm particles than their circular arc counterparts, and only the slowness-curve-adjusted IDTs show a certain degree of focusing of 300 nm particles. Furthermore, we see that slowness-curve-adjusted IDTs demonstrate marginally better particle focusing to circular arc IDTs where the microchannel was aligned with the actual focal region, exemplifying the practical benefits of slowness-curve-adjusted IDTs.
4. Conclusion
Focused SAWs are a valuable tool for micro and nanoparticle manipulation, where particles can be focused into streamlines at specific channel locations or trapped in the stagnation points of acoustic streaming vortices. Both the acoustic streaming pattern and acoustic radiation force are highly dependent on the morphology of the underlying displacement field and, thus, on the position of the microchannel relative to the IDT. Beam steering effects in anisotropic substrates shift and elongate the focal region, which adversely affects the behaviour of suspended particles. Whilst the impact of beam steering can be directly measured with LDV scans, estimated using computational models or calculated from the substrate stiffness matrix, these approaches are time-consuming and require specialised tools. A simpler approach is to adopt a slowness-curve-adjusted IDT design which negates the effects of beam steering. Whilst this approach also requires calculation of the slowness curve for the substrate, this is a one-time calculation from which we have provided a simple function to describe the slowness-curve-adjusted IDT geometry that can be used with conventional CAD software. The slowness-curve-adjusted IDTs described herein reproduce the particle behaviour observed in circular arc IDTs where the microchannel is placed at the actual beam focal point, without the need to determine the location of that focal point.Conflicts of interest
The authors are aware of no conflicts of interest in relation to the work presented herein.Acknowledgements
This work was supported by Singapore Ministry of Education Academic Research Fund Tier 2 (T2MOE1603) and Singapore SMART Innovation Grant (SMIG17002) awarded to Y. A. This work was also supported by EFRE InfraPro project ChAMP of the IFW Dresden (A. W.).References
- C. D. Wood, et al., Formation and manipulation of two-dimensional arrays of micron-scale particles in microfluidic systems by surface acoustic waves, Appl. Phys. Lett., 2009, 94, 054101 CrossRef.
- R. D. O’Rorke, et al., Acousto-microfluidics: Transporting microbubble and microparticle arrays in acoustic traps using surface acoustic waves, J. Appl. Phys., 2012, 111, 755–758 CrossRef.
- C. D. Wood, et al., Alignment of particles in microfluidic systems using standing surface acoustic waves, Appl. Phys. Lett., 2008, 92, 044104 CrossRef.
- D. J. Collins, et al., Acoustic tweezers via sub-time-of-flight regime surface acoustic waves, Sci. Adv., 2016, 2, e1600089 CrossRef PubMed.
- D. J. Collins, et al., Self-Aligned Acoustofluidic Particle Focusing and Patterning in Microfluidic Channels from Channel-Based Acoustic Waveguides, Phys. Rev. Lett., 2018, 120, 074502 CrossRef CAS PubMed.
- D. J. Collins, et al., Two-dimensional single-cell patterning with one cell per well driven by surface acoustic waves, Nat. Commun., 2015, 6, 8686 CrossRef CAS PubMed.
- A. J. Smith, et al., Rapid cell separation with minimal manipulation for autologous cell therapies, Sci. Rep., 2017, 7, 41872 CrossRef CAS PubMed.
- H. Bruus, Acoustofluidics 10: scaling laws in acoustophoresis, Lab Chip, 2012, 12, 1578–1586 RSC.
- F. Guo, et al., Three-dimensional manipulation of single cells using surface acoustic waves, Proc. Natl. Acad. Sci., 2016, 113, 1522–1527 CrossRef CAS PubMed.
- Z. Ma, Y. Zhou, D. J. Collins and Y. Ai, Fluorescence activated cell sorting via a focused traveling surface acoustic beam, Lab Chip, 2017, 17, 3176–3185 RSC.
- D. J. Collins, Z. Ma, J. Han and Y. Ai, Continuous micro-vortex-based nanoparticle manipulation via focused surface acoustic waves, Lab Chip, 2017, 112, 4469–4506 Search PubMed.
- D. J. Collins, A. Neild and Y. Ai, Highly focused high-frequency travelling surface acoustic waves (SAW) for rapid single-particle sorting, Lab Chip, 2015, 16, 471–479 RSC.
- D. J. Collins, et al., Selective particle and cell capture in a continuous flow using micro-vortex acoustic streaming, Lab Chip, 2017, 17, 1769–1777 RSC.
- P. Rogers and A. Neild, Selective particle trapping using an oscillating microbubble, Lab Chip, 2011, 11, 3710–3715 RSC.
- R. Thameem, B. Rallabandi and S. Hilgenfeldt, Particle migration and sorting in microbubble streaming flows, Biomicrofluidics, 2016, 10, 14124 CrossRef PubMed.
- D. J. Collins, Z. Ma and Y. Ai, Highly Localized Acoustic Streaming and Size-Selective Submicrometer Particle Concentration Using High Frequency Microscale Focused Acoustic Fields, Anal. Chem., 2016, 88, 5513–5522 CrossRef CAS PubMed.
- M. S. Kharusi and G. W. Farnell, On Diffraction and Focusing in Anisotropic Crystals, Proc. IEEE, 1972, 60, 945–956 Search PubMed.
- V. Laude, et al., Subwavelength focusing of surface acoustic waves generated by an annular interdigital transducer, Appl. Phys. Lett., 2008, 92, 1–4 CrossRef.
- J. Zhou, et al., Nebulization using ZnO/Si surface acoustic wave devices with focused interdigitated transducers, Surf. Coat. Technol., 2019, 367, 127–134 CrossRef CAS.
- M. Jangi, et al., Concentrated vertical jetting mechanism for isotropically focused Zno/Si surface acoustic waves, Int. J. Multiphase Flow, 2019, 114, 1–8 CrossRef CAS.
- A. Riaud, M. Baudoin, O. B. Matar, L. Becerra and J. Thomas, Selective manipulation of microscopic particles with precursor swirling Rayleigh waves, Phys. Rev. Appl., 2017, 7, 024007 CrossRef.
- A. Holm, Q. Stürzer, Y. Xu and R. Weigel, Investigation of surface acoustic waves on LiNbO3, quartz, and LiTaO3 by laser probing, Microelectron. Eng., 1996, 31, 123–127 CrossRef CAS.
- V. Laude, C. F. Jerez-Hanckes and S. Ballandras, Surface Green's Function of a Piezoelectric Half-Space, IEEE Trans. Ultrason. Ferroelectrics Freq. Contr., 2006, 53, 420–428 Search PubMed.
- C. Matter, Properties study of LiNbO3 lateral field excited device working on thickness extension mode properties study of LiNbO3 lateral field excited device working on thickness extension mode, Chin. Phys. B, 2010, 19, 9 Search PubMed.
- R. T. Smith and F. S. Welsh, Temperature Dependence of the Elastic, Piezoelectric, and Dielectric Constants of Lithium Tantalate and Lithium Niobate, J. Appl. Phys., 1971, 42, 2219 CrossRef CAS.
- S. K. Sankaranarayanan and V. R. Bhethanabotla, Numerical analysis of wave generation and propagation in a focused surface acoustic wave device for potential microfluidics applications, IEEE Trans. Ultrason. Ferroelectrics Freq. Contr., 2009, 56, 631–643 Search PubMed.
- P. B. Muller, R. Barnkob, M. J. H. Jensen and H. Bruus, A numerical study of microparticle acoustophoresis driven by acoustic radiation forces and streaming-induced drag forces, Lab Chip, 2012, 12, 4617 RSC.
- C. A. Schneider, W. S. Rasband and K. W. Eliceiri, NIH Image to ImageJ: 25 years of image analysis, Nat. Methods, 2012, 9(7), 671–675 CrossRef CAS PubMed.
- J. Z. Wilcox and R. E. Brooks, Frequency-dependent beam steering by a focusing array of surface acoustic wave transducers: experiment, J. Appl. Phys., 1985, 58, 1160–1168 CrossRef.
- C. S. Hartmann, D. T. Bell and R. C. Rosenfeld, Impulse Model Design of Acoustic Surface-Wave Filters, IEEE Trans. Microwave Theory Tech., 1973, 21(4), 162–175 CrossRef.
- A. N. Nordin and M. E. Zaghloul, Modeling and fabrication of CMOS surface acoustic wave resonators, IEEE Trans. Microwave Theory Tech., 2007, 55(5), 992–1001 CAS.
- C. K. Campbell, Obtaining the fundamental and harmonic radiation conductances of a reflective SAW interdigital transducer, Proc.–IEEE Ultrason. Symp., 1998, 1, 169–173 Search PubMed.
Footnote |
| † Electronic supplementary information (ESI) available. See DOI: 10.1039/c9ra10452f |
| This journal is © The Royal Society of Chemistry 2020 |

