 Open Access Article
Design of a gold nanoprobe for the detection of Pseudomonas aeruginosa elastase gene (lasB)†
Alireza Farhangia,
Amir Peymanib and
Hossien Ahmadpour-Yazdi *cd
*cd
aStudent Research Committee, Qazvin University of Medical Sciences, Qazvin, Iran
bMedical Microbiology Research Center, Qazvin University of Medical Sciences, Qazvin, Iran
cMedical Biotechnology Department, Faculty of Paramedical Sciences, Qazvin University of Medical Sciences, Qazvin, Iran. E-mail: hahmadpour@qums.ac.ir
dMedical Microbiology Research Center, Qazvin University of Medical Sciences, Qazvin, Iran
First published on 17th March 2020
Abstract
Nosocomial infections are one of the major health problems that increase mortality. Pseudomonas aeruginosa is one of the important causes of nosocomial infections. This bacterium has a gene called the lasB gene, the product of which is a zinc-dependent metalloprotease. This gene plays a central role in the pathogenesis of Pseudomonas spp. This pathogen is highly toxic and destroys tissues and also has a moderating effect on the immune system; on the other hand, it initiates the intracellular pathway of biofilm growth. Although there are methods such as molecular methods for identifying the lasB gene, due to the high cost and the need for specialized personnel, it is necessary to replace them with an appropriate method. In this study, a gold nanoparticle-based DNA diagnostic sensor sensitive to the aggregation states of gold nanoparticles was used to identify amplified and non-amplified lasB genes. The results of the experiment were evaluated both visually and spectrally. The minimum detection value of this method was 10 ng of the amplified lasB gene and 50 ng of the non-amplified lasB gene. This method is very fast, simple, easy and low cost.
1 Introduction
Nosocomial infections have been one of the major health problems for a long time, and they increase the mortality rate in hospitalized patients. These infections have increased health care costs.1 About 5% to 10% of hospitalized patients are infected with a nosocomial infection.2 According to WHO studies, the prevalence of nosocomial infections in developing countries is between 5.7% and 19/1%, while it is 7/6% in developed countries.3 According to the studies in Iran, the most common bacteria that are isolated from patients with nosocomial infections include Pseudomonas aeruginosa (24/3%), Klebsiella pneumoniae (18/6%) and enterobacteria (14/3%).1 The genus Pseudomonas belongs to the family of Pseudomonadaceae and to the class of Pseudomonadales. Pseudomonas aeruginosa is a ubiquitous Gram-negative opportunistic bacterium,4 which is the most important cause of nosocomial infections in patients with weakened immune systems; Pseudomonas infections have led to a mortality rate of about 50% in these patients.5–7 Pseudomonas aeruginosa is one of the most common causes of lower respiratory tract infection. It has a gene called lasB that produces a zinc-dependent metalloprotease called Pseudomonas elastase or pseudolysin that plays a critical role in the pathogenesis of Pseudomonas aeruginosa. This pathogen is highly toxic and damages tissues and also has a moderating effect on the immune system; on the other hand, it initiates the intracellular pathway of biofilm growth. These are the pathogenic mechanisms of lasB that cause a chronic infection to develop.8 To identify Pseudomonas aeruginosa bacteria, gram staining and culture in different environments can be used, which are time consuming and do not have high sensitivity and specificity.9,10 lasB can be identified using other methods, such as PCR and real-time PCR. These two methods, although highly specific and sensitive, have limitations due to the requirement of dedicated reagents, expensive equipment and specialized personnel.11,12Recently, researchers have shown great interest in using gold nanoparticles to identify pathogens.13–20 This method of detection is based on the property of surface plasmon resonance (SPR) of gold nanoparticles. The change in the dispersion state of the nanoparticles results in a color change, which results in detection.21,22 Many studies have used gold nanoparticles containing thiol-modified oligonucleotides (Au nanoprobes) for diagnosis.23 These nanoparticles have unique optical properties. These features enable us to visualize their color change and thus, no advanced tools are needed in this method. These nanoprobes can be used in two ways to identify nucleic acid sequences using a cross-linking method (CL) and a non-cross-linking method (NCL).21,23–25 In the NCL colorimetric assay, attaching the complementary portion of the target molecule to the nanoprobe makes the nanoprobes resistant to salt-induced aggregation.21,26 It has high sensitivity and specificity, is less expensive than conventional methods and does not require much expertise.27 As a result of light colliding with gold nanoparticles, the conduction electrons of gold oscillate collectively and reflect light at different wavelengths from that of the light received; this optical phenomenon is called surface plasmon resonance. The plasmon peak and color of AuNPs are influenced by their shape and size.28 Gold nanoparticles smaller than 60 nm are commonly used in biosensors with an absorption peak at about 520 nm;29 the color of the solution in which they are present is red, which is purple or gray in the presence of salts, and the position of their absorption peak shifts to longer wavelengths (red-shift).30
In this study, we intend to identify the lasB gene of Pseudomonas aeruginosa using a gold nanoparticle-based colorimetric assay. In this method, we used the NCL approach. We tested the identification method on the lasB gene and DNA was extracted from Pseudomonas aeruginosa. In each experiment, we used a negative control and unrelated DNA samples to determine the sensitivity and specificity of the method.
2 Materials and methods
2.1 Bacterial strains and reagents
In the present study, we used a strain of Pseudomonas aeruginosa ATTC 27853 in a glycerin solution prepared by the Shahid Rajaee Hospital in Qazvin. From the Qazvin University of Medical Sciences, we purchased the E. coli ATTC 25922 bacteria. We bought the urease gene embedded in the pBHA vector from the Bioneer Company. We obtained the oligonucleotide primers and the HPLC-purified thiol-modified probe from Bioneer Company and we bought the PCR components from Yektatajhiz Azma Company. We performed DNA extraction with the Gram-negative bacterial DNA extraction kit made by the Canadian Biobasic Company. Primers and probe sequences are shown in Table 1, ESI.† Nap-5 column was bought from GE Healthcare. The chemicals we used in this study were of the best quality and provided by Sigma-Aldrich and Merck. All solutions used in this study were prepared in deionized water (18.0 MΩ cm).2.2 Primers and probe
The probe sequence was designed for the lasB gene. The sequence of the lasB gene was obtained from GenBank (http://www.ncbi.nlm.nih.gov) and the probe specificity for the lasB gene was evaluated by the NCBI Basic Local Alignment Search Tool (BLAST). Using the Primer 3 site, we designed primers for the lasB gene. We tested the designed primers on the NCBI site with the Primer Blast to determine its specificity for the lasB gene. Then, using the OligoAnalyzer from the Integrated DNA Technologies site (http://www.idtdna.com), we investigated the designed primers and probes for the possibility of self-complementarities, hetero-complementarities and secondary structures being formed. The designed probe has two parts: one part contains an 18-nucleotide fragment, which complements a portion of the lasB gene; the other part contains 10 nucleotides A (polyA) attached to the thiolated 5′ end, whose role is to bridge the complementary portion of the probe with gold nanoparticles, so that the complementary portion is free and can easily attach to the lasB gene.312.3 Equipment
A Primus Thermal Cycler (Biotech Co, USA) was used for PCR and incubation. A Nanodrop ND-1000 UV/Vis spectrophotometer (Thermo Fisher Scientific, USA) and a DR6000 UV/Vis spectrophotometer (HACH, Germany) were used to record the concentration of oligonucleotides and UV-Vis absorption spectra. A Philips CM30 200 kV transmission electron microscope was used to take the TEM images of gold nanoparticles. A UV Transilluminator (Labnet, USA) was used to capture the electrophoresis images. A Froilabo centrifuge (France) was used for all the centrifugations. A Zetasizer Nano ZS (Malvern Panalytical) was used to detect the hydrodynamic diameter and electric charge of gold nanoparticles and gold nanoprobe.2.4 Synthesis of citrate-stabilized gold nanoparticles and Au nanoprobes
Gold nanoparticles less than 30 nm in size were synthesized by the reduction of a gold salt via sodium citrate (Frense and Natan methods).32,33 Briefly, 250 ml of a gold salt solution (1 mM concentration) was boiled on a warming plate (with a magnetic stirrer) and then at the boiling point, 25 ml of a trisodium citrate solution (38.8 mM) was added. The color of the solution changed from yellow to wine red. After 15 minutes of boiling, the heat was turned off, but the stirring process was continued for another 15 minutes. After cooling, the solution was transferred to glass containers and kept away from light. The characteristics of the synthesized gold nanoparticles were investigated by the UV-Vis spectrophotometer, TEM and Zetasizer.To fabricate the gold nanoprobe, we used the salt ageing method (Mirkin method) with a little change.34–37 In summary, to reduce potential disulfide bonds in thiol probes, we used a 0.5 M dithiothreitol solution and then desalted and purified the probes with an NAP-5 column. We determined the concentration of the probe with a nanodrop machine. Then, at our desired concentration, we mixed the appropriate volumes of probes with 1 ml of gold nanoparticle solution. After 2 hours of incubation, the pH of the solution was adjusted to 7 by a phosphate buffer (0.1 M). Subsequently, sodium dodecyl sulfate (SDS) was added to the probe solution as a surfactant, and the solution was centrifuged at 14![[thin space (1/6-em)]](https://www.rsc.org/images/entities/char_2009.gif) 000 rpm for 2 minutes at 4 °C. In the next step, the salting buffer with a concentration of 2 M of NaCl was added to the resulting solution (dropwise). The final concentration of NaCl should be 0.3 M. Next, we washed the solution 4 times with the washing buffer (10 mM phosphate buffer + 150 mM NaCl; pH 7.4). After washing and removing the supernatant, we dissolved the nano-probe precipitate in 2 ml of assay buffer (10 mM phosphate buffer, 0.3 M NaCl; pH 7.4) and stored the resulting nanoprobe in a dark environment at 4 °C until use. Using the UV-Vis spectrophotometer and Zetasizer, we investigated the success rate of nano-probe production. In this study, we used a nano-probe containing 0.9 nmol of the probe.
000 rpm for 2 minutes at 4 °C. In the next step, the salting buffer with a concentration of 2 M of NaCl was added to the resulting solution (dropwise). The final concentration of NaCl should be 0.3 M. Next, we washed the solution 4 times with the washing buffer (10 mM phosphate buffer + 150 mM NaCl; pH 7.4). After washing and removing the supernatant, we dissolved the nano-probe precipitate in 2 ml of assay buffer (10 mM phosphate buffer, 0.3 M NaCl; pH 7.4) and stored the resulting nanoprobe in a dark environment at 4 °C until use. Using the UV-Vis spectrophotometer and Zetasizer, we investigated the success rate of nano-probe production. In this study, we used a nano-probe containing 0.9 nmol of the probe.
2.5 Extraction of the bacterial genome
Using the DNA Extraction Kit, we extracted the genomes of Pseudomonas aeruginosa and E. coli.2.6 PCR amplification of the target lasB gene
Using the primers listed in Table 1 of ESI,† we amplified the lasB gene by the PCR process. Using 1% gel electrophoresis, we examined the PCR products.2.7 PCR amplification of the non-target urease gene
The urease gene from the ureaplasma urealyiticum bacterium was selected as the negative control (non-target) for its proximity (378 bp) to our target gene length. The gene was amplified in a final volume of 1 μl. The concentration of the reactants and the replication program were taken from the paper published by Yi et al.38 The amplification program is presented in Table 2, ESI.†2.8 Purification of the PCR product
Using Taiwan's favorGen PCR Product Purification Kit, the PCR product was purified to remove the dimer primer and other interfering substances. The purified PCR product was extracted from the column with 40 μl elution buffer for later use.2.9 Au-nanoprobe colorimetric assay
2.10 Statistical analysis
The differences between the samples and the negative control and the non-target and the associated P-values were calculated and determined using the Excel software.3 Results and discussion
3.1 lasB and urease gene amplification
A 415-bp fragment from the lasB gene and a 378-bp fragment of the urease gene were amplified by the PCR process, and the presence of the above-mentioned genes and the success of gene replication were confirmed by gel electrophoresis.3.2 Characterization of gold nanoparticles and gold nanoprobe
The size distribution of the synthesized gold nanoparticles was investigated using dynamic light scattering (DLS). Most nanoparticles had a size of about 15 nm and good monodispersity (Fig. 1, ESI†).The examination of the TEM images showed that the synthesized gold nanoparticles were spherical and had a diameter of 15 nm, which confirmed the result of DLS (Fig. 2, ESI†).
The analysis of spectrophotometry results indicated that the maximum absorption of gold nanoparticles was at 518 nm (Fig. 3, ESI†). The concentration of the solution containing gold nanoparticles was calculated as 10 nM.39–41
The maximum absorption peak of the nanoprobe was at about 523 nm, which was due to the attachment of the thiol probe onto the surface of the gold nanoparticles, which resulted in resizing and changes in the refractive index42 (Fig. 4, ESI†).
DLS analysis showed a change of about 2 nm in the diameter of the Au nanoprobes compared to that for the gold nanoparticles (16.13 nm) (polydispersity = 0.433) (Fig. 5, ESI†).
To ensure the binding of the probes to the gold nanoparticles, a DTT test was performed, in which a 16 mM DTT (dithiothreitol) solution was added to the Au nanoprobe (10 nM). DTT released probes from the surface of the gold nanoparticles. As a result, the detached bare gold nanoparticles accumulated in the presence of 0.3 M NaCl and the color changed from red to gray (Fig. 6, ESI†).
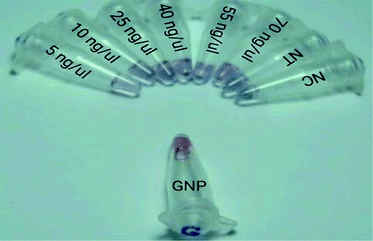
3.3 Visual colorimetric assay
3.4 Spectral analysis
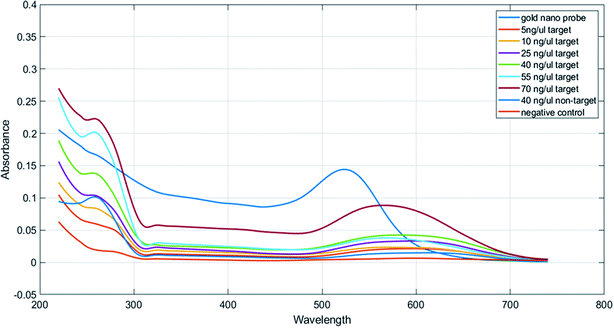 | ||
| Fig. 3 Concentration response graphs of samples containing the PCR product obtained from the nano drop spectroscopy analysis. | ||
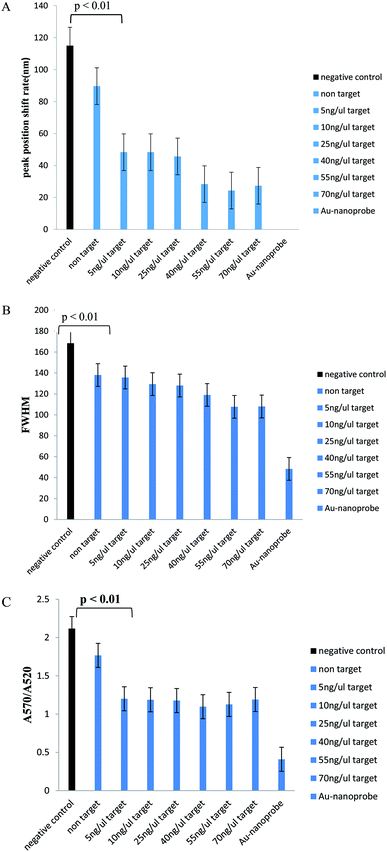
In Table 1, we can see the spectroscopic analysis of various aspects, such as plasmon peak position, absorption intensity, nanoprobe position shift, and full width at half maximum (FWHM). The results of this analysis confirmed the results of the concentration–response graph. In samples with a low target DNA concentration, peak translocation and FWHM are higher than those for the samples with a higher target DNA concentration, and their peak intensity is low. However, in the negative control and non-target samples, the absorption peak intensity is very low and the peak displacement rate and FWHM are much higher than those for the positive samples and there is a significant difference between them (p < 0.01). Also, the aggregation intensity (absorption ratio at 570 and 520 nm; ratio A570/A520) was much higher for the negative control and non-target samples than that for the positive samples (p < 0.01) (Fig. 4).
| Samples | Plasmon peak position, nm | Maximum peak intensity | Nanoprobe's plasmon peak shift, nm | FWHM, nm |
|---|---|---|---|---|
| Nanoprobe | 520 | 0.1546 ± 0.0011 | — | 48.33 ± 0.57 |
| Amplified PCR product (5 ng μl−1) | 568.33 ± 8.504 | 0.034 ± 0.0104 | 48.33 ± 8.504 | 135.66 ± 6.35 |
| Amplified PCR product (10 ng μl−1) | 568.33 ± 8.504 | 0.0403 ± 0.013 | 48.33 ± 8.504 | 129.33 ± 6.02 |
| Amplified PCR product (25 ng μl−1) | 565.66 ± 9.81 | 0.049 ± 0.014 | 45.66 ± 9.81 | 128 ± 9.84 |
| Amplified PCR product (40 ng μl−1) | 548.33 ± 14.43 | 0.057 ± 0.014 | 28.33 ± 14.43 | 119 ± 20.88 |
| Amplified PCR product (55 ng μl−1) | 544.33 ± 7.505 | 0.0706 ± 0.03 | 24.33 ± 7.505 | 107.66 ± 8.02 |
| Amplified PCR product (70 ng μl−1) | 547.33 ± 4.93 | 0.108 ± 0.017 | 27.33 ± 4.93 | 108 ± 1.73 |
| Non-complementary amplified PCR product (40 ng μl−1) | 609.66 ± 8.504 | 0.025 ± 0.007 | 89.66 ± 8.504 | 138 ± 5.19 |
| Negative control | 635 ± 4.58 | 0.015 ± 0.005 | 115 ± 4.58 | 168.33 ± 27.15 |
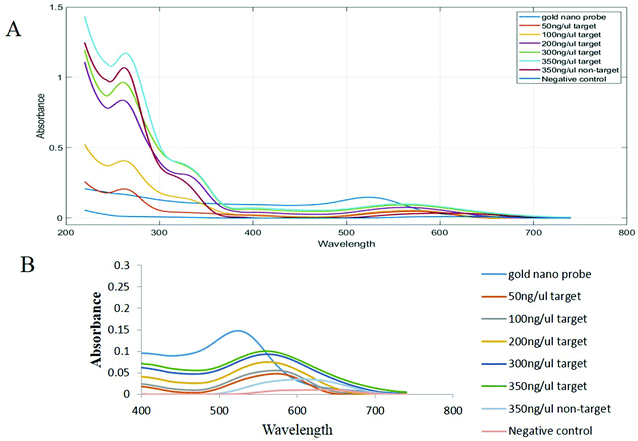
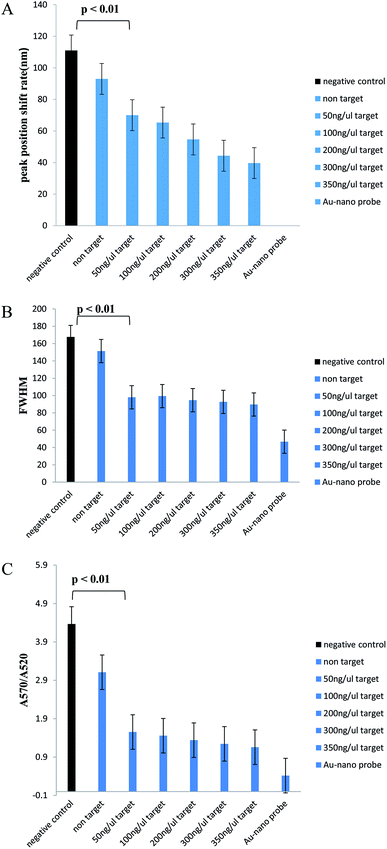
In Table 2, we can see the spectroscopic analysis of the extracted DNA samples analyzed from the aspects of plasmon peak position, absorption peak intensity, plasmon peak displacement and FWHM. The lower the target DNA concentration in the sample, the lower the absorbance and the higher the plasmon translocation rate and the FWHM value. However, in the negative control and non-target samples, the absorption intensity is much lower than that for the positive samples and the plasmon peak translocation rate and FWHM are significantly different from those of the positive samples due to the aggregation of nanoprobes (p < 0.01). The intensity of aggregation in the negative control and non-target samples is significantly different from that for the positive samples (p < 0.01) (Fig. 6).
| Samples | Plasmon peak position, nm | Maximum peak intensity | Nanoprobe's plasmon peak shift, nm | FWHM, nm |
|---|---|---|---|---|
| Nanoprobe | 520 | 0.156 ± 0.001 | — | 46.66 ± 0.57 |
| Extracted genome (50 ng μl−1) | 590 | 0.048 ± 0.0015 | 70 | 98 ± 1 |
| Extracted genome (100 ng μl−1) | 585.33 ± 0.57 | 0.054 ± 0.0015 | 65.33 ± 0.57 | 99.33 ± 4.93 |
| Extracted genome (200 ng μl−1) | 574.66 ± 0.57 | 0.073 ± 0.001 | 54.66 ± 0.57 | 94.66 ± 0.57 |
| Extracted genome (300 ng μl−1) | 564.33 ± 1.154 | 0.092 ± 0.002 | 44.33 ± 1.154 | 92.66 ± 0.57 |
| Extracted genome (350 ng μl−1) | 559.66 ± 0.57 | 0.099 ± 0.002 | 39.66 ± 0.57 | 89.66 ± 0.57 |
| Unrelated extracted genome (350 ng μl−1) | 613 | 0.039 ± 0.001 | 93 | 151.33 ± 3.05 |
| Negative control | 631 | 0.014 ± 0.001 | 111 | 167.66 ± 2.51 |
In the presence of 0.5 mM MgCl2 salt, the nanoprobes do not aggregate and retain their color; however, at the critical coagulation concentration (CCC) point, the salt-induced aggregation force overcomes the electrostatic repulsive force and the spatial barrier. The nanoprobes aggregate and we can see the color change. However, when the nanoprobe is hybridized to the target DNA, the electrostatic repulsion force and the spatial barrier between the nanoprobes increase and at the CCC point resist salt-induced aggregation.
According to the results, the detection limit of this method was 5 ng μl−1 lasB amplified gene and 50 ng μl−1 lasB non-amplified gene. In this section of the article, we briefly refer to the research that has identified different targets in a similar way.
In 2006, Baptista et al. identified the amplified beta-RNA polymerase subunit of Mycobacterium tuberculosis using the NCL method and sodium chloride salt as the inducer. The probe designed for this task had 16 nucleotides and no spacer. The minimum value detected in their method was 0.75 μg μl−1. Because they used a salt with lower ionic strength than the salt used in our study (MgCl2) and since the probe unlike the probe used in our study had no spacers, the diagnostic power of their method was lower than that of our method (50 ng μl−1 in an unamplified state).43 In 2018, Thenor Aristotile Charles S. et al. used functional gold nanoparticles on which thiol oligonucleotides were inserted and they identified the unamplified DNA of Mycobacterium avium subspecies paratuberculosis by the NCL method. In the positive samples, after the addition of MgCl2, no change in color occurred; however, in the negative samples, after the addition of the salt, a color change occurred. The minimum value that could be detected by their method was 103 ng μl−1.17 This study is similar to our study in terms of the type of the aggregation inducer (MgCl2) and the identification of non-amplified DNA, but the probe used was 22 nucleotides in length and unlike ours, the probe had no spacer. For this reason, the minimum diagnostic value of their method was 103 ng μl−1, but this value in our study was 50 ng μl−1. In 2019, Ahmad Mobed et al. using gold nanoparticles attached to thiol oligonucleotides identified the L. pneumophila mip gene using the NCL method.23 In their study, unlike our study, NaCl salt was used to induce aggregation, and the probe used was 32 nucleotides longer than our probe; also, unlike our probe, it had no spacer, and the minimum diagnostic value of their method was 1 zM. In 2020, Nahid Ghorbanzadeh et al. using a gold nanoprobe and the NCL approach were able to identify the urease amplified gene related to ureaplasma urealyticum.44 In their study, a 23-nucleotide probe with 6 nucleotide spacers was used. In their study, as in our study, MgCl2 salt was used for the induction of aggregation and the probe used in their study had a spacer like our probe. Unlike our study, they only performed identification on the amplified gene. Their minimum diagnostic value was 10 ng μl−1, which was close to the minimum diagnostic value of our method of detecting amplified genes (5 ng μl−1).
4 Conclusion
In this study, a colorimetry-based method using gold nanoparticles was designed to identify the amplified and non-amplified lasB genes. The results show the high sensitivity and specificity of this method. It is also fast, economical and simple and does not require expensive equipment. In the future, this method can be used as a diagnostic strip test or microchip-based assay.Ethical issue
This study was conducted according to the Helsinki declaration approved by our regional institution numbers: IR.QUMS.REC.1396.320, IR.QUMS.REC.1396.282 Qazvin University of Medical Sciences.Conflicts of interest
There are no conflicts to declare.Acknowledgements
This work was supported by the fund of Medical Microbiology Research Center of Qazvin University of Medical Science with grant application number of 28/20/15000.References
- M. S. Barak, S. A. Siadati, P. Salamati, G. Khotaii and M. Mirzarahimi, Journal of Ardabil University of Medical Sciences, 2011, 11, 113–120 Search PubMed.
- B. Khosravi and A. Razavi, EBNESINA, 2010, 13, 43–51 Search PubMed.
- W. H. Organization, Report on the burden of endemic health care-associated infection worldwide, 2011, http://apps.who.int/iris/bitstream/10665/80135/1/9789241501507_eng.pdf Search PubMed.
- E. J. Giamarellos-Bourboulis, E. Papadimitriou, N. Galanakis, A. Antonopoulou, T. Tsaganos, K. Kanellakopoulou and H. Giamarellou, Int. J. Antimicrob. Agents, 2006, 27, 476–481 CrossRef CAS PubMed.
- K.-Y. Wang, Y.-L. Zeng, X.-Y. Yang, W.-B. Li and X.-P. Lan, Eur. J. Clin. Microbiol. Infect. Dis., 2011, 30, 273–278 CrossRef PubMed.
- V. Finck-Barbançon, J. Goranson, L. Zhu, T. Sawa, J. P. Wiener-Kronish, S. M. Fleiszig, C. Wu, L. Mende-Mueller and D. W. Frank, Mol. Microbiol., 1997, 25, 547–557 CrossRef PubMed.
- A. Manafi, J. Kohanteb, D. Mehrabani, A. Japoni, M. Amini, M. Naghmachi, A. H. Zaghi and N. Khalili, BMC Microbiol., 2009, 9, 23 CrossRef PubMed.
- G. R. Cathcart, D. Quinn, B. Greer, P. Harriott, J. F. Lynas, B. F. Gilmore and B. Walker, Antimicrob. Agents Chemother., 2011, 55, 2670–2678 CrossRef CAS PubMed.
- J. M. Johnson and G. M. Church, J. Mol. Biol., 1999, 287, 695–715 CrossRef CAS PubMed.
- M. Muller, Free Radic. Biol. Med., 2002, 33, 1527–1533 CrossRef CAS.
- P. Deschaght, F. De Baets and M. Vaneechoutte, J. Cyst. Fibros., 2011, 10, 293–297 CrossRef CAS PubMed.
- T. Schwartz, H. Volkmann, S. Kirchen, W. Kohnen, K. Schön-Hölz, B. Jansen and U. Obst, FEMS Microbiol. Ecol., 2006, 57, 158–167 CrossRef CAS PubMed.
- S. M. Shawky, A. M. Awad, W. Allam, M. H. Alkordi and S. F. El-Khamisy, Biosens. Bioelectron., 2017, 92, 349–356 CrossRef CAS PubMed.
- N. Azizah, U. Hashim, S. C. Gopinath and S. Nadzirah, Int. J. Biol. Macromol., 2017, 94, 571–575 CrossRef CAS PubMed.
- C. Kong, Y. Wang, E. K. Fodjo, G.-x. Yang, F. Han and X.-s. Shen, Microchim. Acta, 2018, 185, 35 CrossRef PubMed.
- M. R. Zaher, H. A. Ahmed, K. E. Hamada and R. H. Tammam, Appl. Biochem. Biotechnol., 2018, 184, 898–908 CAS.
- T. A. C. S. Ganareal, M. M. Balbin, J. J. Monserate, J. R. Salazar and C. N. Mingala, Biochem. Biophys. Res. Commun., 2018, 496, 988–997 CrossRef CAS PubMed.
- B. Veigas, P. Pedrosa, F. F. Carlos, L. Mancio-Silva, A. R. Grosso, E. Fortunato, M. M. Mota and P. V. Baptista, J. Nanobiotechnol., 2015, 13, 48 CrossRef PubMed.
- M. Saleh and M. El-Matbouli, J. Virol Methods, 2015, 217, 50–54 CrossRef CAS PubMed.
- Y. Alnasser, C. Ferradas, T. Clark, M. Calderon, A. Gurbillon, D. Gamboa, U. S. McKakpo, I. A. Quakyi, K. M. Bosompem and D. J. Sullivan, PLoS Neglected Trop. Dis., 2016, 10, e0005029 CrossRef PubMed.
- F. F. Carlos, O. Flores, G. Doria and P. V. Baptista, Anal. Biochem., 2014, 465, 1–5 CrossRef CAS PubMed.
- H. Ahmadpour-Yazdi, M. R. Hormozi-Nezhad, A. R. Abadi, M. H. Sanati and B. Kazemi, IET Nanobiotechnol., 2015, 9, 5–10 CrossRef.
- A. Mobed, M. Hasanzadeh, M. Aghazadeh, A. Saadati, S. Hassanpour and A. Mokhtarzadeh, Anal. Methods, 2019, 11, 4289–4298 RSC.
- J. Wang, Z. L. Wu, H. Z. Zhang, Y. F. Li and C. Z. Huang, Talanta, 2017, 167, 193–200 CrossRef CAS PubMed.
- G. Wang, Y. Akiyama, S. Shiraishi, N. Kanayama, T. Takarada and M. Maeda, Bioconjugate Chem., 2016, 28, 270–277 CrossRef PubMed.
- D. Pal, N. Boby, S. Kumar, G. Kaur, S. A. Ali, J. Reboud, S. Shrivastava, P. K. Gupta, J. M. Cooper and P. Chaudhuri, PloS One, 2017, 12, e0180919 CrossRef PubMed.
- C. S. Thaxton, D. G. Georganopoulou and C. A. Mirkin, Clin. Chim. Acta, 2006, 363, 120–126 CrossRef CAS PubMed.
- A. P. Ramos, M. A. Cruz, C. B. Tovani and P. Ciancaglini, Biophys. Rev., 2017, 9, 79–89 CrossRef CAS PubMed.
- M. S. Verma, J. L. Rogowski, L. Jones and F. X. Gu, Biotechnol. Adv., 2015, 33, 666–680 CrossRef CAS PubMed.
- L. B. Silva, B. Veigas, G. Doria, P. Costa, J. Inácio, R. Martins, E. Fortunato and P. V. Baptista, Biosens. Bioelectron., 2011, 26, 2012–2017 CrossRef CAS PubMed.
- G. Doria, R. Franco and P. Baptista, IET Nanobiotechnol., 2007, 1, 53–57 CrossRef CAS PubMed.
- W. Haiss, N. T. Thanh, J. Aveyard and D. G. Fernig, Anal. Chem., 2007, 79, 4215–4221 CrossRef CAS PubMed.
- K. C. Grabar, R. G. Freeman, M. B. Hommer and M. J. Natan, Anal. Chem., 1995, 67, 735–743 CrossRef CAS.
- H. D. Hill and C. A. Mirkin, Nat. Protoc., 2006, 1, 324 CrossRef CAS PubMed.
- W. J. Qin and L. Y. L. Yung, Biosens. Bioelectron., 2009, 25, 313–319 CrossRef CAS PubMed.
- B. Veigas, D. Machado, J. Perdigao, I. Portugal, I. Couto, M. Viveiros and P. V. Baptista, Nanotechnology, 2010, 21, 415101 CrossRef PubMed.
- H. Ahmadpour-Yazdi, M. Hormozi-Nezhad, A. Abadi, M. H. Sanati and B. Kazemi, BioImpacts, 2013, 3, 185 Search PubMed.
- J. Yi, B. H. Yoon and E.-C. Kim, Mol. Cell. Probes, 2005, 19, 255–260 CrossRef CAS PubMed.
- M. Fujita, Y. Katafuchi, K. Ito, N. Kanayama, T. Takarada and M. Maeda, J. Colloid Interface Sci., 2012, 368, 629–635 CrossRef CAS PubMed.
- R.-D. Li, B.-C. Yin and B.-C. Ye, Biosens. Bioelectron., 2016, 86, 1011–1016 CrossRef CAS PubMed.
- X. Gao, Y.-H. Tsou, M. Garis, H. Huang and X. Xu, Nanomedicine, 2016, 12, 2101–2105 CrossRef CAS PubMed.
- B. Hu, J. Guo, Y. Xu, H. Wei, G. Zhao and Y. Guan, Anal. Bioanal. Chem., 2017, 409, 4819–4825 CrossRef CAS PubMed.
- P. V. Baptista, M. Koziol-Montewka, J. Paluch-Oles, G. Doria and R. Franco, Clin. Chem., 2006, 52, 1433–1434 CrossRef CAS PubMed.
- N. Ghorbanzadeh, A. Peymani and H. Ahmadpour-Yazdi, IET Nanobiotechnol., 2020, 14, 19–24 CrossRef PubMed.
Footnote |
| † Electronic supplementary information (ESI) available. See DOI: 10.1039/d0ra00848f |
| This journal is © The Royal Society of Chemistry 2020 |

