 Open Access Article
A safe-by-design tool for functionalised nanomaterials through the Enalos Nanoinformatics Cloud platform†
Dimitra-Danai
Varsou
 ab,
Antreas
Afantitis
 a,
Andreas
Tsoumanis
a,
Georgia
Melagraki
a,
Andreas
Tsoumanis
a,
Georgia
Melagraki
 *a,
Haralambos
Sarimveis
 b,
Eugenia
Valsami-Jones
 c and
Iseult
Lynch
 *c
*c
aNanoinformatics Department, Novamechanics Ltd, Nicosia, 1065, Cyprus. E-mail: melagraki@novamechanics.com
bSchool of Chemical Engineering, National Technical University of Athens, 157 80 Athens, Greece
cSchool of Geography, Earth and Environmental Sciences, University of Birmingham, B15 2TT Birmingham, UK. E-mail: i.lynch@bham.ac.uk
First published on 5th November 2018
Abstract
Multi-walled carbon nanotubes are currently used in numerous industrial applications and products, therefore fast and accurate evaluation of their biological and toxicological effects is of utmost importance. Computational methods and techniques, previously applied in the area of cheminformatics for the prediction of adverse effects of chemicals, can also be applied in the case of nanomaterials (NMs), in an effort to reduce expensive and time consuming experimental procedures. In this context, a validated and predictive nanoinformatics model has been developed for the accurate prediction of the biological and toxicological profile of decorated multi-walled carbon nanotubes. The nanoinformatics workflow was fully validated according to the OECD principles before it was released online via the Enalos Cloud platform. The web-service is a ready-to-use, user-friendly application whose purpose is to facilitate decision making, as part of a safe-by-design framework for novel carbon nanotubes.
Introduction
A wide variety of emerging industrial processes, commercial products and biomedical applications are based on nanotechnology. Manufactured nanomaterials (NMs) such as graphene and carbon nanotubes (CNTs) are widely applied, mainly due to their size and unique mechanical and electronic properties.1–3 Carbon family materials, which include the aforementioned CNTs and graphene, also include fullerenes, carbon dots, nanodiamonds and various superstructures, as reviewed by Georgakilas et al., (2015).4 Being among the first discovered NMs and having enormous versatility in size, surface functionalization and properties, CNTs are currently the most widely used carbon-based NMs commercially. The estimated global demand for CNTs was found to be on the order of 3300–3700 tonnes in 2012, with market size and trade value of CNT and CNT-based products on the order of $158.6 million in 2014 and expected to have an annual growth rate of 33.4% until 2019.5 However, many recent studies suggest that the environment and biota may be severely affected by exposure to NMs.6–8 The extent of use of NMs in various applications drives an urgent need for systematic toxicological investigation.A complete experimental toxicity assessment requires expensive and time consuming in vitro and in vivo practices,9 rendering it unfeasible to thoroughly test the NMs already on the market, as well as novel emerging variants. Additionally, it is currently not known how different or modified a NM needs to be to constitute a unique NM (or nanoform in the emerging regulatory arena) – i.e. are different surface functionalisations considered different nanoforms? For chemicals, their uniqueness is established through their individual Chemical Abstract Number (CAS), while NMs currently share a CAS number with their bulk form. Thus, current approaches to the risk assessment of NMs are undertaken on a case-by-case basis, which has been estimated to require 10 years just for the 500–1000 NMs expected to have been registered in the EU by the May 2018 REACH registration deadline.10 To overcome this obstacle in the risk assessment framework, a significant number of alternative – fast and inexpensive – novel techniques, such as Quantitative Nanostructure Activity Relationship (QNAR) models for the prediction of the biological and toxicological effects of NMs, have been proposed in literature.9,11–14 These approaches are collectively moving knowledge and regulatory practice closer to a future of in silico toxicity analysis based on dramatically reduced, or eventually no, experimental input.
Similar to the Quantitative Structure Activity Relationship (QSAR) models utilised in chemoinformatics, QNAR models are mainly based on well-structured databases or well-organized datasets, to establish robust and predictive correlations between NM properties and their biological or toxicological effects. So far, significant efforts have taken place to organize the already available data, including NM biological and toxicological assessment, such as the eNanoMapper database15 and the NanoMILE database16 which together, and along with other emerging datasets, will form the basis of future data structures (e.g. the NanoCommons nanoinformatics infrastructure and KnowledgeBase, http://www.nanocommons.eu). Targeted datasets are also available for specific NM categories for further exploitation. For example, Zhou and co-workers (2008)17 designed and synthesized a library of 80 combinatorially surface modified Multi-walled Carbon Nanotubes (MWCNTs) and tested their binding with 4 specific proteins, and their cytotoxicity (% cell viability) and immunotoxicity (release of Nitric Oxide, NO) to THP-1 cells, which is a widely-accepted dataset, and has already been used in various in silico nanotoxicity studies.12,13,18,19
Different nanostructures have different levels of structural complexity and heterogeneity (presence of inorganic–organic elements and coatings, varying stoichiometry between the particles etc.) and thus extracting quantitative parameters for the characterization of the structural and chemical properties of the nanostructures is a very challenging task that is not yet fully addressed computationally. The development of in silico methods is thus hindered by the absence of sufficiently large physicochemical, geometrical, structural and biological datasets of different nanostructures in available databases.20 The hypothesis that each nanostructure can be represented by its surface modifiers when the core remains identical, can be considered pragmatic, especially taking into account the near- and long-term hazard and risk assessment goals, and the time and cost required for a full characterization – experimental and/or computational – of all available nanostructures. This hypothesis has already been accepted and used in different studies found in the literature.9,21–23
Fourches et al.13 built and validated classification models for the prediction of the protein binding and cytotoxicity of MWCNTs, and made the underlying experimental dataset at least partially available for further analysis. These models were based on Molecular Operating Environment (MOE) and Dragon molecular descriptors computed only from the surface-modifying compounds, assuming that the MWCNT core was the same in all samples. Support vector machines, random forest and k nearest neighbours, have been employed as machine-learning techniques, and the reported accepted CCR (Correct Classification Rate, mean of sensitivity and specificity) of the validation sets ranged from 73 to 75% for the protein binding, and from 70 to 77% for the toxicity endpoint.
Singh et al.19 reported an ensemble learning approach based nano-QSAR model for predicting biological effects of NMs based on molecular descriptors, calculated with Chemistry Development Kit (CDK). Here, the 29 most toxic surface-modified (decorated) MWCNTs from the Zhou et al.17 dataset have been used for the prediction of their impact on cellular viability. For model development, decision tree boost and decision tree forest methods were implemented based on six molecular descriptors of the decorators. The models resulted in R2 values of 0.903 and 0.922 respectively. Shao et al.12 used the 29 most toxic samples in order to build QSAR models based on different sets of descriptors. The CNT–decorator complex was geometrically optimized using the molecular dynamics simulation package GROMACS with the ffgmx force field. All possible combinations of calculated MOE, VolSurf, and 4D-fingerprints descriptors have been used. Multiple linear regression (MLR) and trial QSAR models were built, in a genetic function approximation scheme. For the carbonic anhydrase protein binding endpoint, using only the decorators for the descriptor calculations, R2 and QLOO2 accuracy was reported as 0.892 and 0.832 respectively, while using the combination of a 10 Å nanotube and the decorators, the R2 and QLOO2 measures were reported as high as 0.903 and 0.851 respectively. For the cell viability endpoint, using only the decorators, R2 and QLOO2 were equal to 0.922 and 0.863 respectively, while using the combination of a 10 Å nanotube and the decorators the R2 and QLOO2 measures were 0.857 and 0.759 respectively. These results suggest that depending on the end-point being modelled, and the role of the core versus surface in the specific interaction, inclusion of both components should be assessed to determine whether the core plays a role or not. Unsurprisingly, in the case of protein binding, a minor contribution from the CNTs was found, whereas in the case of toxicity, the surface functionalization played the dominant role, probably by controlling the amount of cellular adhesion and internalization of the CNTs. This reinforces the hypothesis that the decorated MWCNT with the same core can be represented by their surface modifiers for prediction of protein binding and cellular receptor attachment. Given that following the attachment step, nanoparticles including MWCNTs are actively taken up into THP-1 cells via an active endocytotic process (e.g. phagocytosis), we can safely assume that the particle scaffold (core), which is common to the whole dataset, is the driver once attachment, which is ligand-specific, has occurred, and thus the discrimination in terms of the amount of uptake (and thus toxicity) is driven by the ligands, allowing us to ignore the role of the core.
In this present work, a fully-validated predictive QNAR workflow was developed to assess the biological and toxicological profile of MWCNTs, based solely on calculated molecular descriptors of the surface decorators, in order to avoid computationally challenging and time-consuming molecular dynamics simulations and to achieve a fast classification of the samples employing the kNN method. Each MWCNT sample has been evaluated against two different endpoints; protein binding of carbonic anhydrase and toxicity, and was classified as a “binder” or “non-binder” and “toxic” or “non-toxic”, respectively. The driving force for adsorption of Human Carbonic Anhydrase II (HCAII) to nanoparticles has been shown previously to be electrostatic in nature, driven by attraction to negatively charged particle surfaces, and the hydrophobic effect alone was shown not to be strong enough to drive the initial binding at least to positively charged hydrophobic polystyrene nanoparticles.24 For modelling and validation, we tried to use as many of the available CNT samples as possible, and not only the most toxic ones as in previous computational studies. The main target of the proposed workflow was to offer a computational tool that will simplify the design and screening of novel MWCNTs by allowing prediction of the CA binding and cellular toxicity based only on the chemical structure of the surface decoration molecule, as part of a safe-by-design strategy that would allow elimination of potentially toxic modifications at the design stage. Making the tool available online with a user friendly interface enhances its utility as an aid for the decision making of interested research, industry and regulatory groups.
Methods
Dataset
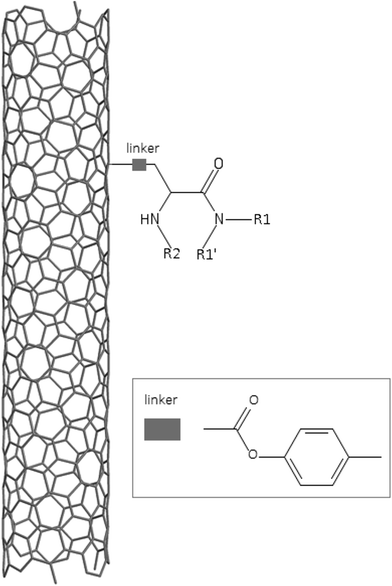
A dataset of 83 surface modified MWCNTs with a controlled size distribution (diameter of 40 ± 10 nm and length of 250 ± 120 nm), derived from the study of Zhou et al. (2008),17 was exploited in silico. Combinational chemistry modifications were performed, by covalently attaching copies of different molecules to the surface of the MWCNTs, whereas the size and the shape of the nanotube remained intact13,17 (Fig. 1). As the studied samples all had the identical core, a reasonable assumption9,13 was made that the differences in their biological behaviour were mostly due to the structural characteristics of their surface ligands. The MWCNTs were experimentally tested in six in vitro assays including CNT binding of the proteins bovine serum albumin (BSA), carbonic anhydrase (CA), chymotrypsin (CT), and haemoglobin (HB), as well as acute toxicity and immune toxicity properties.13,17 Based on the available datasets, we developed two different statistically significant models for the available endpoints of CA binding and acute toxicity, following the splitting of the data into categories, as proposed by Fourches et al. (2015).13 The CA binding affinity values varied from 0.53 to 5.29 at a MWCNT concentration of 15 mg mL−1, thus a separation cut-off limit of 2.0 was chosen, in order to produce two classes of balanced distribution; in total, 44 CNTs were assigned as “binders” (CA protein binding activity greater than 2.0) and 39 as “non-binders” (CA protein binding activity less than 2.0). Similarly, for the toxicity endpoint the cellular survival percentage measured experimentally ranged between 2% and 68% at the high MWCNT concentration of 200 mg mL−1. MWCNTs with cell survival values lower than 37% were labelled as “toxic” (38 samples), whereas samples with cell survival values greater than 43% were labelled as “non-toxic” (35 samples). The MWCNTs around the median cell survival range (37–43%) were not included in the refined modeling set, as it was difficult to define a clear threshold for the division of the two classes.13The following analysis steps were entirely implemented using the KNIME Analytics Platform (Konstanz Information Miner, https://www.knime.com/knime-analytics-platform). In the developed KNIME workflow the available nodes were combined with the Enalos+ nodes, developed by NovaMechanics Ltd (http://enalosplus.novamechanics.com/), in order to build a robust and accurate model development. The workflow was incorporated later in the Enalos Cloud platform (http://www.insilicotox.com/), which hosts predictive models released as web services. Through this platform the need to reduce the amount of time and cost spent in experimental testing can be addressed, using in silico tools for safe-by-design that produce accurate predictions for drug discovery and risk assessment of small molecules and nanomaterials.
Molecular descriptors
In the classical approach of QNAR computational techniques, the transformation of the molecules' structural characteristics into numerical values is a crucial step for model development. According to our strategy every CNT has been represented by its surface-modifying molecules,13 thus we were able to encode the properties of these organic compounds that change across the dataset and later correlate them with the available biological endpoints. It should be emphasized that even though the modelling was performed for the surface ligands, the biological activities and the toxicity are related to the whole decorated MWCNT structure and not only the surface-modifying compounds.13 Mold2 software was used in order to calculate the necessary descriptors. This software calculates a large and diverse set of molecular descriptors for each decorator encoding two-dimensional chemical structure information.25The workflow generated also included the EnalosMold2 KNIME node26 that calculates 777 descriptors per CNT-decorating molecule accounting for the topological, geometric and structural characteristics of the organic modifiers (see Fig. 1). An important step in the modelling procedure is the reduction of the original pool of descriptors before the feature selection, in order to increase the model quality.27 Thus, the descriptors containing the same values at a percentage equal or higher than 20% among the samples were excluded from further analysis using the Enalos+/Remove column node.
kNN/read-across model development
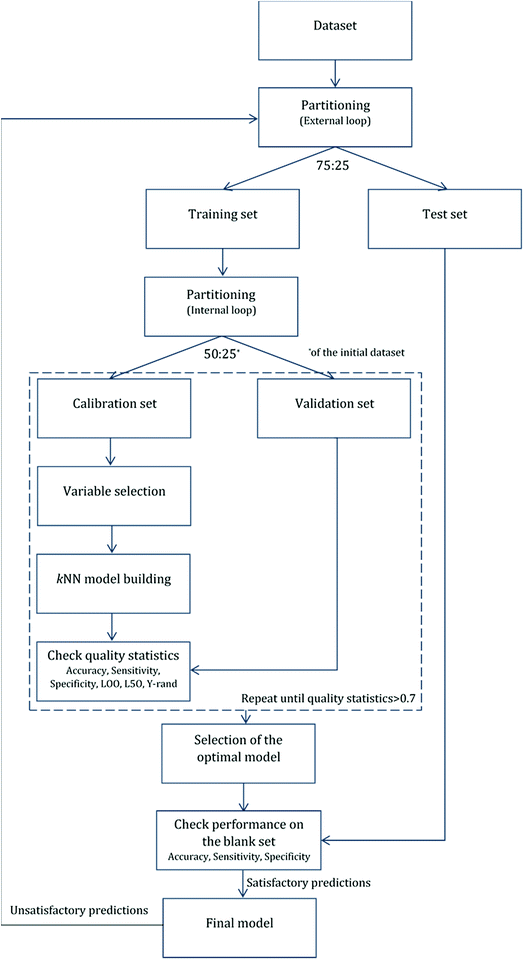
For validation purposes we followed the double cross-validation scheme28 as depicted in Fig. 2. For each model (protein attachment and cell viability) the full dataset was randomly divided into training and test sets in the proportion 75![[thin space (1/6-em)]](https://www.rsc.org/images/entities/char_2009.gif) :
:![[thin space (1/6-em)]](https://www.rsc.org/images/entities/char_2009.gif) 25. The decorators of the test set were excluded from the model training. As many of the molecular descriptors had considerably different numerical ranges, they were normalized prior to modelling.29 In the present work, Gaussian normalization was used on the calculated descriptors of the training set with mean values equal to 0 and standard deviation equal to 1. The normalization function used for the training set was later applied to the test set.
25. The decorators of the test set were excluded from the model training. As many of the molecular descriptors had considerably different numerical ranges, they were normalized prior to modelling.29 In the present work, Gaussian normalization was used on the calculated descriptors of the training set with mean values equal to 0 and standard deviation equal to 1. The normalization function used for the training set was later applied to the test set.
After the first (external) partition the training set was repeatedly divided into calibration and validation sets. The calibration set was used for variable selection and model development, whereas the validation set was used for the determination of the accuracy of the produced models. The multiple splits of the initial training set into two subsets removed any bias in descriptor selection that may be introduced by the use of only one training set of firm composition.
A variable selection method included in WEKA was used in order to remove noisy variables and to retain only the ones relevant to each endpoint. In both cases, the most significant descriptors were selected using the InfoGain variable selection (InfoGainAttributeEval) with Ranker evaluator.
InfoGainAttributeEval measured the attribute's information gain with respect to the current endpoint, whereas Ranker prioritized the variables and removed the lower-ranking ones.30 In this way the modelling computational time and space were reduced, and the predictive performance was greatly improved.
Consequently, we proceeded with model development with the aim to correlate the available endpoints to the selected molecular descriptors. The machine learning method that proved to best correlate the available data was the k-nearest neighbours (kNN) methodology. The kNN method belongs to the “lazy” (instance-based) learning techniques, that classify an instance based on the closest training examples (neighbours) in the feature space. Each instance is assigned to the class indicated by the weighted majority vote of the k closest neighbours.30 This prediction scheme places the kNN method among the read-across strategies, as it requires only a few neighbouring – in terms of similarity – decorators, in order to predict the MWCNT's endpoint class.31 Among the modelling parameters, an optimal k value has been selected, with Euclidean distance between the chosen descriptors and the inversed distance as the weighting factor for the majority vote.
The kNN method was employed in our workflow, using the EnaloskNN KNIME node.32 With this node, apart from the endpoint predictions, we were able to identify the groups of k neighbours of each test decorated CNT and later map the analogous area, as required by the read-across framework.33
 | (1) |
 | (2) |
 | (3) |
| Positive predicted | Negative predicted | |
|---|---|---|
| Positive observed | TP | FN |
| Negative observed | FP | TN |
The selected model was finally validated using the external test-blank set by calculating the same accuracy measurements (eqn (1)–(3)). The final model was considered satisfactory when the values of all the above statistics exceeded 0.7. In the case that the previous criterion was not satisfied, the external partitioning into training and test sets was repeated, as well as the internal partitioning and all the processes of model development and validation.
Moreover, the Y-randomization test was performed in the internal loop, in order to validate the robustness and the statistical significance of the produced models. In this test, all modelling calculations were repeated several times, using the original values of the independent variables, but also using randomly shuffled values for the dependent endpoint. The statistical metrics of the so-produced models were evaluated and were expected to be reduced in comparison to those of the initial model, thus demonstrating that the initial model was not the result of random chance. If this was not the case, both the applied methodology and the training set would not produce reliable predictive models.35 In addition to the previous validation practices, internal validation was performed in order to reduce the bias produced from a possible unbalanced representation of the two classes between the two subsets. Both for the calibration sets (inner loop) and the training set (external loop), leave-one-out (LOO) and leave-five-out (L5O) cross-validation methods were employed for both models (protein binding and cell viability).
| APD = 〈d〉 + Zσ | (4) |
Results and discussion
In this work, we have addressed the need for development of reliable predictive models for the biological evaluation and toxicity assessment of MWCNTs. All preprocessing and modelling activities, including the calculation of molecular descriptors, were performed within the freely-available KNIME platform, using the available nodes and the Enalos proprietary KNIME nodes developed by NovaMechanics Ltd.For the development of our model, the dataset of 83 MWCNTs with the same core and different organic surface ligands (decorators), tested in vitro for carbonic anhydrase (CA) binding and acute toxicity (% cell viability), as described above, has been used.13,17 Two QNAR models were built to classify samples as “binders” and “non-binders” as well as “toxic” and “non-toxic” to assess their CA binding and toxicity.
Since the surface modification differentiated the MWCNTs, we transformed their structural, topological and geometrical characteristics into numerical values, using Mold2 descriptors.25 EnalosMold2 KNIME node was used to calculate 777 molecular descriptors for each decorator that were then reduced to 403 descriptors for QNAR development after filtering out descriptors that contained the same values at percentage equal or higher than 20%.
For the development of each model, the dataset of decorators was randomly divided into training and test sets in a ratio of 75![[thin space (1/6-em)]](https://www.rsc.org/images/entities/char_2009.gif) :
:![[thin space (1/6-em)]](https://www.rsc.org/images/entities/char_2009.gif) 25. The descriptor values of the training set were normalized, and the applied normalization parameters were used for the normalization of the test set during external validation. The training set was further divided into calibration and validation sets in a proportion that ensured that the calibration set contained 50% of the samples of the initial dataset (75% of the training set). The variable selection and model building processes followed, and the produced model performances were tested using the corresponding validation set. The processes of partitioning and model development were repeated until a satisfactory model was built (inner loop).
25. The descriptor values of the training set were normalized, and the applied normalization parameters were used for the normalization of the test set during external validation. The training set was further divided into calibration and validation sets in a proportion that ensured that the calibration set contained 50% of the samples of the initial dataset (75% of the training set). The variable selection and model building processes followed, and the produced model performances were tested using the corresponding validation set. The processes of partitioning and model development were repeated until a satisfactory model was built (inner loop).
The InfoGain variable selection with Ranker evaluator method (which are included in the WEKA platform), were applied to the calibration data, to select the most critical, among the 403 available descriptors. From the ranked descriptors, six emerged as important for predicting the CA binding endpoint and six descriptors have been selected as the most relevant to predicting the toxicity endpoint, as well.37
The proposed KNIME workflow gave us the flexibility to test the performance of different modelling methodologies and finally select the best performing combination. Among the applied methodologies, the k-nearest neighbours (kNN) appeared to outperform the others, providing the best correlation between the selected descriptors and the endpoints. The kNN method was applied to the calibration data with an optimized value for the number of neighbours equal to 3 for the CA binding model and, equal to 7 for the toxicity model. After model development based on the calibration data, binding and toxicity predictions for the validation set of decorated MWCNTs were performed. In order to test the accuracy of the developed models, several statistical measurements were calculated, as described in the Materials and methods section, consistent with the OECD proposed tests. Table 2 presents the accuracy statistics of the models for validation sets (internal loop). The Y-randomization robustness test when applied, proved the statistical significance of the proposed models. Random shuffles of the endpoints were performed while the descriptor matrix of the calibration set remained intact. Predictions using the validation set demonstrated that the resulting models (same parameters as the proposed ones) presented statistically lower predictive power (0.40–0.55 for the CA binding and 0.33–0.53 for the toxicity model) in comparison to the models using the original training values, thus the possibility of chance correlation was eliminated.
| Model | Set | Accuracy | Sensitivity | Specificity |
|---|---|---|---|---|
| CA binding | Validation | 0.750 | 0.778 | 0.727 |
| Test | 0.857 | 0.727 | 1.000 | |
| Toxicity | Validation | 0.778 | 0.778 | 0.778 |
| Test | 0.842 | 0.875 | 0.818 |
After the selection of the optimal model from the inner loop, predictions were performed using the test set of the external loop, in order to assess their actual performance in a blank dataset. The accuracy statistics using the test sets are also presented in Table 2.
As far as internal validation is concerned, the models' stability to the inclusion–exclusion of data was tested by performing L0O and L5O cross-validation, in the training sets. The accuracy values of cross-validation for both models are presented in Table 3 and are higher than 0.7 thus, both models can be considered stable.
| CA binding | Toxicity | |
|---|---|---|
| L0O | 0.810 | 0.750 |
| L5O | 0.833 | 0.722 |
Finally, the domain of applicability (APD) has been determined in order to define the area of reliable predictions. The APD threshold was calculated, according to the training set, to be 2.166 for the CA binding model. All samples in the test set had values in the range of 0.219–2.297. Similarly, for the toxicity model, the APD threshold was calculated equal to 1.805 and the decorators in the test set had values in the range of 0.25–2.305. Therefore, in both cases, the prediction for the samples that exceeded the APD threshold was considered unreliable.
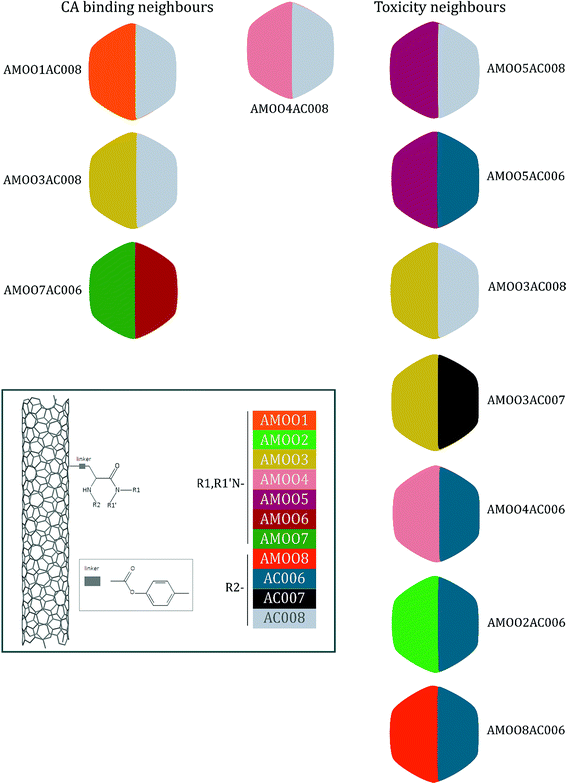
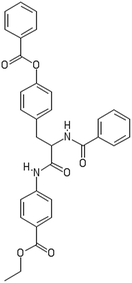
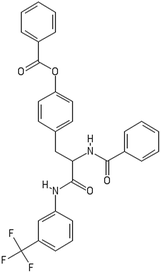
A representative case of the read-across process is presented below using the sample AMOO4AC008 which belongs to both test sets for CA binding and toxicity. In Fig. 3, the 3 CA binding and the 7 toxicity neighbours are presented and their structural similarity in terms of common substituents is depicted using a color code. In Table 4 the neighbours, along with their distance from the AMOO4AC008 sample, are presented.
| Sample | AMOO4AC008 |
| Experimental | Non-binder/toxic |
| Prediction | Non-binder/toxic |
| CA binding | Toxicity | ||||
|---|---|---|---|---|---|
| Neighbours | Distance | Neighbours | Distance | ||
| AMOO1AC008 | 0.1793 | Non-binder | AMOO5AC008 | 0.0420 | Toxic |
| AMOO3AC008 | 0.2212 | Non-binder | AMOO5AC006 | 0.0704 | Toxic |
| AMOO7AC006 | 0.3317 | Non-binder | AMOO3AC008 | 0.0733 | Toxic |
| AMOO3AC007 | 0.0909 | Non-toxic | |||
| AMOO4AC006 | 0.0928 | Toxic | |||
| AMOO2AC006 | 0.1158 | Toxic | |||
| AMOO8AC006 | 0.1185 | Toxic | |||
Discussion on selected descriptors
Most of the selected descriptors, as presented in Table 5, are derived from the structural graph representation of the molecules and quantify their molecular topology.38 Geary coefficients are topochemical indices that encode spatial autocorrelation, a function of spatial separation that measures the strength of the relationship between atoms. Burdex eigenvalues, that belong to the class of Burden eigenvalue descriptors,39 have emerged as significant variables for model development. Burden eigenvalues are topochemical indices, which reflect both the topology of the whole molecule and the chemical properties of atoms such as their chemical identity or their hybridization state. Mohar indices are topostructural indices, which encode useful information about the adjacency and distances between atoms within the molecular structure. In addition, Vertex distance counts, which express the distance degree between the atoms of a molecule (e.g. the order of their neighbours), were identified. The majority of the aforementioned descriptors belong to the family of molecular topological indices, including among others, the structure of the molecules and the distances between atoms.38 More details about the descriptor calculations can be found in the provided ESI.† Here, we focus on the descriptors with the highest ranking during the variable selection process. Descriptors related to the topological charge index express the charge transfer between pairs of atoms and consequently the overall transfer of charge in the molecule. The Geary topological structure autocorrelation descriptors, embedded with a physicochemical property as a weighting factor (such as the Sanderson electronegativities or the atomic polarizabilities) also emerged as important ones for modelling during variable selection. Considering that the molecules in question are the MWCNTs decorators and the surface area of the decorator is also their “contact area” with the biological environment, the surface electrostatic status influences the MWCNT behavior in the exposed environment. For example, it is reported in the literature40,41 that electrostatic interactions directly induce the adsorption of proteins onto NMs, thus surface charge of the MWCNTs, which is conferred by the decorating ligands, is an important factor, greatly related to the CA binding endpoint. Surface charge is also an important parameter for the cytotoxicity endpoint, given that it contributes to the cellular uptake of NMs.42,43 Beyond the molecular scale of these descriptors, the electrostatic status of the NMs is expressed by their surface charge or their zeta-potential.| CA binding | Toxicity | ||
|---|---|---|---|
| D522 | Mean molecular topological order-2 charge index | D468 | Geary topological structure autocorrelation length-6 weighted by atomic Sanderson electronegativities |
| D473 | Geary topological structure autocorrelation length-3 weighted by atomic polarizabilities | D173 | Mohar order-2 index |
| D472 | Geary topological structure autocorrelation length-2 weighted by atomic polarizabilities | D454 | Geary topological structure autocorrelation length-8 weighted by atomic masses |
| D269 | Information content order-0 index | D254 | Radial centric index |
| D133 | Mean value of atomic composition index | D250 | EXP5 of path-distance/walk-distance over all atoms |
| D541 | Lowest eigenvalue from Burdex matrix weighted by van der Waals order-2 | D255 | Vertex distance count equality index |
Virtual screening
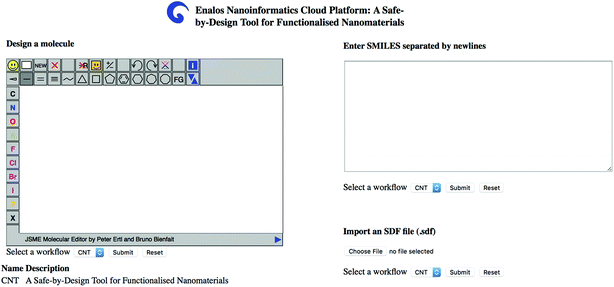
The user can insert one or several structures of compounds being considered as potential decorating molecules for MWCNTs and get, within seconds, the prediction of the CA binding and their toxicity profile, along with a warning on the reliability of the predictions based on the models' domain of applicability limits. The user has three different options for providing the structures of the compounds to be screened: (i) by drawing the chemical structure of interest, (ii) by entering the SMILES notation of the compounds in the appropriate field or (iii) by uploading an .sdf file with a batch of compounds (Fig. 4). During a safe-by-design process, different data sets with decorators of interest can be imported, and their effects on the biological and toxicological behaviour of the resulting decorated MWCNTs can be studied.
The developed models can be used under a virtual screening framework for the development of novel, plus safe, decorated MWCNTs. As an initial case study, we tried to improve the profiles of MWCNT samples identified in the initial dataset as having unsatisfactory toxicity and high protein binding properties (toxic and a CA binder sample). We have to underline at this point that, depending on the nature of the specific proteins that bind, protein binding can increase a NM's engagement with specific cellular receptors thus enhancing uptake, or can increase or reduce the susceptibility to phagocytosis (depending on whether the corona presents opsonising or disopsonising proteins) or can create cryptic epitopes in cellular signaling proteins causing toxic responses.17,44 As a second case study we performed a sensitivity analysis in order to explore the toxicity and the protein binding limits of the samples, by inserting, deleting or modifying substituents at different positions of the decorators. These safe-by-design case studies are presented below.
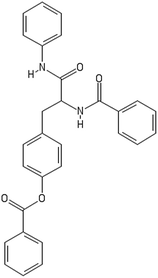
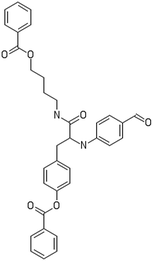
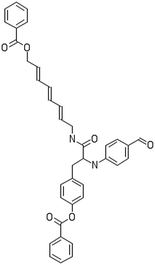
After filtering the duplicate generated substituent SMILES, we created a list of 942 candidate surface modifiers by combining the different substituents in positions R1 and R2 with the core molecule. We uploaded an .sdf file including these structures to the web-service, and within seconds we acquired the predictions for their CA binding and toxicity profiles, as well as the reliability of these predictions according to the APD limits. According to our initial plan we were only interested in MWCNTs with reduced toxicity and low protein binding, thus from the generated predictions we focused only on non-toxic and CA non-binder results. From these, we excluded the samples with unreliable outcomes and 32 MWCNT samples with desired properties remained. In a final step we checked if the valence on the atoms of the structure is correct in KNIME, using the Valence Checker node. The valence was correct for the structures, therefore they can be considered feasible. Three candidate surface decorators are presented in Table 6.
Conclusions
A fully validated workflow for prediction of the binding of a representative protein, carbonic anhydrase (CA), to organic molecule functionalised MWCNTs and for prediction of the toxicity of the functionalised MWCNTs has been developed and was disseminated as a user-friendly web service through the Enalos Cloud platform. The present study was based on the open-source KNIME platform, combining KNIME and Enalos+ nodes,32,46 which facilitate the manipulation of big data, the modelling, the validation and the virtual screening processes.The predictive power of the proposed models is improved in terms of sensitivity and specificity, especially in the case of the toxicity endpoint, compared to the models developed by Fourches et al.13 and Singh et al.19 Shao et al.12 and Esposito et al.18 reported high accuracy statistics, nevertheless, their findings are not directly comparable with the results reported here, as they considered a decreased dataset focused only on the most toxic 29 MWCNTs.
The main advantages of the models presented here compared to other relevant models proposed in the literature,12,13,19 are: the immediate release and dissemination of the models to all interested parties through the user-friendly interface of the Enalos Cloud platform, the important new insights into the significant molecular descriptors and the determination of the domain of applicability of the model allowing for the discrimination between reliable and unreliable predictions. The web service is publicly available and ready-to-use by any interested user (e.g., experimentalists or regulators) in the computer-aided design of novel MWCNTs or in the prioritization of novel potent MWCNTs based on their predicted toxic effects, taking into account that predictions can be produced rapidly (about 30 seconds) along with an indication of their reliability. Thus, it represents a useful tool within a safety-by-design framework and can contribute to the reduction of in vivo experiments and their replacement by in vitro and in due course only in silico experiments. Finally, the dissemination of the models facilitates their utility as they are easily expandable and adjustable to address the requirements of other NMs, other decorating molecules or other toxicity end-points, provided sufficient experimental data is available to train the extended models.
While it was not possible based on the current dataset to link the binding and toxicity QNARs, since the uptake studies were performed in serum-containing medium rather than on the single protein-bound MWCNTs (i.e. CA-MWCNT complexes) it is clear that as suitable datasets become available where protein binding and toxicity are performed under the same conditions, a linked model, that can determine whether high protein binding correlates with high or low toxicity, would be possible. Indeed, reduction of protein binding via surface decoration of NMs with PEG or other hydrophilic polymers has been suggested as a route to reducing their recognition and phagocytosis as a “stealth” strategy for nanomedicines.47,48 Conversely, corona thickness as driven by use of different media supplemented with 10% foetal bovine serum was shown to affect cellular uptake and toxicity for gold NMs: while DMEM elicited the formation of a large time-dependent protein corona, RPMI showed different dynamics with reduced protein coating which correlated with more abundant internalized by two cell lines (HeLa and U937) cells and higher cytotoxic effects as compared to DMEM.49 Similarly, models predicting which proteins in the NM corona drive cellular association have been developed,14,50 so the ultimate QNAR will link protein binding amount, presence of specific proteins linked to cellular adhesion and uptake, and the toxicity effects, thus enabling safe-by-design based on several critical aspects that must be controlled for drug delivery and for safe utilization of NMs broadly.
Conflicts of interest
None.Acknowledgements
This work was funded by the European Commission's H2020 Marie-Sklodowska-Curie-Action via the NANOGENTOOLS RISE project which aims to support the development of new methodologies for the identification and control of hazards associated with nanomaterials, ensuring consumer and society safety (H2020-MSCA-RISE-2015) under grant agreement no. 691095. Partial funding from EU H2020 research infrastructure NanoCommons (grant agreement no. 731032). D.-D. V. acknowledges funding from the Onassis Foundation and the A. G. Leventis Foundation.Notes and references
- Q. Zhang, Z. Wu, N. Li, Y. Pu, B. Wang, T. Zhang and J. Tao, Mater. Sci. Eng., C, 2017, 77, 1363–1375 CrossRef CAS PubMed.
- A. Gajewicz, B. Rasulev, T. C. Dinadayalane, P. Urbaszek, T. Puzyn, D. Leszczynska and J. Leszczynski, Adv. Drug Delivery Rev., 2012, 64, 1663–1693 CrossRef CAS PubMed.
- Y. Zhang, Y. Bai and B. Yan, Drug Discovery Today, 2010, 15, 428–435 CrossRef CAS PubMed.
- V. Georgakilas, J. A. Perman, J. Tucek and R. Zboril, Chem. Rev., 2015, 115, 4744–4822 CrossRef CAS PubMed.
- K. A. Jensen, J. Bøgelund, P. Jackson, N. R. Jacobsen, R. Birkedal, P. A. Clausen, A. T. Saber, H. Wallin and U. B. Vogel, Carbon Nanotubes-Types, products, market, and provisional assessment of the associated risks to man and the environment, Copenhagen, 2015 Search PubMed.
- D. A. Winkler, E. Mombelli, A. Pietroiusti, L. Tran, A. Worth, B. Fadeel and M. J. Mccall, Toxicology, 2013, 313, 15–23 CrossRef CAS PubMed.
- A. R. Murray, E. Kisin, A. Inman, S. H. Young, M. Muhammed, T. Burks, A. Uheida, A. Tkach, M. Waltz, V. Castranova, B. Fadeel, V. E. Kagan, J. E. Riviere, N. Monteiro-Riviere and A. A. Shvedova, Cell Biochem. Biophys., 2013, 67, 461–476 CrossRef CAS PubMed.
- Y. Robert and R. MacPhail, J. Occup. Med. Toxicol., 2011, 6(7), 1–27 Search PubMed.
- G. Melagraki and A. Afantitis, RSC Adv., 2014, 4, 50713–50725 RSC.
- J. R. C. European Commission, Ihcp/2011/I/05/27/Oc.
- G. Melagraki and A. Afantitis, Curr. Top. Med. Chem., 2015, 15, 1827–1836 CrossRef CAS PubMed.
- C. Y. Shao, S. Z. Chen, B. H. Su, Y. J. Tseng, E. X. Esposito and A. J. Hopfinger, J. Chem. Inf. Model., 2013, 53, 142–158 CrossRef CAS PubMed.
- D. Fourches, D. Pu, L. Li, H. Zhou, Q. Mu, G. Su, B. Yan and A. Tropsha, Nanotoxicology, 2016, 10, 374–383 CrossRef CAS PubMed.
- A. Afantitis, G. Melagraki, A. Tsoumanis, E. Valsami-Jones and I. Lynch, Nanotoxicology, 2018, 1–18 CrossRef PubMed.
- eNanoMapper prototype database, https://data.enanomapper.net/, (accessed 16 April 2018) Search PubMed.
- NanoMILE, http://nanomile.eu-vri.eu/, (accessed 23 January 2018) Search PubMed.
- H. Zhou, Q. Mu, N. Gao, A. Liu, Y. Xing, S. Gao, Q. Zhang, G. Qu, Y. Chen, G. Liu, B. Zhang and B. Yan, Nano Lett., 2008, 8, 859–865 CrossRef CAS PubMed.
- E. X. Esposito, A. J. Hopfinger, C. Y. Shao, B. H. Su, S. Z. Chen and Y. J. Tseng, Toxicol. Appl. Pharmacol., 2015, 288, 52–62 CrossRef CAS PubMed.
- K. P. Singh and S. Gupta, RSC Adv., 2014, 4, 13215–13230 RSC.
- D. Fourches, D. Pu, C. Tassa, R. Weissleder, S. Y. Shaw, R. J. Mumper and A. Tropsha, ACS Nano, 2010, 4, 5703–5712 CrossRef CAS PubMed.
- Y. T. Chau and C. W. Yap, RSC Adv., 2012, 2, 8489–8496 RSC.
- A. A. Toropov, A. P. Toropova, T. Puzyn, E. Benfenati, G. Gini, D. Leszczynska and J. Leszczynski, Chemosphere, 2013, 92, 31–37 CrossRef CAS PubMed.
- S. Kar, A. Gajewicz, T. Puzyn and K. Roy, Toxicol. In Vitro, 2014, 28, 600–606 CrossRef CAS PubMed.
- A. Assarsson, I. Pastoriza-Santos and C. Cabaleiro-Lago, Langmuir, 2014, 30, 9448–9456 CrossRef CAS PubMed.
- H. Hong, Q. Xie, W. Ge, F. Qian, H. Fang, L. Shi, Z. Su, R. Perkins and W. Tong, J. Chem. Inf. Model., 2008, 48, 1337–1344 CrossRef CAS PubMed.
- G. Melagraki and A. Afantitis, Chemom. Intell. Lab. Syst., 2013, 123, 9–14 CrossRef CAS.
- P. K. Ojha and K. Roy, Chemom. Intell. Lab. Syst., 2011, 109, 146–161 CrossRef CAS.
- K. Roy and P. Ambure, The “double cross-validation” software tool for MLR QSAR model development, Elsevier, 2016, vol. 159 Search PubMed.
- A. R. Leach and V. J. Gillet, An introduction to chemoinformatics, 2007 Search PubMed.
- I. H. Witten, E. Frank and M. a. Hall, Data Mining Practical Machine Learning Tools and Techniques, 3rd edn, 2011, vol. 277 Search PubMed.
- R. Huluban, Practical guide How to use and report (Q)SARs Practical Guide – How to use and report (Q)SARs, 2016 Search PubMed.
- NovaMechanics Ltd, Enalos+ KNIME nodes, http://enalosplus.novamechanics.com/, (accessed 24 January 2018) Search PubMed.
- ECHA, Read-Across Assessment Framework (RAAF), 2017 Search PubMed.
- OECD, Validation of (Q)SAR Models, http://www.oecd.org/env/ehs/risk-assessment/validationofqsarmodels.htm, (accessed 27 March 2018) Search PubMed.
- A. Tropsha, P. Gramatica and V. K. Gombar, QSAR Comb. Sci., 2003, 22, 69–77 CrossRef CAS.
- S. Zhang, A. Golbraikh, S. Oloff, H. Kohn and A. Tropsha, J. Chem. Inf. Model., 2006, 46, 1984–1995 CrossRef CAS PubMed.
- U.S. Food and Drug Administration, Mold2 Software Introduction Search PubMed.
- R. Todeschini and V. Consonni, Molecular Descriptors for Chemoinformatics, 2010, vol. 2 Search PubMed.
- M. Hao, Y. Li, Y. Wang and S. Zhang, Int. J. Mol. Sci., 2010, 11, 3413–3433 CrossRef CAS PubMed.
- T. Arai and W. Norde, Colloids Surf., 1990, 51, 1–15 CrossRef CAS.
- Z. G. Peng, K. Hidajat and M. S. Uddin, J. Colloid Interface Sci., 2005, 281, 11–17 CrossRef CAS PubMed.
- C. He, Y. Hu, L. Yin, C. Tang and C. Yin, Biomaterials, 2010, 31, 3657–3666 CrossRef CAS PubMed.
- M. K. Ha, T. X. Trinh, J. S. Choi, D. Maulina, H. G. Byun and T. H. Yoon, Sci. Rep., 2018, 8, 1–11 CrossRef CAS PubMed.
- I. Lynch, K. A. Dawson and S. Linse, Sci. STKE, 2006, 2006, 1–7 Search PubMed.
- S. Kim, P. A. Thiessen, E. E. Bolton, J. Chen, G. Fu, A. Gindulyte, L. Han, J. He, S. He, B. A. Shoemaker, J. Wang, B. Yu, J. Zhang and S. H. Bryant, Nucleic Acids Res., 2016, 44, D1202–D1213 CrossRef CAS PubMed.
- D.-D. Varsou, S. Nikolakopoulos, A. Tsoumanis, G. Melagraki and A. Afantitis, ENALOS+ KNIME nodes: new cheminformatics tools for drug discovery, Methods Mol. Biol., 2018, 1824, 113–138 CrossRef PubMed.
- C. Sacchetti, K. Motamedchaboki, A. Magrini, G. Palmieri, M. Mattei, S. Bernardini, N. Rosato, N. Bottini and M. Bottini, ACS Nano, 2013, 7, 1974–1989 CrossRef CAS PubMed.
- S. Schöttler, G. Becker, S. Winzen, T. Steinbach, K. Mohr, K. Landfester, V. Mailänder and F. R. Wurm, Nat. Nanotechnol., 2016, 11, 372–377 CrossRef PubMed.
- G. Maiorano, S. Sabella, B. Sorce, V. Brunetti, M. A. Malvindi, R. Cingolani and P. P. Pompa, ACS Nano, 2010, 4, 622–627 CrossRef PubMed.
- C. D. Walkey and W. C. W. Chan, Chem. Soc. Rev., 2012, 41, 2780–2799 RSC.
Footnote |
| † Electronic supplementary information (ESI) available. See DOI: 10.1039/c8na00142a |
| This journal is © The Royal Society of Chemistry 2019 |

![[double bond, length as m-dash]](https://www.rsc.org/images/entities/b_char_e001.gif) CC(
CC(![[double bond, length as m-dash]](https://www.rsc.org/images/entities/char_e001.gif) CC(
CC(