 Open Access Article
Creative Commons Attribution 3.0 Unported Licence
Temperature-dependent yield stress and wall slip behaviour of thermoresponsive Pluronic F127 hydrogels†
Surya Narayana Sangitra and
Ravi Kumar Pujala *
*
Soft and Active Matter Group, Department of Physics and Center for Atomic, Molecular and Optical Sciences & Technologies (CAMOST), Indian Institute of Science Education and Research (IISER) Tirupati, Yerpedu, Tirupati 517619, Andhra Pradesh, India. E-mail: pujalaravikumar@iisertirupati.ac.in
First published on 29th July 2024
Abstract
This study explores the temperature-dependent dynamic yield stress of a triblock thermoresponsive polymer, Pluronic F127, with chemical structure (PEO)100(PPO)65(PEO)100, during the sol–gel transition. The yield stress can be defined as static, dynamic, or elastic, depending on the experimental protocol. We examine the dynamic yield stress estimation for this study, which usually entails utilizing non-Newtonian models like the Herschel–Bulkley (HB) or Bingham models to extrapolate the flow curve (shear rate against shear stress). Initially, we determine the yield stress using the HB model. However, apparent wall slip makes it difficult to calculate yield stress using conventional methods, which could lead to underestimates. To validate the existence of apparent wall slip in our trials, we carry out meticulous experiments in a range of rheometric geometries. To determine the true yield stress corrected for slip, we first use the traditional Mooney method, which requires labor-intensive steps and large sample sizes over various gaps in the parallel plate (PP) design. To overcome these drawbacks, we use a different strategy. We modify the Windhab model equation by adding slip boundary conditions to the HB equation, which allowed us to calculate the slip yield stress in addition to the true yield stress. In contrast to other typical thermoresponsive polymers like poly(N-isopropyl acrylamide) (PNIPAM), our findings demonstrate that PF127's yield stress obeys the Boltzmann equation and increases with temperature.
Introduction
Hydrogels have become a highly adaptable material with a wide range of uses in many different domains, such as biomedical engineering, tissue engineering, and drug delivery.1 Because of their exceptional capacity to experience sol–gel transitions in response to temperature fluctuations, thermoresponsive hydrogels have been used in biomedical applications for over two to three decades.2,3 Poloxamers are the second most commonly used thermoresponsive polymer after poly(N-isopropyl acrylamide) (PNIPAM). Poloxamers are typically non-ionic tri-block copolymers in the form of PEO–PPO–PEO based on a hydrophilic block of poly(ethylene oxide) (PEO) and hydrophobic block of poly(propylene oxide) (PPO).3 Commercially, poloxamers are also known as Pluronics. Based on molecular weight and physical state of Pluronic, it is available in different forms such as L31, P104, P85, F127, etc., where the first letters L, P, and F represent the physical form commercially available at room temperature as liquid, paste and flaked solid, respectively and numbers represents the PPO molecular mass and PEO content.4 F127 has been used for various biomedical applications because its sol-to-gel transition temperature is close to body temperature, and its rheological properties play an essential role in different biomedical and drug delivery applications.5Hydrogels are intricate materials that exhibit neither simple liquid nor perfectly elastic solid behavior. They exhibit viscoelastic behavior with both elastic and viscous components and have mechanical behavior that differs from that of solids and liquids. As the lowest stress necessary for the material to flow, the yield stress is a critical parameter in describing the mechanical behavior of hydrogels. Since it controls hydrogel-based systems' injectability, stability, and flow characteristics, yield stress is crucial in these applications.6–8
Different methods have been proposed to determine the yield stress. The yield stress can be defined as static, dynamic, or elastic, depending on the experimental protocol.9,10 The static and elastic yield stress can be found directly from creep and oscillatory shear experiments, respectively, while dynamic yield stress can be calculated by extrapolating the flow curve (shear rate versus shear stress) by fitting with non-Newtonian models such as Bingham or HB model, etc. Minimum stress at which, if one can wait sufficient time, the sample reaches a final steady state with constant viscosity is defined as static yield stress, and above static yield stress, the sample shows viscosity bifurcation. The creep rheology test can find this phenomenon. Similarly, the elastic yield stress can be calculated from oscillatory amplitude sweep measurements by measuring the deviation from linearity, where plastic deformation begins and the sample no longer fully recovers. The dynamic yield stress calculated from flow curves measures the minimum stress needed to maintain flow.10
Here, we aim to investigate the temperature-dependent dynamic yield stress of PF127 during the sol–gel transition. Surprisingly, the traditional method of calculating dynamic yield stress by fitting the HB model for the whole range of data could not help us with different temperatures. Following a comprehensive review of the literature, we found that apparent wall slip can underestimate true yield stress values and is one of the difficulties in computing the dynamic yield stress.11 Therefore, accurately determining the yield stress of hydrogels is crucial for optimizing their performance and understanding their rheological behavior.12 The following describes the origin and history of the apparent wall slip.
The rheological characterization of complex materials, such as colloidal gels or soft microgels and others, changes when bounded on smooth surfaces compared to rough or serrated surfaces due to wall effects.13 The effects of walls in complex fluids are often interpreted as apparent wall slip. Wall slip can be well understood from a typical example when a solid block is kept between two parallel plates with smooth polished surfaces, one of which is in motion, and it is due to inadequate friction present on the smooth surface.14 Similar situations can also arise in various complex fluids when they exhibit solid-like behavior under external conditions like time, temperature, shear rate, etc. For example, some complex materials behave like liquids at a low shear rate and exhibit solid-like behavior at a higher shear rate.14 In some cases, solid-like behavior is observed after a specific time, keeping the temperature and other parameters constant.10
For most complex materials, apparent slips in dispersion flow are described by forming a thin depletion layer (nm to μm) close to the bounded wall.11–13,15–21 The layer may consist of pure solvent or deficient particle concentrations compared to the bulk dispersion. The literature shows a high-velocity gradient near the wall due to an apparent slip. The velocity profile in between the rheometric plate gap can be directly measured by several advanced techniques combined with conventional rheometers such as particle image velocimetry (PIV),22 nuclear magnetic resonance (NMR) velocimetry,23 ultrasonic speckle velocimetry (USV)24 and dynamic light scattering (DLS), etc.25 One can also indirectly observe the wall slip from flow curves (shear rate versus shear stress).13 Over the years, a large number of studies have investigated wall slip in complex fluids in the literature. While it is difficult to include them all in Table 1, we have documented a few of them. Nevertheless, several important review papers give a historical perspective and describe the advancements made in understanding and dealing with wall slip so that the yield stress may be accurately calculated.10,15–18,20,21,25–29,37–40
| Publication | Summary | Characteristic quantities | Advantages | Disadvantages |
|---|---|---|---|---|
| Mooney (1931)30 | Indirect quantification of wall slip for rotational and capillary viscometry | Slip velocity profiles, shear rate dependencies | Established foundational concepts | Requires three different sets of measurements, time-consuming and requires precise instrumentation |
| Yoshimura et al. (1988)31 | Wall-slip corrections for Couette cylinders and parallel disk viscometers | Correction factors, experimental validations | Improved measurement accuracy | Specific to certain geometries |
| Yilmazer et al. (1989)32 | Improved wall-slip corrections using four sets of gaps between parallel plates | Gap size dependencies, empirical data | Enhanced reliability | Requires multiple gap sizes |
| Hatzikiriakos et al. (1992)33–35 | Study of wall-slip of molten high-density polyethylene (HDPE) using capillary and sliding plate rheometer | Slip coefficient values, temperature effects | Comprehensive polymer data | Complex experimental setup |
| Aral et al. (1994)36 | Effect of surface roughness and temperature on the transient behavior of wall slip in concentrated suspensions | Roughness parameters, transient slip data | Detailed surface interactions | Limited to specific suspensions at high concentration |
| Rosenbaum et al. (1997)37 | Effect of viscous heating on high shear rheological measurements using various polymers | Temperature profiles, shear heating effects | Applicable to high-shear processes | Requires thermal control |
| Bertola et al. (2003)23 | Generalized method with seven different plate gaps, validated with magnetic resonance imaging (MRI) in pasty materials | MRI imaging data, multi-gap analysis | High-resolution slip data | Requires multiple measurements and time-consuming |
| Meeker et al. (2008)38,39 | Proposal of a mechanism using micro-elastohydrodynamic lubrication theory for slip and flow in soft particle pastes | Lubrication theory, stress–strain curves | Theoretical and fundamental insights for soft particle system | Valid for soft particle system and does not include role of short-range force in the theory |
| Seth et al. (2008)40 | This work investigate the role of short range forces on wall slip behaviour of microgel paste | Role of short-range forces on wall slip behaviour | This study expands on the elastohydrodynamic slip model developed by Meeker and colleagues by including attractive or repulsive forces between the slipping paste particles and the wall | Valid for soft particle systems and need validation for hard colloidal particle system |
| Manneville et al. (2008)24 | Discussion on wall slip and flow instability of Pluronic P84 in brine solutions | Instability maps, slip transition points | Detailed instability analysis | Specific to Pluronic P84 |
| Wang et al. (2010)41 | Study on homogeneous shear, wall slip, and shear banding of entangled polymeric liquids in simple-shear rheometry | Shear banding profiles, stress distributions | Detailed shear banding analysis | Limited to entangled polymeric liquids |
| Ballesta et al. (2013)42 | Investigation of slip behavior in colloidal gels formed under polymer-induced depletion attraction, including time-dependent rheology | Time-dependent slip data, gel behavior | Time-resolved analysis and valid for hard sphere colloidal system | Limited to specific colloidal gels |
| Divoux et al. (2015)43 | Study on wall slip across the jamming transition of soft thermoresponsive particles | Jamming transition data, stress–strain analysis | Comprehensive particle behavior | Requires controlled conditions |
| Chatzigiannakis et al. (2017)44 | Study on wall slip of polyisobutylenes and its relationship with molecular characteristics | Molecular interaction data, slip velocities | Detailed molecular insights | Specific to polyisobutylenes |
| Chin et al. (2019)45 | Development of a rheological wall slip velocity prediction model based on artificial neural network | Artificial neural network (ANN) model predictions, validation data | Predictive modeling and time efficiency | Requires ANN expertise and experimental verification for different system |
| Georgiou (2021)46 | Analysis of simple shear flow of Herschel–Bulkley fluids with wall slip above a threshold stress | Slip threshold data, HB fluid behavior | Theoretical framework | Needs experimental support (only discussed about parallel plate geometry) |
| Moud et al. (2021)47 | Characterization of wall slip in colloidal suspensions of kaolinites | Slip characterization data, suspension behavior | Detailed suspension analysis and new slip model | Limited to kaolinites clays |
| Moud et al. (2022)48 | Study on apparent slip in colloidal suspensions | Apparent slip profiles, rheological data | Comprehensive slip analysis | Temperature dependency not discussed |
| Our work | Characterize the temperature-dependent yield stress and wall slip behavior of Pluronic F127 | Yield stress values, fitting the steady state flow curve using a non-Newtonian model | Simple and easy method to calculate the true dynamic yield stress for any soft material | — |
However, we were inspired by recent work by Moud et al., which evaluated apparent slip in the colloidal suspensions of kaolinite clay and proposed a generalized slip model that can be applied to many other colloidal systems.47 This paper has not discussed the temperature-dependent behavior of thermoresponsive materials. However, Aral and Kalyon studied the time and temperature-dependent behavior of poly(butadiene–acrylonitrile–acrylic) acid terpolymers and found that the temperature-dependent yield stress decreases with increasing temperatures.36 Jalaal et al. performed a systematic study to understand the rheological phase behavior of PF127 by analyzing the flow curves at different temperatures and found that the yield stress increases as an increasing function of temperature.49 They used sandblasted parallel plates to avoid the wall-slip effect and calculated the yield stress by fitting with the Herschel–Bulkley (HB) model.49 But they calculated the yield stress for PF127 for different concentrations at 5 °C intervals, and from their experiments, it was shown that for thermo-responsive hydrogels like PF127, with short intervals such as 1 °C is crucial. Therefore, we investigate the temperature-dependent yield stress of PF127 gels with 1 °C during the sol–gel transition. Careful observation confirms the presence of apparent slip during the experiments.
Traditionally, there are three approaches to deal with the apparent slip while calculating the yield stress; first, the slip can be avoided by using surface modification or serrated plate or alternative geometries like vane-in-cup and helix to avoid the slip. Unfortunately, we could not avoid the slip from experiments due to experimental limitations. The second approach to calculate the true yield stress is by using Mooney's calculation. We have extensively calculated the true yield stress following Mooney's method. The third approach is to use a suitable model or theory that can include the slip and calculate the true yield stress. In this article, we modified the HB model by including the slip boundary condition and were able to calculate the true yield stress at different temperatures. Finally, we plot the dynamic yield stress as a function of temperature that was obtained using three different methods (the HB model, Mooney's plot, and our approach) and found that the yield stress of PF127 increases as a function of temperature and follows Boltzmann's equation for sigmoid curves. We also compare the yield stress of PF127 with other thermoresponsive materials such as poly(N-isopropyl acrylamide) (PNIPAM) and compare the results with PF127.
Materials and methods
Materials
We used Pluronic F127 ((PEO)100(PPO)65(PEO)100) with an average molecular weight (∼12![[thin space (1/6-em)]](https://www.rsc.org/images/entities/char_2009.gif) 600 g mol−1) (Sigma-Aldrich) without further chemical modifications. Different concentrations of PF127 (1–35% (w/v)) are prepared using an ice bath following the cold technique in deionized (DI) water.4
600 g mol−1) (Sigma-Aldrich) without further chemical modifications. Different concentrations of PF127 (1–35% (w/v)) are prepared using an ice bath following the cold technique in deionized (DI) water.4
Methods
Results and discussions
Linear viscoelasticity of PF127 at different temperatures
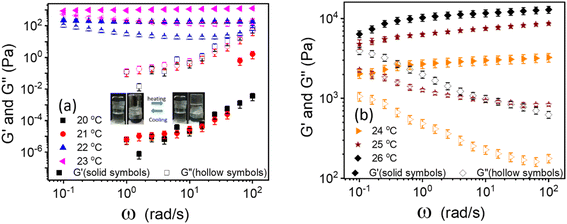
The linear viscoelastic properties of 20% PF127 gels were investigated by frequency sweep experiments at a minimal shear amplitude strain, i.e., at γ = 0.1%. The frequency sweep data for 20% PF127 at different temperatures is plotted in Fig. 1. For 20 and 21 °C, loss modulus (G′′) is dominant over storage modulus (G′) and for almost all frequency ranges. This represents the liquid-like (viscous) behavior of PF127. At low temperatures, the PF127 solution exhibits liquid-like behavior, and at 22 °C and above, the storage modulus (G′) is dominant over the loss modulus and indicates the viscoelastic fluids. At 22 °C, storage modulus (G′) shows a plateau at G′ = 200.2 ± 20.2 Pa, known as an elastic plateau in linear rheology. As the temperature increases, the elastic plateau values increase, and the sample behaves as viscoelastic solids, i.e., gels. We found that these samples exhibit yield stress for the steady shear rheology (flow curves), and we calculated the dynamic yield stress in the following section.Determination of dynamic yield stress from steady-state flow curves
The flow curves, i.e., shear stress (σ) and viscosity (η) as a function of shear rate (![[small gamma, Greek, dot above]](https://www.rsc.org/images/entities/i_char_e0a2.gif) ) of 20% PF127 at temperatures 23 °C, 24 °C, and 25 °C are shown in Fig. 2. As shown in Fig. 2(a), For 23 °C, shear stress (σ) increases linearly as a function of shear rate (
) of 20% PF127 at temperatures 23 °C, 24 °C, and 25 °C are shown in Fig. 2. As shown in Fig. 2(a), For 23 °C, shear stress (σ) increases linearly as a function of shear rate (![[small gamma, Greek, dot above]](https://www.rsc.org/images/entities/i_char_e0a2.gif) ), which is typical Newtonian behavior, and this is also reflected in Fig. 2(b); the viscosity is independent of the shear rate (
), which is typical Newtonian behavior, and this is also reflected in Fig. 2(b); the viscosity is independent of the shear rate (![[small gamma, Greek, dot above]](https://www.rsc.org/images/entities/i_char_e0a2.gif) ). The samples exhibit yield stress for 24 °C and 25 °C, which can be calculated using a non-Newtonian model. We defined this temperature as the sol–gel transition temperature using the same convention as Jalaal et al.49 (here, we have used a 20% PF127 sample, and other concentrations of PF127 are shown in ESI Fig. S1 and S2†).
). The samples exhibit yield stress for 24 °C and 25 °C, which can be calculated using a non-Newtonian model. We defined this temperature as the sol–gel transition temperature using the same convention as Jalaal et al.49 (here, we have used a 20% PF127 sample, and other concentrations of PF127 are shown in ESI Fig. S1 and S2†).
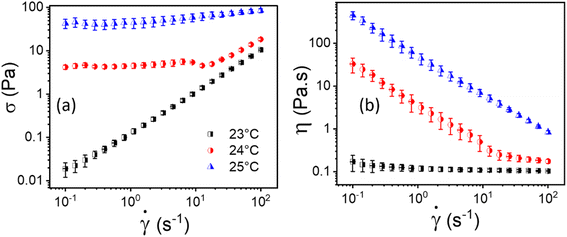 | ||
Fig. 2 Flow curves, i.e., (a and b) represents shear stress (σ) and viscosity (η) as a function of shear rate (![[small gamma, Greek, dot above]](https://www.rsc.org/images/entities/i_char_e0a2.gif) ), respectively, for 20% PF127 at varying temperatures of 23 °C, 24 °C and 25 °C. ), respectively, for 20% PF127 at varying temperatures of 23 °C, 24 °C and 25 °C. | ||
For this work to calculate the yield stress, we have used the well-known Herschel–Bulkley (HB) model. The HB model with the constituent equation is given as follows,
 | (1) |
![[small gamma, Greek, dot above]](https://www.rsc.org/images/entities/i_char_e0a2.gif) is the shear rate, σy is the yield stress, k is the consistency index, and n is the flow index. The HB model is fitted to the flow curves at different temperatures, and from Fig. 3, we observed that the HB model explains the data only for 24 °C and 25 °C (Fig. 3(a) and (b)). For 26 °C and 27 °C, it fails to explain the data (the yield stress (y0) value in the fitting parameter table shown in the figure index shows 0 ± 49.5 and 0 ± 32.9, for 26 °C and 27 °C, respectively, which has no meaning), and, we observe a slope change in the mid shear range for both data. Therefore, to understand these results, we took help from literature, and in this context, we found one exciting work by Georgios C. Georgiou.46 In his paper, they generated the flow curves numerically for parallel plate configuration by considering various aspects of wall slip.
is the shear rate, σy is the yield stress, k is the consistency index, and n is the flow index. The HB model is fitted to the flow curves at different temperatures, and from Fig. 3, we observed that the HB model explains the data only for 24 °C and 25 °C (Fig. 3(a) and (b)). For 26 °C and 27 °C, it fails to explain the data (the yield stress (y0) value in the fitting parameter table shown in the figure index shows 0 ± 49.5 and 0 ± 32.9, for 26 °C and 27 °C, respectively, which has no meaning), and, we observe a slope change in the mid shear range for both data. Therefore, to understand these results, we took help from literature, and in this context, we found one exciting work by Georgios C. Georgiou.46 In his paper, they generated the flow curves numerically for parallel plate configuration by considering various aspects of wall slip.
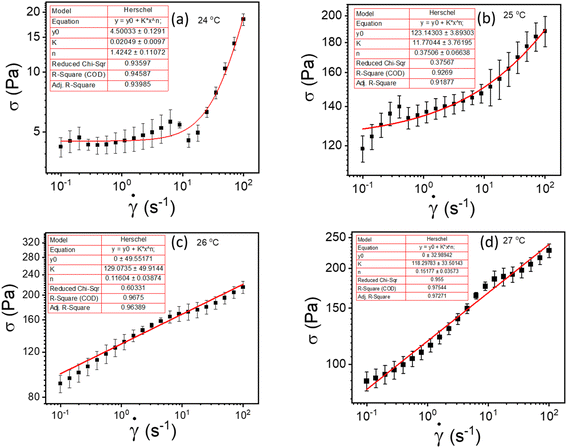 | ||
| Fig. 3 (a–d) represents HB model fitting of flow curves for 20% PF127 at temperatures varying from 23 to 27 °C, respectively. | ||
They discussed that the following slip law must be employed to calculate true yield stress when a wall slip occurs during the measurements.
 | (2) |
![[small gamma, Greek, dot above]](https://www.rsc.org/images/entities/i_char_e0a2.gif) ) generated numerically for HB fluids in case of the yield stress (σy) = 2 Pa, slip exponent (s) = 1, and slip-coefficient (β) = 1 × 10⁴ Pa ss/ms, flow index (n) = 1, and consistency index (k) = 8 × 10⁻³ Pa sn for different the slip yield stress (σs) as: (a) σs = 0; (c) σs = 1 Pa, respectively. Finite slip yield stress shown in Fig. S3(c)† is very similar to 26 °C and 27 °C data for our data shown in Fig. 3(c and d). The above arguments are also valid for investigation of the influence of slip exponent (s) variation on the flow curve with σs = 0.5 Pa, σy = 2 Pa, β = 1 × 10⁴ Pa ss/ms, n = 1 and k = 8 × 10 3 Pa sn: (b) s = 1; (d) s = 2. One can observe that for s = 1 (Fig. S3(b)†), the flow curves show a similar trend as of Fig. 3(c and d). Therefore, inspired by the above discussion, we realized that the HB model fails to explain the data due to wall slip. Therefore, we performed more careful experiments to confirm the presence of wall slip in our system, discussed in the following section.
) generated numerically for HB fluids in case of the yield stress (σy) = 2 Pa, slip exponent (s) = 1, and slip-coefficient (β) = 1 × 10⁴ Pa ss/ms, flow index (n) = 1, and consistency index (k) = 8 × 10⁻³ Pa sn for different the slip yield stress (σs) as: (a) σs = 0; (c) σs = 1 Pa, respectively. Finite slip yield stress shown in Fig. S3(c)† is very similar to 26 °C and 27 °C data for our data shown in Fig. 3(c and d). The above arguments are also valid for investigation of the influence of slip exponent (s) variation on the flow curve with σs = 0.5 Pa, σy = 2 Pa, β = 1 × 10⁴ Pa ss/ms, n = 1 and k = 8 × 10 3 Pa sn: (b) s = 1; (d) s = 2. One can observe that for s = 1 (Fig. S3(b)†), the flow curves show a similar trend as of Fig. 3(c and d). Therefore, inspired by the above discussion, we realized that the HB model fails to explain the data due to wall slip. Therefore, we performed more careful experiments to confirm the presence of wall slip in our system, discussed in the following section.
Confirmation of the presence of wall slip in the system
To verify whether apparent wall slip exists in our system, we have conducted additional tests using various rheometer geometries, including parallel plate (PP) and cone and plate (CP). The literature claims that rheological measurements do not depend on measuring geometry; however, these values would vary if a wall slip is present.13,50 As seen in Fig. 4, we observed a significant change in the flow curves from our experiments with various geometries, confirming that the sample experiences wall slip during rheological measurement. One possible reason is that in cone and plate geometry, the slip tends to occur primarily at the outer edge of the cone, where the sample comes in contact with the the stationary plate.51 This can lead to distortion in the flow profile, affecting the measured rheological properties such as viscosity and shear stress. In parallel plate geometry, wall slip typically occurs at both surfaces. Depending on the severity of the slip, it can significantly influence the flow behavior, especially at lower shear rates where slip effects are more pronounced.51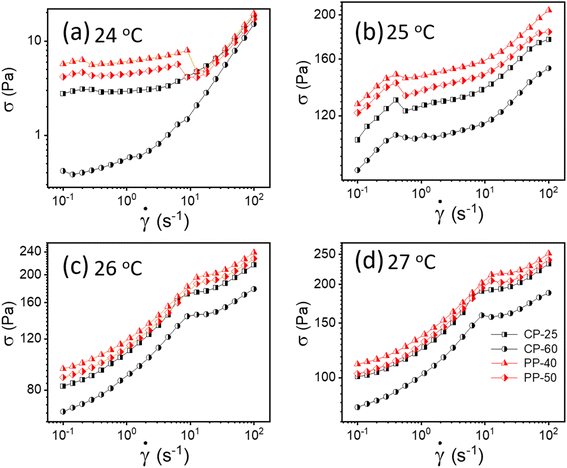 | ||
| Fig. 4 (a–d) Flow curves for 20% PF127 in different geometries (cone plate (CP) and parallel plate (PP)) at different temperatures varying from 24 to 27 °C, respectively. | ||
As discussed, wall slip usually occurs in solids due to inadequate friction on the smooth surface. After 24 °C, a phase transition occurs from sol–gel for 20% PF127, and at higher temperatures, the sample shows solid-like behavior, as confirmed by Fig. 4. Therefore, the signature of wall slip is seen at higher temperatures. As a result, the sample deviates from the HB Model. Using a rough surface to apply more friction and ignore the slip is the proper way to deal with it. However, there was no other geometry that we could have used to prevent slip because of experimental constraints. Consequently, we have used Mooney's traditional method to calculate the true yield stress corrected from slip using different measurements at different parallel plate (PP) geometry gaps.
Measurement of true yield stress corrected from slip by Mooney's plot using parallel plates
According to the literature, in the presence of wall slip, the shear rate measured by the rheometer differs from the true shear rate and is defined as the apparent shear rate.23,30,31,47,52
 | (3) |
![[small gamma, Greek, dot above]](https://www.rsc.org/images/entities/i_char_e0a2.gif) app is the apparent shear rate,
app is the apparent shear rate, ![[small gamma, Greek, dot above]](https://www.rsc.org/images/entities/i_char_e0a2.gif) is the true shear rate corrected from slip and VS is the apparent wall-slip velocity, and h is the separation gap between the parallel plates. The true yield stress (τtrue) can be calculated from the plot between (1/h) and
is the true shear rate corrected from slip and VS is the apparent wall-slip velocity, and h is the separation gap between the parallel plates. The true yield stress (τtrue) can be calculated from the plot between (1/h) and ![[small gamma, Greek, dot above]](https://www.rsc.org/images/entities/i_char_e0a2.gif) app from eqn (3). A straight line gives the slope (2VS) and intercept (
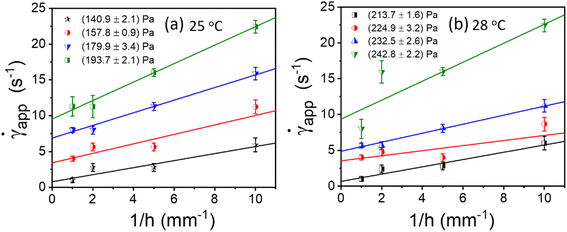
app from eqn (3). A straight line gives the slope (2VS) and intercept (![[small gamma, Greek, dot above]](https://www.rsc.org/images/entities/i_char_e0a2.gif) ). This is typically known as Mooney's plot. As discussed in previous literature, we have first performed steady-state flow curves at different gap sizes varying from (0.1, 0.25, 0.5, and 1 mm). Then, the shear stress value and corresponding shear rate values were taken from each plot and average values (the error bar represents the mean and standard deviation of all 3 measurements in each gap size). As seen in Fig. 5 and S4,† we have plotted these curves for various temperatures and shear stresses. The fitted line has a slope of 2VS; the slip velocity and shear stress value are represented by half of the slope, and for any intercept (
). This is typically known as Mooney's plot. As discussed in previous literature, we have first performed steady-state flow curves at different gap sizes varying from (0.1, 0.25, 0.5, and 1 mm). Then, the shear stress value and corresponding shear rate values were taken from each plot and average values (the error bar represents the mean and standard deviation of all 3 measurements in each gap size). As seen in Fig. 5 and S4,† we have plotted these curves for various temperatures and shear stresses. The fitted line has a slope of 2VS; the slip velocity and shear stress value are represented by half of the slope, and for any intercept (![[small gamma, Greek, dot above]](https://www.rsc.org/images/entities/i_char_e0a2.gif) ∼0), the corresponding shear stress is known as dynamic yield stress.23,30,31,47,52 Fig. 5(a) and (b) represent Mooney's plot for 25 °C and 28 °C for different shear stress values. We observed that from Fig. 5(a) and (b) shear stress values (140.9 ± 2.1) Pa and (213.7 ± 1.6), respectively, the intercept almost approached zero; therefore, we defined these values as yield stress at that temperature. In Fig. S4,† we have shown Mooney's plot at 26–30 °C, respectively, and calculate the corresponding yield stress values.
∼0), the corresponding shear stress is known as dynamic yield stress.23,30,31,47,52 Fig. 5(a) and (b) represent Mooney's plot for 25 °C and 28 °C for different shear stress values. We observed that from Fig. 5(a) and (b) shear stress values (140.9 ± 2.1) Pa and (213.7 ± 1.6), respectively, the intercept almost approached zero; therefore, we defined these values as yield stress at that temperature. In Fig. S4,† we have shown Mooney's plot at 26–30 °C, respectively, and calculate the corresponding yield stress values.
Though this method has traditionally been used to calculate the true yield stress of a material, eliminating the slip during the measurements, this method is labor-intensive, and a large sample is required for repetitive experiments for different gaps of rheometric geometry. Therefore, to overcome these drawbacks, we followed a second approach, where we included the slip boundary conditions in the HB equation, modified the HB equation in the form of the famous Windhab model equation, and calculated the true yield stress and slip yield stress.
Calculation of true yield stress by including slip boundary condition in HB model
Consider a simple plane coquette shearing flow between two parallel plates with a gap (h), as shown in Fig. 6(a). The lower plate is fixed, and the upper plate moves at a constant velocity (V) along the x-direction. If the density of the fluid is (ρ) and the fluid velocity vector is given as u = u(u1, u2, u3) where bold letter denote the vector representation and u1, u2, u3 are the x, y, and z components of the fluid velocity vector (u), then the equation of continuity (conservation of mass)14,53 is given as
 | (4) |
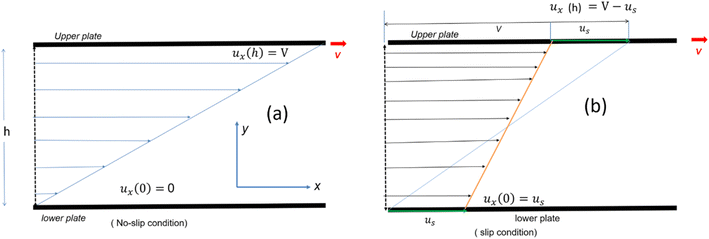 | ||
| Fig. 6 Schematic representation of velocity profile between two parallel plates with a gap (h) for various boundary conditions (a) no slip (b) slip boundary condition, respectively. | ||
Now, for steady-state conditions and incompressible fluid (ρ is constant), the above equation will reduce to
| ∇·u = 0 | (5) |
Similarly, the equation of motion (conservation of momentum), famously known as the Navier–stokes equation,53 is given as
 | (6) |
Now, since we consider the flow is in between two plates, the velocity of the fluids in one direction, i.e., along the x-direction, and no motion in the y and z-direction. Then, the velocity of the fluids can be represented as u = u(u1, 0, 0), and since we consider a simple plane coquette shearing flow, there is no pressure gradient, i.e., ∇p = 0, and we also assume that there exist no external forces (F = 0) using these conditions eqn (5) and (6) can be reduced to following,
Eqn (5) can be written as
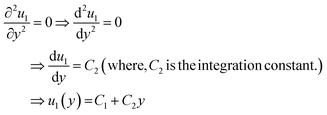
Similarly, eqn (6) reduced to only the x-component momentum equation, i.e.
For simplicity, we drop the subscript and write u instead of u1
| ⇒u(y) = C1 + C2y | (7) |
Eqn (7) represents the velocity of the fluids between parallel plates. If we apply a no-slip boundary condition (velocity of the fluids and plate are same), i.e., for a lower plate which is fixed u(0) = 0 and the upper plate moving with velocity (v) so, u(h) = v. Applying this to the boundary condition in eqn (7), we arrived at,
 | (8) |
This gives a linear velocity profile for no-slip boundary conditions and is shown in Fig. 6(a), if the shear rate (![[small gamma, Greek, dot above]](https://www.rsc.org/images/entities/i_char_e0a2.gif) ) is linear, then this can be defined as
) is linear, then this can be defined as
 | (9) |
If we assume a monotonic slip law (i.e., slip velocity is the same for both plates), the boundary conditions, i.e., u(0) = VS and u(0) = v − VS
Applying the slip boundary condition eqn (7) has the following form.
 | (10) |
The velocity profile is still linear but slightly shifted, as shown in Fig. 6(b), and now, the true shear rate can be defined as
 | (11) |
Experimentally, the shear rate is measured as the apparent shear rate,
 | (12) |
Now, using eqn (11) in HB model
σ(![[small gamma, Greek, dot above]](https://www.rsc.org/images/entities/i_char_e0a2.gif) ) = σ0 + k ) = σ0 + k![[small gamma, Greek, dot above]](https://www.rsc.org/images/entities/i_char_e0a2.gif) n n |
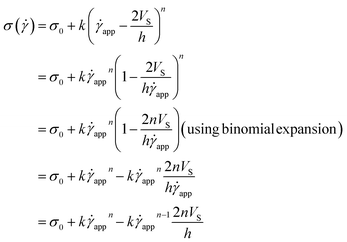
The modified HB model, including the slip boundary condition, has the following form:
 | (13) |
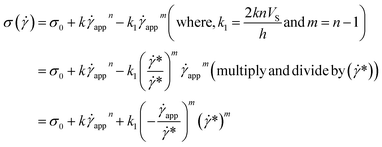 | (14) |
 | (15) |
This equation is well known in the form of the Windhab model with additional power terms m and n (when m = n = 1, eqn (15) is reduced to the Windhab equation). Therefore, we defined this as a modified Windhab equation. To avoid confusion, we used ![[small gamma, Greek, dot above]](https://www.rsc.org/images/entities/i_char_e0a2.gif) app as only
app as only ![[small gamma, Greek, dot above]](https://www.rsc.org/images/entities/i_char_e0a2.gif) and if we write eqn (15) with some redefined constant inspired by the Windhab model, then the equation becomes
and if we write eqn (15) with some redefined constant inspired by the Windhab model, then the equation becomes
 | (16) |
![[small gamma, Greek, dot above]](https://www.rsc.org/images/entities/i_char_e0a2.gif) * is a normalization constant. We have taken some arguments from different literature to understand each term's physical meaning and generalization of the approach to any system.
* is a normalization constant. We have taken some arguments from different literature to understand each term's physical meaning and generalization of the approach to any system.
Consequently, to validate our approach generalized to any system, we took help from arguments discussed in Moud et al.,47 where they discussed wall slip in kaolin clays, as shown in Fig. 7(a) and discussed different regimes and their physical significance. Then, we fitted eqn (16) to the data from Moud et al.,47 as shown in Fig. 7(a), and we found that the equation fitted very well to the data. Here σ0 value lies in Regime-II, defined by Moud et al.47 in Fig. 7(a), which is nothing but the slip yield stress and σ1 lies in Regime-III, which is the true yield stress. Therefore, from fitting parameters, we found that σ0, is the slip yield stress, and σ1, is the true yield stress, and ![[small gamma, Greek, dot above]](https://www.rsc.org/images/entities/i_char_e0a2.gif) *, is transition shear rate. When observing the flow curves, we see slope changes from low shear to higher shear rates after some shear rate. Here,
*, is transition shear rate. When observing the flow curves, we see slope changes from low shear to higher shear rates after some shear rate. Here,![[small gamma, Greek, dot above]](https://www.rsc.org/images/entities/i_char_e0a2.gif) * represents the corresponding shear rate and is defined as the transition shear rate, and (n and m are slip and power-law exponents, respectively). Therefore, we write the eqn (15) as
* represents the corresponding shear rate and is defined as the transition shear rate, and (n and m are slip and power-law exponents, respectively). Therefore, we write the eqn (15) as
 | (17) |
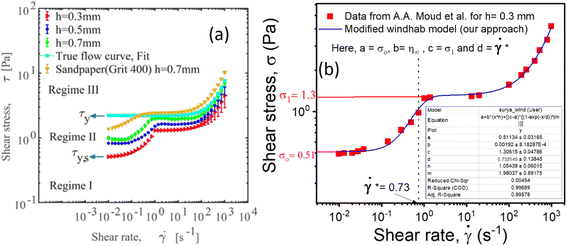 | ||
| Fig. 7 (a) Flow curves of Kaolin clay in a parallel plate geometry with different gaps (adapted and reproduced with permission from ref. 47) and (b) data taken from (a) and plotted with eqn (16). The red and pink lines are the extrapolation of yield stress values found from fitting the vertical dotted line represented by the transition shear rate obtained from the fitting eqn (16). | ||
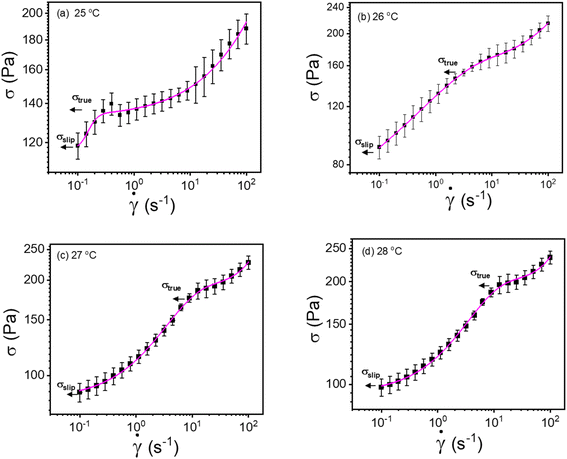 | ||
| Fig. 8 (a–d) Modified Windhab model (eqn (17)) fitting of flow curves for 20% PF127 at different temperatures from 25 to 28 °C, respectively (shear rate ranges from 0.1 to 100 s−1). | ||
| Temperature (°C) | Comparison of yield stress from various methods, σy (Pa) | |
|---|---|---|
| Modified Windhab model fit (our approach) (Fig. 8) | Mooney's plot (![[small gamma, Greek, dot above]](https://www.rsc.org/images/entities/char_e0a2.gif) app vs. 1/h) (Fig. 5) app vs. 1/h) (Fig. 5) |
|
| 25 | 138.3 ± 4.5 | 140.9 ± 2.1 |
| 26 | 160.8 ± 3.3 | 172.9 ± 2.9 |
| 27 | 201.6 ± 7.7 | 202.5 ± 3.8 |
| 28 | 213.5 ± 7.9 | 213.7 ± 1.6 |
| 29 | 223.8 ± 8.1 | 221.1 ± 2.9 |
| 30 | 230.7 ± 8.3 | 228.8 ± 1.5 |
Temperature-dependent dynamic yield stress
Fig. 9(a) shows the yield stress obtained from various methods plotted as a function of temperature. We found that yield stress increases as a function of temperature, and the experimental data following a sigmoid curve can be fitted by an empirical equation in the form of the Boltzmann equation54 as follows,
 | (18) |
 is yield stress plateau at low temperatures and
  yield stress plateau at high temperatures and Tc is the critical temperature where the yield stress increases exponentially. The yield stress values gradually increase as shown by the plateau, in this case. The increasing value of yield stress for PF127 is consistent with Jalaal et al.'s study49 at different temperatures at 5 °C intervals but doesn't formally report any trend, and as discussed earlier near the sol–gel transition temperature, each 1 °C interval is important; therefore we carefully calculated the yield stress and found the trend. The increasing trend can be understood by the mechanism suggested by Suman et al. that the individual micelle size may increase and can form a glassy state at higher temperatures can account for the exponential increase in the yield stress at higher temperatures.55 In the current study, we compared the results with other thermoresponsive polymer poly(N-isopropyl acrylamide) (PNIPAM) and found some interesting and contradictory results.
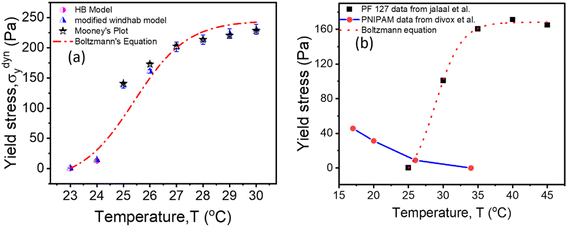 | ||
| Fig. 9 (a) Comparison of dynamic yield stress values obtained from different methods for 20% PF127. The data fits Boltzmann's equation (eqn (18)). (b) The temperature-dependent yield stress of reported data for 20% PF127 taken from Jalaal et al.49 is fitted with eqn (18), and PNIPAM gels are from ref. 43. | ||
When comparing the yield stress for other conventional thermoresponsive polymers such as PNIPAM, whereas the temperature increased, a noticeable decrease in yield stress was shown in Fig. 9(b) (data are taken from Divoux et al.43 and plotted). This phenomenon can be attributed to the coil-to-globule transition experienced by PNIPAM, where hydrophobic interactions cause the polymer chains to collapse from extended coils to compact globules. Consequently, the overall hydrodynamic volume of PNIPAM decreases, leading to reduced intermolecular entanglements and a less dense gel network. This decrease in network density results in a lower resistance to deformation, hence the observed decrease in yield stress with increasing temperature.56–58 In contrast, Pluronic PF127 exhibited increased yield stress with increasing temperature. Above its critical micelle temperature TCMT (around 15–30 °C), Pluronic PF127 undergoes micelle formation, where hydrophobic PPO blocks assemble into micellar cores surrounded by hydrophilic PEO shells. The increase in temperature leads to enhanced micelle aggregation and packing, resulting in the formation of a denser gel network. This densification of the gel network corresponds to an increase in yield stress as the gel becomes more resistant to deformation. The contrasting temperature-dependent yield stress behaviors of PNIPAM and Pluronic PF127 highlight their distinct gelation mechanisms. While PNIPAM's coil-to-globule transition decreases yield stress, Pluronic PF127's micelle formation leads to an increase in yield stress with increasing temperature.58 The biomedical field has used body temperature as the transition temperature for two to three decades. Examining the yield stress concerning temperature can provide an additional understanding of the rheological characteristics of PF127 in diverse drug delivery applications and transport phenomena.
Conclusion
This study thoroughly investigated the yield stress behavior of PF127 at various temperatures using the Herschel–Bulkley model and the modified Windhab model, shedding light on the rheological characteristics of the thermoresponsive polymer. The HB model effectively described the data at lower temperatures (23 °C to 25 °C) but failed at higher temperatures (26 °C and 27 °C) due to wall slip. This failure was indicated by a slope change in the mid-shear range with a kink around a shear rate of 10 s−1, and unrealistic yield stress values at these temperatures.Further tests proved the presence of wall slip using flow curves depending on rheometric geometry, which led to the adoption of the modified Windhab model to address the limitations of the HB model. The flow curves at higher temperatures were more accurately fitted (with higher R-square values) by this wall slip-accounting model. The temperature-dependent yield stress increased significantly as the results showed, following a sigmoid curve that could be explained by an empirical equation like the Boltzmann equation. Comparative analysis with other thermoresponsive polymers, such as PNIPAM, highlighted the distinct gelation mechanisms and temperature-dependent yield stress behaviors of PF127. Unlike PNIPAM, which shows a decrease in yield stress with increasing temperature due to the coil-to-globule transition, PF127 exhibited an increase in yield stress attributed to enhanced micelle aggregation and network densification at higher temperatures.
This research emphasizes the importance of considering wall slip effects in rheological measurements and provides a robust framework for understanding the temperature-dependent rheological properties of PF127. The findings have significant implications for using PF127 in biomedical applications, particularly in drug delivery systems where temperature-sensitive gelation is crucial. Future research should explore applying these models to other complex fluids and further investigate the mechanisms underlying the observed temperature-dependent behaviors.
Data availability
The data supporting this study's findings are available from the corresponding author upon reasonable request.Conflicts of interest
There are no conflicts to disclose.Acknowledgements
RKP acknowledges the Department of Science and Technology for an INSPIRE Faculty Award Grant [DST/INSPIRE/04/2016/002370] and the Core Research Grants [CRG/2020/006281, CRG/2021/004759] from SERB, Government of India. The authors acknowledge IISER Tirupati for funding and research facilities.References
- M. Bahram, N. Mohseni, and M. Moghtader, An Introduction to Hydrogels and Some Recent Applications, IntechOpen, 2016 Search PubMed.
- L. Klouda and A. G. Mikos, Thermoresponsive hydrogels in biomedical applications, Eur. J. Pharm. Biopharm., 2008, 68(1), 34–45 CrossRef CAS PubMed.
- M. J. Taylor, P. Tomlins and T. S. Sahota, Thermoresponsive Gels, Gels, 2017, 3(1), 4 CrossRef PubMed.
- I. R. Schmolka, Artificial skin I. Preparation and properties of pluronic F-127 gels for treatment of burns, J. Biomed. Mater. Res., 1972, 6(6), 571–582 CrossRef CAS PubMed.
- P. Zarrintaj, J. D. Ramsey, A. Samadi, Z. Atoufi, M. K. Yazdi, M. R. Ganjali, L. M. Amirabad, E. Zangene, M. Farokhi, K. Formela, M. R. Saeb, M. Mozafari and S. Thomas, Poloxamer: A versatile tri-block copolymer for biomedical applications, Acta Biomater., 2020, 110, 37–67 CrossRef CAS PubMed.
- E.-J. Courtial, C. Perrinet, A. Colly, D. Mariot, J.-M. Frances, R. Fulchiron and C. Marquette, Silicone rheological behavior modification for 3D printing: Evaluation of yield stress impact on printed object properties, Addit. Manuf., 2019, 28, 50–57 CAS.
- A. Colly, C. Marquette and E.-J. Courtial, Poloxamer/Poly(ethylene glycol) Self-Healing Hydrogel for High-Precision Freeform Reversible Embedding of Suspended Hydrogel, Langmuir, 2021, 37(14), 4154–4162 CrossRef CAS PubMed.
- C. Perrinet, E.-J. Courtial, A. Colly, C. Marquette and R. Fulchiron, Enhancing the Yield Stress in Liquid Polydimethylsiloxane to Allow Its 3D Printing: Hydrogels as Removable Fillers, Macromol. Mater. Eng., 2021, 306(2), 2000553 CrossRef CAS.
- M. Dinkgreve, J. Paredes, M. M. Denn and D. Bonn, On different ways of measuring ‘the’ yield stress, J. Non-Newtonian Fluid Mech., 2016, 238, 233–241 CrossRef CAS.
- Y. M. Joshi and G. Petekidis, Yield stress fluids and ageing, Rheol. Acta, 2018, 57(6), 521–549 CrossRef CAS.
- H. M. Shewan, J. R. Stokes and M. Cloitre, Particle–wall tribology of slippery hydrogel particle suspensions, Soft Matter, 2017, 13(10), 2099–2106 RSC.
- M. Cloitre and R. T. Bonnecaze, A review on wall slip in high solid dispersions, Rheol. Acta, 2017, 56(3), 283–305 CrossRef CAS.
- A. Y. Malkin and S. A. Patlazhan, Wall slip for complex liquids – Phenomenon and its causes, Adv. Colloid Interface Sci., 2018, 257, 42–57 CrossRef CAS PubMed.
- R. G. Larson, The Structure and Rheology of Complex Fluids, Oxford University Press, New York, United States of America, 1st edn, 1999 Search PubMed.
- S. G. Hatzikiriakos, Slip mechanisms in complex fluid flows, Soft Matter, 2015, 11(40), 7851–7856 RSC.
- R. T. Bonnecaze and M. Cloitre, Micromechanics of Soft Particle Glasses, in High Solid Dispersions, ed. M. Cloitre, Springer, Berlin, Heidelberg, 2010, pp. 117–161 Search PubMed.
- T. Divoux, M. A. Fardin, S. Manneville and S. Lerouge, Shear Banding of Complex Fluids, Annu. Rev. Fluid Mech., 2016, 48(1), 81–103 CrossRef.
- D. Bonn, M. M. Denn, L. Berthier, T. Divoux and S. Manneville, Yield stress materials in soft condensed matter, Rev. Mod. Phys., 2017, 89(3), 035005 CrossRef.
- D. M. Kalyon, P. Yaras, B. Aral and U. Yilmazer, Rheological behavior of a concentrated suspension: A solid rocket fuel simulant, J. Rheol., 1993, 37(1), 35–53 CrossRef CAS.
- R. Buscall, Letter to the Editor: Wall slip in dispersion rheometry, J. Rheol., 2010, 54(6), 1177–1183 CrossRef CAS.
- H. A. Barnes, A review of the slip (wall depletion) of polymer solutions, emulsions and particle suspensions in viscometers: its cause, character, and cure, J. Non-Newtonian Fluid Mech., 1995, 56(3), 221–251 CrossRef CAS.
- H. Hu, R. G. Larson and J. J. Magda, Measurement of wall-slip-layer rheology in shear-thickening wormy micelle solutions, J. Rheol., 2002, 46(4), 1001–1021 CrossRef CAS.
- V. Bertola, F. Bertrand, H. Tabuteau, D. Bonn and P. Coussot, Wall slip and yielding in pasty materials, J. Rheol., 2003, 47(5), 1211–1226 CrossRef CAS.
- S. Manneville, A. Colin, G. Waton and F. Schosseler, Wall slip, shear banding, and instability in the flow of a triblock copolymer micellar solution, Phys. Rev. E: Stat., Nonlinear, Soft Matter Phys., 2007, 75(6), 061502 CrossRef PubMed.
- S. Manneville, Recent experimental probes of shear banding, Rheol. Acta, 2008, 47(3), 301–318 CrossRef CAS.
- S. G. Hatzikiriakos, Wall slip of molten polymers, Prog. Polym. Sci., 2012, 37(4), 624–643 CrossRef CAS.
- D. Vlassopoulos and M. Cloitre, Tunable rheology of dense soft deformable colloids, Curr. Opin. Colloid Interface Sci., 2014, 19(6), 561–574 CrossRef CAS.
- D. M. Kalyon and S. Aktaş, Factors Affecting the Rheology and Processability of Highly Filled Suspensions, Annu. Rev. Chem. Biomol. Eng., 2014, 5(1), 229–254 CrossRef CAS PubMed.
- S. A. Wajihah and D. S. Sankar, A review on non-Newtonian fluid models for multi-layered blood rheology in constricted arteries, Arch. Appl. Mech., 2023, 93(5), 1771–1796 CrossRef PubMed.
- M. Mooney, Explicit Formulas for Slip and Fluidity, J. Rheol., 1931, 2(2), 210–222 CrossRef CAS.
- A. Yoshimura and R. K. Prud’homme, Wall Slip Corrections for Couette and Parallel Disk Viscometers, J. Rheol., 1988, 32(1), 53–67 CrossRef CAS.
- U. Yilmazer and D. M. Kalyon, Slip Effects in Capillary and Parallel Disk Torsional Flows of Highly Filled Suspensions, J. Rheol., 1989, 33(8), 1197–1212 CrossRef CAS.
- S. G. Hatzikiriakos and J. M. Dealy, Wall slip of molten high density polyethylene. I. Sliding plate rheometer studies, J. Rheol., 1991, 35(4), 497–523 CrossRef CAS.
- S. G. Hatzikiriakos and J. M. Dealy, Role of slip and fracture in the oscillating flow of HDPE in a capillary, J. Rheol., 1992, 36(5), 845–884 CrossRef CAS.
- S. G. Hatzikiriakos and J. M. Dealy, Wall slip of molten high density polyethylenes. II. Capillary rheometer studies, J. Rheol., 1992, 36(4), 703–741 CrossRef CAS.
- B. K. Aral and D. M. Kalyon, Effects of temperature and surface roughness on time-dependent development of wall slip in steady torsional flow of concentrated suspensions, J. Rheol., 1994, 38(4), 957–972 CrossRef CAS.
- E. E. Rosenbaum and S. G. Hatzikiriakos, Wall slip in the capillary flow of molten polymers subject to viscous heating, AIChE J., 1997, 43(3), 598–608 CrossRef CAS.
- S. P. Meeker, R. T. Bonnecaze and M. Cloitre, Slip and Flow in Soft Particle Pastes, Phys. Rev. Lett., 2004, 92(19), 198302 CrossRef PubMed.
- S. P. Meeker, R. T. Bonnecaze and M. Cloitre, Slip and flow in pastes of soft particles: Direct observation and rheology, J. Rheol., 2004, 48(6), 1295–1320 CrossRef CAS.
- J. R. Seth, M. Cloitre and R. T. Bonnecaze, Influence of short-range forces on wall-slip in microgel pastes, J. Rheol., 2008, 52(5), 1241–1268 CrossRef CAS.
- S.-Q. Wang, S. Ravindranath and P. E. Boukany, Homogeneous Shear, Wall Slip, and Shear Banding of Entangled Polymeric Liquids in Simple-Shear Rheometry: A Roadmap of Nonlinear Rheology, Macromolecules, 2011, 44(2), 183–190 CrossRef CAS.
- P. Ballesta, N. Koumakis, R. Besseling, W. C. K. Poon and G. Petekidis, Slip of gels in colloid– polymer mixtures under shear, Soft Matter, 2013, 9(12), 3237–3245 RSC.
- T. Divoux, V. Lapeyre, V. Ravaine and S. Manneville, Wall slip across the jamming transition of soft thermoresponsive particles, Phys. Rev. E: Stat., Nonlinear, Soft Matter Phys., 2015, 92(6), 060301 CrossRef PubMed.
- E. Chatzigiannakis, M. Ebrahimi, M. H. Wagner and S. G. Hatzikiriakos, Wall slip of polyisobutylenes: effect of molecular characteristics, Rheol. Acta, 2017, 56(2), 85–94 CrossRef CAS.
- R. J. Chin, S. H. Lai, S. Ibrahim, W. Z. Wan Jaafar and A. Elshafie, Rheological wall slip velocity prediction model based on artificial neural network, J. Exp. Theor. Artif. Intell., 2019, 31(4), 659–676 CrossRef.
- G. C. Georgiou, Simple shear flow of a Herschel–Bulkley fluid with wall slip above a threshold stress, Appl. Eng. Sci., 2021, 8, 100068 Search PubMed.
- A. Abbasi Moud, J. Poisson, Z. M. Hudson and S. G. Hatzikiriakos, Yield stress and wall slip of kaolinite networks, Phys. Fluids, 2021, 33(5), 053105 CrossRef CAS.
- A. Abbasi Moud, J. Piette, M. Danesh, G. C. Georgiou and S. G. Hatzikiriakos, Apparent slip in colloidal suspensions, J. Rheol., 2022, 66(1), 79–90 CrossRef CAS.
- M. Jalaal, G. Cottrell, N. Balmforth and B. Stoeber, On the rheology of Pluronic F127 aqueous solutions, J. Rheol., 2017, 61(1), 139–146 CrossRef CAS.
- A. Talmon, E. Meshkati, A. Talmon, and E. Meshkati, Rheology, Rheometry and Wall Slip, IntechOpen, 2022 Search PubMed.
- A. Magnin and J. M. Piau, Cone-and-plate rheometry of yield stress fluids. Study of an aqueous gel, J. Non-Newtonian Fluid Mech., 1990, 36, 85–108 CrossRef CAS.
- H. J. Walls, S. B. Caines, A. M. Sanchez and S. A. Khan, Yield stress and wall slip phenomena in colloidal silica gels, J. Rheol., 2003, 47(4), 847–868 CrossRef CAS.
- Soft Matter Physics: an Introduction, ed. M. Kleman and O. D. Lavrentovich, Springer, New York, NY, 2003 Search PubMed.
- J. Reséndiz-Muñoz, M. A. Corona-Rivera, J. L. Fernández-Muñoz, M. Zapata-Torres, A. Márquez-Herrera and V. M. Ovando-Medina, Mathematical model of Boltzmann’s sigmoidal equation applicable to the set-up of the RF-magnetron co-sputtering in thin films deposition of Bax Sr1−xTiO3, Bull. Mater. Sci., 2017, 40(5), 1043–1047 CrossRef.
- K. Suman, S. Sourav and Y. M. Joshi, Rheological signatures of gel–glass transition and a revised phase diagram of an aqueous triblock copolymer solution of Pluronic F127, Phys. Fluids, 2021, 33(7), 073610 CrossRef CAS.
- H. G. Schild, Poly(N-isopropylacrylamide): experiment, theory and application, Prog. Polym. Sci., 1992, 17(2), 163–249 CrossRef CAS.
- Y. Guan and Y. Zhang, PNIPAM microgels for biomedical applications: from dispersed particles to 3D assemblies, Soft Matter, 2011, 7(14), 6375–6384 RSC.
- M. Khimani, H. Patel, V. Patel, P. Parekh and R. L. Vekariya, Self-assembly of stimuli-responsive block copolymers in aqueous solutions: an overview, Polym. Bull., 2020, 77(11), 5783–5810 CrossRef CAS.
Footnote |
| † Electronic supplementary information (ESI) available. See DOI: https://doi.org/10.1039/d4ra04825c |
| This journal is © The Royal Society of Chemistry 2024 |

