 Open Access Article
Creative Commons Attribution 3.0 Unported Licence
Nickel platinum (NixPt1−x) nanoalloy monodisperse particles without the core–shell structure by colloidal synthesis†
Cora
Moreira Da Silva
 *a,
Armelle
Girard
ab,
Maxime
Dufond‡
 a,
Frédéric
Fossard
a,
Amandine
Andrieux-Ledier
c,
Vincent
Huc
a,
Frédéric
Fossard
a,
Amandine
Andrieux-Ledier
c,
Vincent
Huc
 *d and
Annick
Loiseau
*a
aLaboratoire d'Étude des Microstructures, CNRS, ONERA, U. Paris-Saclay, Châtillon, 92322, France. E-mail: annick.loiseau@onera.fr
bUniversité Versailles Saint-Quentin, U. Paris-Saclay, Versailles, 78035, France
cDépartement Physique, Instrumentation, Environnement, Espace, ONERA, U. Paris-Saclay, Châtillon, 92322, France
dInstitut de Chimie Moléculaire et des Matériaux d'Orsay, CNRS, Paris Sud, U. Paris-Saclay, Orsay, 91045, France. E-mail: vincent.huc@universite-paris-saclay.fr
First published on 9th July 2020
Abstract
We report a new and versatile colloidal route towards the synthesis of nanoalloys with controlled size and chemical composition in the solid solution phase (without phase segregation such as core–shell structure or Janus structure) or chemical ordering. The principle of the procedure is based on the correlation between the oxidation–reduction potential of metal cations present in the precursors and the required synthesis temperature to nucleate particles without phase segregation. The procedure is demonstrated via the synthesis of Face Centered Cubic (FCC) NixPt1−x nanoparticles, which was elaborated by the co-reduction of nickel(II) acetylacetonate and platinum(II) acetylacetonate with 1,2-hexadecanediol in benzyl ether, using oleylamine and oleic acid as surfactants. The chemical composition and solid solution FCC structure of the nanoalloy are demonstrated by crosslinking imaging and chemical analysis using transmission electron microscopy and X-ray diffraction techniques. Whatever the chemical composition inspected, a systematic expansion of the lattice parameters is measured in relation to the respective bulk counterpart.
1 Introduction
Nanomaterials are widely studied in many scientific fields because of their specific reactivity due to their size.1,2 Metallic nanoparticles (NPs) have revolutionized the world of catalysis. Their reduced size, which maximizes their specific surface area, gives them a chemical reactivity different from their bulk counterpart.1–3 Furthermore, playing with nanoalloyed particles provides additional keys for tuning catalytic properties beyond size effects.4–7 This approach is today one of the most promising routes to the selective growth of Single Wall Carbon Nanotubes (SWCNTs).8–12 The main synthesis process of these nano-objects is chemical vapor deposition (CVD), based on the catalytic decomposition of an organic gas precursor at the surface of metallic nanoparticles. As their metallic or semi-conducting character directly depends on their diameter and chirality,13 controlling these structural parameters during the synthesis remains a hot challenge for the development of many applications. Most advanced modellings relate the chirality of SWCNTs to their growth mode and to the carbon content of the catalyst nanoparticles from which the nanotube grows.10,14–16One way to control the carbon content is to play with the carbon solubility of the catalyst.14–18 Our approach is to tune it by nanoalloying the catalyst. To that aim, we have chosen to study NixPt1−x particles, with the composition ranging from pure Ni to pure Pt. Ni is known for its carbon solubility19–21 unlike platinum. The Ni–Pt bulk phase diagram indicates the stability of the solid solution regardless of the alloy concentration in all the temperature ranges visited to synthesize SWCNTs. Platinum is expected to modulate the catalytic activity of Ni by varying the carbon solubility in the NPs. To study the impact of this parameter on CNT growth (ongoing), synthesis of Ni, Ni3Pt, NiPt, NiPt3 and Pt (compositions defined in the bulk)22,23 homogeneous nanoalloys with identical controlled size and shape is required. Towards this goal, NP synthesis can be achieved via physical or chemical routes.
Physical routes, such as magnetron ion sputtering,24 molecular beam epitaxy (MBE)25 and pulsed laser deposition (PLD)26 are essentially based on the production of metal vapors and their condensation on a substrate surface. The resulting particles are of high purity and small size, monodispersed and their composition is easily controllable through the metal composition of the vapor. Despite these numerous advantages, these NPs are difficult to handle due to their size and are easily oxidized in air. Surface treatment (protective layer) is thus frequently necessary. To control their size, alloying or core–shell state and crystallographic structure, annealing is often necessary but can lead to undesired chemical modifications, coalescence and Ostwald ripening, resulting in polydispersed NPs.
Chemical routes encompass a large variety of techniques such as solvothermal,27,28 colloidal,29,30 sonochemical31,32 synthesis or use of well-defined pre-catalysts such as prussian blue analogs.33,34 Among them, the colloidal route is highly attractive for our purpose as it is an efficient and reliable route to obtain NPs with tunable size, shape and chemical composition.35 The principle of colloidal synthesis consists in the co-reduction of metal precursors assisted by a reducing agent, in the presence of surfactants in an organic medium, at a given temperature. Reduced metal atoms react with each other to form alloy particles, coated by surfactant molecules. The role of the long carbon chains attached to the NP surface is to block the growth of the NPs,36 set their size and stabilize them by minimizing surface energies.2,37,38 Size tunability is achieved by adjusting the metallic precursor![[thin space (1/6-em)]](https://www.rsc.org/images/entities/char_2009.gif) :
:![[thin space (1/6-em)]](https://www.rsc.org/images/entities/char_2009.gif) surfactant ratio.39 The organic coating makes the NPs soluble in organic solvents and protects them from oxidation. The nature of the generated particles depends on several parameters such as (i) the inherent reactivity of the reagents used, (ii) the quantity of reagents used, (iii) temperature and (iv) reaction time.
surfactant ratio.39 The organic coating makes the NPs soluble in organic solvents and protects them from oxidation. The nature of the generated particles depends on several parameters such as (i) the inherent reactivity of the reagents used, (ii) the quantity of reagents used, (iii) temperature and (iv) reaction time.
In this study we demonstrate the efficiency of the colloidal route for the synthesis of alloyed nickel–platinum NPs, without phase segregation or a core–shell structure, with controlled chemical composition from pure Ni to pure Pt and controlled size below 5 nm.
2 Chemical synthesis route to nanoalloyed particles
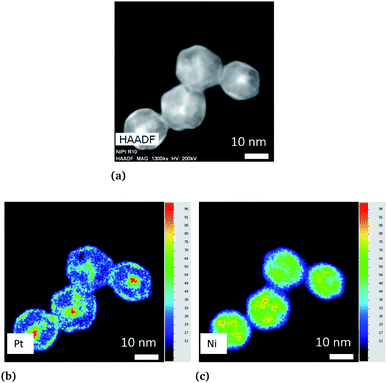
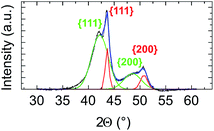
We first applied the procedure used in previous studies for the colloidal synthesis of NixPt1−x nanoalloys, which involves simultaneous reduction reactions of Pt(acac)2 and Ni(acac)2 at 220–230 °C. In agreement with the literature,30,39–43 we obtained under these conditions NPs with either a core–shell Pt@Ni (Pt core surrounded by Ni shell) structure or a platinum concentration gradient from the NP center to its surface as shown in the images of Fig. 1 (and Fig. S1 of the ESI†). In Fig. 1a, recorded with high-angle annular dark-field imaging (HAADF) in scanning transmission electron microscopy (STEM) mode, the contrast in the image is related to Z, the atomic number difference between Pt (78) and Ni (28), with brighter zones in the core of the NPs indicating a Pt-rich concentration. The core–shell structure is confirmed from chemical mappings using energy-dispersive X-ray spectroscopy (EDX) (see Fig. 1b, c and EDX spectra analysis of the four NPs of Fig. 1, and Fig. S2 of the ESI†). The signal from Ni atoms is constantly depressed in areas where Pt atoms are present, reflecting a clear chemical segregation. In Fig. 1b, increase of the Pt signal is noted on the NP surface. The observed images are projections, but if one facet of the NP is parallel to the electron beam, there is strengthening due to the thickness and not the chemical composition (see intensity profiles Fig. S3 of the ESI†).In Fig. 2, the crystal structure is verified by powder X-ray diffraction (PXRD). The deconvolution of the PXRD pattern shows the presence of two FCC phases. Indexing of XRD peaks demonstrates the coexistence of an FCC disordered NiPt phase (in green) and FCC disordered Ni3Pt (in red), which is proof of a Pt concentration gradient within NPs from their core to their surface. The respective lattice parameters are listed in Table S1 (ESI†). Furthermore, thanks to Scherrer formula applied to (111) peaks, we determined two specific sizes, the first one equal to 2.7 nm (NiPt phase), which can be assigned to the core of the NPs and the second one equal to 9.9 nm (Ni3Pt phase), which corresponds to the shell morphology. This result is in agreement with EDX analysis (see Fig. 1b and c).
As these results were far from our objective, we paid particular attention to identifying the effects responsible for the chemical segregation observed. Our analysis is that the segregation is first caused by the difference between the standard reduction potentials of platinum in the oxidation state +II in Pt(acac)2 (E0(PtII/Pt0) = +1.18 V) and of nickel +II as well in Ni(acac)2 (E0(NiII/Ni0) = −0.253 V), which generates different reduction kinetics.44–46 It is known that the higher the difference between the oxidation–reduction potential and the potential of the standard hydrogen electrode (thermodynamic scale of redox potentials), the faster the kinetics of the reduction reaction will be. Ni(acac)2 thermally decomposes at ≈230 °C (ref. 39) while Pt(acac)2 at ≈160 °C.47 As a consequence, in the same medium at temperatures around 220–230 °C, the Pt precursor is decomposed and reduced faster and before Ni, resulting in the formation of a Pt nucleus. Then, once Ni reduction occurs, Ni atoms settle on the Pt nuclei surface, forming a shell. This phenomenon has already been observed by Chen et al. with the NiRu system,48 who overcame it by using a strong reducing agent. In addition, we identified temperature as the second key parameter. Temperature is a well-known parameter in bulk alloy synthesis. Solid solutions in alloys such as Ni–Pt can only be obtained if annealing treatments at a sufficiently high temperature are carried out, for atomic diffusion to be effective. On this basis, we have compiled in Fig. 3 literature data on the synthesis of various bimetallic nanoalloys through the colloidal route with a demonstrated solid solution phase (2–10 nm in diameter) and plotted their synthesis temperature against the standard reduction potential difference (in absolute values) between the two components of the nanoalloy. As a general feature, the higher the difference in the redox potentials ΔE0, the higher the temperature necessary for nucleating a solid solution, Tnuc. The nature of the ligands present in the metallic precursors is also found to impact Tnuc. The groups bonded to metal cations have indeed different inductive effects depending on their nature (acetylacetonate, sulfate, nitrate, etc.) and induce different apparent charges on the cation, involving a variation in its redox potential.
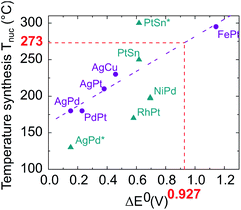 | ||
| Fig. 3 Proposed temperature synthesis for alloying different elements versus the difference in their reduction potentials ΔE0. Purple circles: acetyl or acetylacetonate metallic precursor family (AgPd,49 PdPt,50 AgPt (unpublished work), AgCu,51 FePt52). Blue triangles: metallic precursors with different natures; nitrate (AgPd*53), chlorate (RhPt,54 PtSn solid solution and PtSn* ordered compound55), sulfate (NiPd56).The value of ΔE0 equal to 0.927 depicted in red corresponds to the NiPt case. | ||
The synthesis depends on three variables: the apparent redox potential difference of the metal cations in the precursors, the reducing power of the reductant and the temperature. Two parameters are fixed: the apparent redox potential induced by groups bonded to metal cations and the reducing force of the reductant; considering only data from synthesis with acetyl or acetylacetonate metallic precursors reduced by a mild reducing agent, which we use in our procedure (purple dots in Fig. 3), a linear dependence emerges between ΔE0 and Tnuc, as outlined by the purple fitting dashed line.
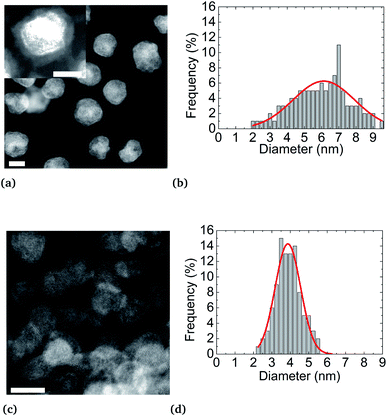
Using this linear fit, we infer that the synthesis temperature of a Ni–Pt nanoalloy should be close to 270 °C, knowing that the difference between the standard reduction potentials of platinum and nickel is equal to ΔE0 = 0.927 V. Such synthesis conditions are achievable since the decomposition temperature of Ni(acac)2 and Pt(acac)2 is below this temperature. We thus decided to increase the reaction temperature. However, to prevent the formation of Pt nuclei, it is necessary to introduce both metallic precursors at the same time, at the working temperature. A “hot injection” process has thus been designed, where solutions of both metallic precursors are rapidly injected in the reaction media. On this basis we proceeded as follows. We performed two new syntheses of Ni3Pt nanoparticles, one at 200 °C in 10 mL of benzyl ether (see Fig. 4a) and the other at 280 °C in a large quantity of solvent (70 mL), to limit the temperature drop when injecting “cold” precursors (see Fig. 4b).
STEM-HAADF analyses reveal a core (Pt)–shell (Ni) structure for the nanoparticles synthesized at 200 °C. However, as expected, synthesis at 280 °C results in nanoparticles with a monotonous HAADF contrast, indicating an alloyed state (Fig S4b of ESI†). Furthermore, as already mentioned,57 higher synthesis temperature has the effect of activating particle nucleation, resulting in an improvement of the size monodispersity and narrowness peaking at d = (3.9 ± 0.7) nm in diameter against d = (6.2 ± 3.5) nm for the synthesis at 200 °C, for the same reaction yields. After NP synthesis and their centrifugation, the supernatant obtained is colorless while the metal precursors are colored (green for Ni(acac)2 and yellow for Pt(acac)2). This evidences the full consumption of metal precursors during the synthesis. Moreover, regardless of their state (alloy or a core–shell), NPs are coated by an organic layer. This coating is shown in the inset of Fig. 4a. The dense coating is approximately 1 nm thick and uniformly covers the NPs. Oleylamine CH3(CH2)7CH = CH(CH2)8NH2 and oleic acid CH3(CH2)7CH = CH(CH2)7COOH molecules are both 2 nm (ref. 58 and 59) long, in their so-called “linear” configurations. These molecules can fold back at their double bond, located close to their center, thus reducing their apparent length to about 1 nm. This covering may be due to NPs drying on the TEM copper grid. We can deduce that an effective uniform surfactant monolayer hangs on the NP surface.
3 Results and discussion
Next, a series of samples with targeted compositions, Ni3Pt, NiPt and NiPt3, were synthesized by adjusting Ni![[thin space (1/6-em)]](https://www.rsc.org/images/entities/char_2009.gif) :
:![[thin space (1/6-em)]](https://www.rsc.org/images/entities/char_2009.gif) Pt ratios and processing the hot injection at 280 °C, followed by a temperature drop at 275 °C. In the following discussion, the different samples are named A for Ni-rich, B for equiatomic composition and C for Pt-rich NPs. Their characterization by TEM techniques and PXRD is presented in Table 1, Fig. 5 and 7, with details in the ESI (Fig. S5, S6 and Table S1†).
Pt ratios and processing the hot injection at 280 °C, followed by a temperature drop at 275 °C. In the following discussion, the different samples are named A for Ni-rich, B for equiatomic composition and C for Pt-rich NPs. Their characterization by TEM techniques and PXRD is presented in Table 1, Fig. 5 and 7, with details in the ESI (Fig. S5, S6 and Table S1†).
| NixPt1−x | x | Particle size (nm) |
|---|---|---|
| A | 0.74 ± 0.04 | 3.9 ± 0.7 |
| B | 0.56 ± 0.06 | 4.1 ± 0.7 |
| C | 0.32 ± 0.07 | 4.8 ± 0.7 |
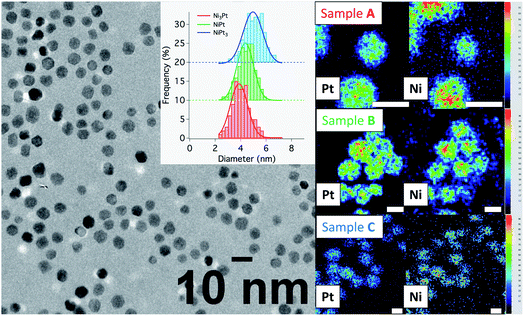
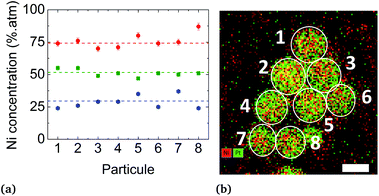
Conventional TEM images of as-synthesized NPs show crystallites with spherical shape and an average diameter around 4 nm for all of them. EDX measurements using the Kα line of Ni and Lα line of Pt have been performed on different areas of the TEM grids in a statistical way (Fig. 5). Average values of the chemical compositions extracted from the spectra indicate that chemical compositions are very close to the target stoichiometries 1![[thin space (1/6-em)]](https://www.rsc.org/images/entities/char_2009.gif) :
:![[thin space (1/6-em)]](https://www.rsc.org/images/entities/char_2009.gif) 3, 1
3, 1![[thin space (1/6-em)]](https://www.rsc.org/images/entities/char_2009.gif) :
:![[thin space (1/6-em)]](https://www.rsc.org/images/entities/char_2009.gif) 1 and 3
1 and 3![[thin space (1/6-em)]](https://www.rsc.org/images/entities/char_2009.gif) :
:![[thin space (1/6-em)]](https://www.rsc.org/images/entities/char_2009.gif) 1 (see Table 1), due to the total precursor consumption during the reaction. Furthermore, whatever the targeted composition, EDX chemical mappings display very little composition variation from a NP to another as shown in Fig. 6, demonstrating the capability of our synthesis procedure in controlling both the average and the dispersion of the NP composition.
1 (see Table 1), due to the total precursor consumption during the reaction. Furthermore, whatever the targeted composition, EDX chemical mappings display very little composition variation from a NP to another as shown in Fig. 6, demonstrating the capability of our synthesis procedure in controlling both the average and the dispersion of the NP composition.
The solid solution state of the particles is attested by both EDX and diffraction analyses. EDX chemical mappings presented in Fig. 5, 6 and EDX spectra in Fig. S5 (ESI)† show that both Ni and Pt species are uniformly spatially distributed in the volume and at the surface of the particles in all cases. In addition, this technique shows the absence of an oxide layer at the NP surface due to the homogeneous protective organic layer provided by the surfactants.
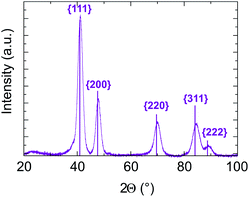
In addition, in all cases, electron diffraction and PXRD (see Fig. S6 and Table 1 of ESI†) reveal that the particles are crystallized in a disordered FCC structure. No chemical order on the FCC lattice was observed, which is expected to be the stable state at equilibrium in the bulk system. As an example, PXRD data for sample B with targeted equiatomic composition are presented in Fig. 7. Diffraction peaks are well identified as being related to (111), (200), (220), (311) and (222) of the NiPt FCC disordered structure. The lattice parameter is calculated to be (0.380 ± 0.003) nm and the crystalline domain size is measured to be (4.5 ± 0.5) nm which is in good agreement with its apparent size in TEM images (Table 1). Therefore, the as-obtained NPs seem to be ≪one grain≫ alloy nanoparticles.
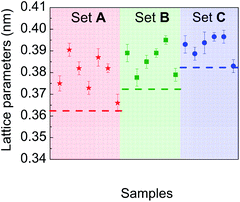
Particular attention was paid to comparing the measured lattice parameters with those of the corresponding bulk materials, for each chemical composition experimentally investigated. Fig. 8 is a plot of lattice parameter data deduced from electron diffraction patterns recorded on different sets of particles in samples A, B and C. Their comparison with reference data of the corresponding bulk materials with the same average composition shows a systematic expansion of the lattice parameters in the NPs whatever their composition.
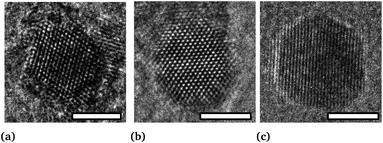
This expansion is verified by HRTEM analysis. The d-spacing between the planes (111) of particles, shown in Fig. 9, are equal to d111 (A) = 0.219 nm, d111 (B) = 0.225 nm and d111 (C) = 0.226 nm, corresponding to lattice parameters 0.379 nm, 0.389 nm and 0.391 nm, respectively. Moreover, it is important to note that there are no defects in the NPs (such as dislocations) or crystal twinning that could explain this lattice parameter expansion.60
This expansion is also confirmed by XRD on sample B (Fig. 7). Usually, contraction of lattice parameters is observed at the nanoscale due to surface strains.61–63 Here, surface stress is compensated by the presence of surfactants (to our knowledge, there is no study on the dependence of the lattice parameters on the surfactants covering nanoparticles by the colloidal synthesis route).
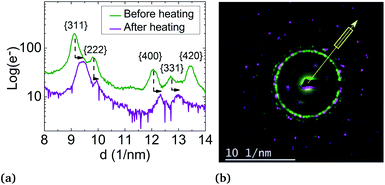
But, in order to capture the influence of surfactants on the lattice parameters, sample A NPs (Ni3Pt targeted composition) with a = (0.373 ± 0.003) nm were deposited on a SiN TEM grid covered by multi-walled carbon nanotubes (MWCNTs). MWCNTs are known for their high thermal conductivity and stability at high temperature,64 properties useful for our experiment. The NPs were heated in situ in ZEISS-LIBRA 200 MC microscope, in vacuum. Thanks to the heating holder, NPs were heated at 800 °C (≈39 °C min−1) and cooled down to room temperature (≈46 °C min−1). We have observed experimentally that when the temperature rose rapidly, the surfactants desorbed, pyrolyzed and not polymerized (see Fig. S7 in the ESI†). In addition, the temperature was decreased to avoid the incorporation of carbon from the surfactants into the NPs during the descent. Lattice parameter evolution is monitored by electron diffraction. In Fig. 8, electron diffraction patterns before and after the temperature increase are compared at room temperature, a decrease of the lattice parameter around 2.5% is observed (Fig. 10).
The lattice parameter decreases up to the bulk's value and not below, as provided in the literature. However, this can also be explained by the residual presence of surfactants on the NP surface or by the diffusion of carbon atoms in the particles readily solubilized by the nickel.
This result shows the first evidence of the influence of surfactants on lattice parameters. A detailed study of the impact of the surfactant nature versus metallic atoms on the expansion of the lattice parameter is underway.
4 Experimental procedure
4.1 NixPt1−x synthesis
To prevent contamination, all laboratory glassware was washed with aqua regia (nitric acid![[thin space (1/6-em)]](https://www.rsc.org/images/entities/char_2009.gif) :
:![[thin space (1/6-em)]](https://www.rsc.org/images/entities/char_2009.gif) hydrochloric acid 1
hydrochloric acid 1![[thin space (1/6-em)]](https://www.rsc.org/images/entities/char_2009.gif) :
:![[thin space (1/6-em)]](https://www.rsc.org/images/entities/char_2009.gif) 3) for (at least) five hours and rinsed with large amounts of distilled water, dichloromethane (DCM) and acetone. Syntheses were carried out under an argon blanket. Commercial reagents were used without purification. Typically, to obtain spherical Ni3Pt nanoparticles with 4 nm in size, 70 mL of benzyl ether (BE) (Sigma Aldrich, 99%), 1.22 mmol of oleylamine (OAm) (Acros Organics, 80–90%) and 1.26 mmol of oleic acid (OAc) (Acros Organics, 80–90%) were added to a 100 mL round-bottom flask with a PTFE coated magnetic stir bar. The mixture was purged by 3 vacuum/argon cycles and heated for 10 min at 100 °C, to remove any trace of water and prevent particle oxidation. After 10 min, the temperature was raised and kept at 280 °C. At this temperature, a solution of 0.33 mmol of Ni(acac)2 (Aldrich, 95%), 0.075 mmol of HDiol (TCI, 98%), 0.61 mmol of OAm, 0.63 mmol of OAc dissolved in a minimal amount of BE (1.3 mL) and a solution of 0.17 mmol of Pt(acac)2, 0.075 mmol of HDiol, 0.61 mmol of OAm, and 0.63 mmol of OAc dissolved in 1.3 mL of BE were simultaneously and quickly added (using two different syringes at the same time) to the round-bottom flask, under vigorous stirring. The solution turned instantly black, which was proof of NP nucleation. The suspension was kept at 280 °C for 2 min before being cooled down to room temperature under an argon blanket. The suspension was purified by adding 20 mL of ethanol (EtOH) for 10 mL of the mixture and was centrifuged at 10
3) for (at least) five hours and rinsed with large amounts of distilled water, dichloromethane (DCM) and acetone. Syntheses were carried out under an argon blanket. Commercial reagents were used without purification. Typically, to obtain spherical Ni3Pt nanoparticles with 4 nm in size, 70 mL of benzyl ether (BE) (Sigma Aldrich, 99%), 1.22 mmol of oleylamine (OAm) (Acros Organics, 80–90%) and 1.26 mmol of oleic acid (OAc) (Acros Organics, 80–90%) were added to a 100 mL round-bottom flask with a PTFE coated magnetic stir bar. The mixture was purged by 3 vacuum/argon cycles and heated for 10 min at 100 °C, to remove any trace of water and prevent particle oxidation. After 10 min, the temperature was raised and kept at 280 °C. At this temperature, a solution of 0.33 mmol of Ni(acac)2 (Aldrich, 95%), 0.075 mmol of HDiol (TCI, 98%), 0.61 mmol of OAm, 0.63 mmol of OAc dissolved in a minimal amount of BE (1.3 mL) and a solution of 0.17 mmol of Pt(acac)2, 0.075 mmol of HDiol, 0.61 mmol of OAm, and 0.63 mmol of OAc dissolved in 1.3 mL of BE were simultaneously and quickly added (using two different syringes at the same time) to the round-bottom flask, under vigorous stirring. The solution turned instantly black, which was proof of NP nucleation. The suspension was kept at 280 °C for 2 min before being cooled down to room temperature under an argon blanket. The suspension was purified by adding 20 mL of ethanol (EtOH) for 10 mL of the mixture and was centrifuged at 10![[thin space (1/6-em)]](https://www.rsc.org/images/entities/char_2009.gif) 000 rpm for 20 min. The supernatant was separated and the precipitate was washed again with EtOH and centrifuged. The precipitate was redispersed in 30 mL of DCM (few drops of OAc might be added to favor its redispersion). By controlling the Ni
000 rpm for 20 min. The supernatant was separated and the precipitate was washed again with EtOH and centrifuged. The precipitate was redispersed in 30 mL of DCM (few drops of OAc might be added to favor its redispersion). By controlling the Ni![[thin space (1/6-em)]](https://www.rsc.org/images/entities/char_2009.gif) :
:![[thin space (1/6-em)]](https://www.rsc.org/images/entities/char_2009.gif) Pt initial ratio during the synthesis, this method provides Ni3Pt, NiPt and NiPt3 NPs. All syntheses were performed at a constant total metal concentration equal to 0.5 mmol, divided between the Ni and Pt precursors to obtain Ni3Pt (3
Pt initial ratio during the synthesis, this method provides Ni3Pt, NiPt and NiPt3 NPs. All syntheses were performed at a constant total metal concentration equal to 0.5 mmol, divided between the Ni and Pt precursors to obtain Ni3Pt (3![[thin space (1/6-em)]](https://www.rsc.org/images/entities/char_2009.gif) :
:![[thin space (1/6-em)]](https://www.rsc.org/images/entities/char_2009.gif) 1), NiPt (1
1), NiPt (1![[thin space (1/6-em)]](https://www.rsc.org/images/entities/char_2009.gif) :
:![[thin space (1/6-em)]](https://www.rsc.org/images/entities/char_2009.gif) 1) and NiPt3 (1
1) and NiPt3 (1![[thin space (1/6-em)]](https://www.rsc.org/images/entities/char_2009.gif) :
:![[thin space (1/6-em)]](https://www.rsc.org/images/entities/char_2009.gif) 3).
3).
4.2 Nanoparticle characterization
As-synthesized NPs were characterized by the Transmission Electron Microscopy (TEM) technique. A drop of colloidal suspension was deposited and dried on a copper TEM grid. Size distribution was measured using FEI-CM 20 TEM (200 kV) and JEOL USA JEM-1400 (120 kV) TEM instruments. A population of 500 particles in 5 distinct zones on the TEM grid was analysed and counted with Image J software. High-Resolution Transmission Electron Microscopy (HRTEM), High-Angle Annular Dark-Field imaging (STEM-HAADF) and electron diffraction (ED) were performed on a ZEISS-LIBRA 200 MC TEM to confirm the alloy state of the NPs. Chemical composition was also confirmed using Energy-Dispersive X-ray spectroscopy (EDX) (diode Brüker) using the NiPt bulk reference alloy. To support the results, UHRSTEM and chemical mapping were performed using a Titan G2 Cs-corrected FEI TEM operating at 200 kV on individual particles. The crystal structure of the core–shell and the alloyed sample were confirmed by X-ray diffraction (XRD) using Cu-Kα rays and 2θ scattering angle between 20° and 100°, in order to validate the TEM nanoparticle characterization protocol.5 Conclusion
In this work, we have developed a new colloidal procedure for the synthesis of NixPt1−x nanoalloys with controlled size (nearly 4 nm) and chemical composition. Our study demonstrates the versatility of this synthesis method along with the key role of temperature synthesis in true alloy formation as a function of the redox potentials of the constituent elements. The chemical composition and solid solution FCC structure of the nanoalloys are demonstrated, over the whole range of chemical compositions investigated, by combining different TEM imaging modes, electron and X-ray diffraction techniques as well as EDX spectroscopy and mappings. We already checked the suitability of these new catalyst particles for the successive CVD synthesis of SWCNTs thanks to preliminary tests. A detailed study of the impact of the alloy composition on the structural characteristics of these SWCNTs is underway. Furthermore, this new synthesis procedure opens new avenues for catalysis, which are presently under investigation. It can be applied to a wide range of metallic alloys. Finally, we obtained the first evidence that surfactants capping the particles may impact their lattice parameters. Systematic measurements combined with in situ experiments are underway to clarify the influence of the surfactant on such disordered NPs.Conflicts of interest
There are no conflicts to declare.Acknowledgements
We are indebted to Hakim Amara and Christophe Bichara for fruitful and inspiring discussions as well as for their constant support to this work. We also thank Alice Castan, Salomé Forel, Jean-Sébastien Mérot, Sandra Mazerat and Diana Dragoe for their assistance all through this work. The authors thank ANR GiANT (No. ANR-18-CE09-0014-04) and ARF “Nano” of ONERA for financing this work. The present work has benefited from the electron microscopy facility of Imagerie-Gif, (http://www.i2bc.paris-saclay.fr), member of IBiSA (http://www.ibisa.net), supported by “France-BioImaging” (ANR-10-INBS-04-01), and the Labex “Saclay Plant Science” (ANR-11-IDEX-0003-02). HRSTEM-EDX study was carried out within the MATMECA consortium, supported by the ANR-10-EQPX-37 contract and has benefited from the facilities of the Laboratory MSSMat (UMR CNRS 8579), CentraleSupélec.Notes and references
- G. Cao and Y. Wang, Nanostructures and Nanomaterials: Synthesis, Properties, and Applications, World Scientific, 2011 Search PubMed.
- R. Ferrando, J. Jellinek and R. L. Johnston, Chem. Rev., 2008, 108, 845–910 CrossRef CAS PubMed.
- S. K. Ghosh and T. Pal, Chem. Rev., 2007, 107, 4797–4862 CrossRef CAS PubMed.
- S. Neatu, J. A. Maciá-Agullò, P. Concepciòn and H. Garcia, J. Am. Chem. Soc., 2014, 136, 15969–15976 CrossRef CAS PubMed.
- C. L. Bracey, P. R. Ellis and G. J. Hutchings, Chem. Soc. Rev., 2009, 38, 2231–2243 RSC.
- N. Cao, J. Su, W. Luo and G. Cheng, Int. J. Hydrogen Energy, 2014, 39, 9726–9734 CrossRef CAS.
- G. Niu, M. Zhou, X. Yang, J. Park, N. Lu, J. Wang, M. J. Kim, L. Wang and Y. Xia, Nano Lett., 2016, 16, 3850–3857 CrossRef CAS PubMed.
- M. Li, F. Yang, L. Ding, X. Liu, Z. Zhang, D. Zhang, X. Zhao, J. Yang and Y. Li, Carbon, 2017, 118, 485–492 CrossRef CAS.
- M. He, Y. Magnin, H. Amara, H. Jiang, H. Cui, F. Fossard, A. Castan, E. Kauppinen, A. Loiseau and C. Bichara, Carbon, 2017, 113, 231–236 CrossRef CAS.
- M. He, Y. Magnin, H. Jiang, H. Amara, E. I. Kauppinen, A. Loiseau and C. Bichara, Nanoscale, 2018, 10, 6744–6750 RSC.
- X. Zhao, F. Yang, J. Chen, L. Ding, X. Liu, F. Yao, M. Li, D. Zhang, Z. Zhang, X. Liu, J. Yang, K. Liu and Y. Li, Nanoscale, 2018, 10, 6922–6927 RSC.
- H. Takezaki, T. Inoue, R. Xiang, S. Chiashi and S. Maruyama, Diamond Relat. Mater., 2019, 96, 160–166 CrossRef CAS.
- A. Loiseau, P. Launois-Bernede, P. Petit, S. Roche and J. Salvetat, Understanding Carbon Nanotubes: From Basics to Applications, Springer, Berlin, Heidelberg, 2006 Search PubMed.
- A. Moisala, A. G. Nasibulin and E. I. Kauppinen, J. Phys.: Condens. Matter, 2003, 15, S3011 CrossRef CAS.
- M. He, H. Amara, H. Jiang, J. Hassinen, C. Bichara, R. H. Ras, J. Lehtonen, E. I. Kauppinen and A. Loiseau, Nanoscale, 2015, 7, 20284–20289 RSC.
- J. M. Aguiar-Hualde, Y. Magnin, H. Amara and C. Bichara, Carbon, 2017, 120, 226–232 CrossRef CAS.
- F. Ding, A. Rosén and K. Bolton, J. Chem. Phys., 2004, 121, 2775–2779 CrossRef CAS PubMed.
- H. Amara, C. Bichara and F. Ducastelle, Phys. Rev. Lett., 2008, 100, 1–4 CrossRef PubMed.
- H. Amara, J. M. Roussel, C. Bichara, J. P. Gaspard and F. Ducastelle, Phys. Rev. B, 2009, 79, 1–17 CrossRef.
- M. Diarra, A. Zappelli, H. Amara, F. Ducastelle and C. Bichara, Phys. Rev. Lett., 2012, 109, 1–5 CrossRef PubMed.
- Y. Magnin, A. Zappelli, H. Amara, F. Ducastelle and C. Bichara, Phys. Rev. Lett., 2015, 115, 1–5 CrossRef PubMed.
- D. E. Dahmani, M. C. Cadeville, J. M. Sanchez and J. L. Moran-Lopez, Phys. Rev. Lett., 1985, 55, 1208–1211 CrossRef PubMed.
- A. R. Denton and N. W. Ashcroft, Phys. Rev. A: At., Mol., Opt. Phys., 1991, 43, 3161–3164 CrossRef CAS PubMed.
- P. Sangpour, O. Akhavan and A. Z. Moshfegh, Appl. Surf. Sci., 2007, 253, 7438–7442 CrossRef CAS.
- B. Zheng, Y. Sun, J. Wu, L. Yuan, X. Wu, K. Huang and S. Feng, J. Nanopart. Res., 2017, 19, 50 CrossRef.
- C. Langlois, D. Alloyeau, Y. Le Bouar, A. Loiseau, T. Oikawa, C. Mottet and C. Ricolleau, Faraday Discuss., 2008, 138, 375–391 RSC.
- P. K. Sahoo, S. S. Kalyan Kamal, M. Premkumar, T. Jagadeesh Kumar, B. Sreedhar, A. K. Singh, S. K. Srivastava and K. Chandra Sekhar, Int. J. Refract. Met. Hard Mater., 2009, 27, 784–791 CrossRef CAS.
- N. Soultanidis, W. Zhou, C. J. Kiely and M. S. Wong, Langmuir, 2012, 28, 17771–17777 CrossRef CAS PubMed.
- S. Carenco, C. Boissière, L. Nicole, C. Sanchez, P. Le Floch and N. Mézailles, Chem. Mater., 2010, 22, 1340–1349 CrossRef CAS.
- C. Wang, M. Chi, G. Wang, D. van der Vliet, D. Li, K. More, H.-H. Wang, J. A. Schlueter, N. M. Markovic and V. R. Stamenkovic, Adv. Funct. Mater., 2011, 21, 147–152 CrossRef CAS.
- K. Okitsu, M. Ashokkumar and F. Grieser, J. Phys. Chem. B, 2005, 109, 20673–20675 CrossRef CAS PubMed.
- J. H. Bang and K. S. Suslick, Adv. Mater., 2010, 22, 1039–1059 CrossRef CAS PubMed.
- L. Catala, T. Gacoin, J. P. Boilot, É. Rivière, C. Paulsen, E. Lhotel and T. Mallah, Adv. Mater., 2003, 15, 826–829 CrossRef CAS.
- A. Castan, S. Forel, L. Catala, I. Florea, F. Fossard, F. Bouanis, A. Andrieux-Ledier, S. Mazerat, T. Mallah, V. Huc, A. Loiseau and C. S. Cojocaru, Carbon, 2017, 123, 583–592 CrossRef CAS.
- H. Kobayashi, K. Kusada and H. Kitagawa, Acc. Chem. Res., 2015, 48, 1551–1559 CrossRef CAS PubMed.
- L. M. Lacroix, C. Gatel, R. Arenal, C. Garcia, S. Lachaize, T. Blon, B. Warot-Fonrose, E. Snoeck, B. Chaudret and G. Viau, Angew. Chem., Int. Ed., 2012, 51, 4690–4694 CrossRef CAS PubMed.
- C. Murray, S. Sun, H. Doyle and T. Betley, MRS Bull., 2001, 26, 985–991 CrossRef CAS.
- S. Mourdikoudis and L. M. Liz-Marzán, Chem. Mater., 2013, 25, 1465–1476 CrossRef CAS.
- K. Ahrenstorf, O. Albrecht, H. Heller, A. Kornowski, D. Görlitz and H. Weller, Small, 2007, 3, 271–274 CrossRef CAS PubMed.
- K. Ahrenstorf, H. Heller, A. Kornowski, J. A. C. Broekaert and H. Weller, Adv. Funct. Mater., 2008, 18, 3850–3856 CrossRef CAS.
- G. M. Leteba and C. I. Lang, Sensors, 2013, 13, 10358–10369 CrossRef CAS PubMed.
- C. Cui, L. Gan, M. Heggen, S. Rudi and P. Strasser, Nat. Mater., 2013, 12, 765–771 CrossRef CAS PubMed.
- L. Gan, S. Rudi, C. Cui, M. Heggen and P. Strasser, Small, 2016, 3189–3196 CrossRef CAS PubMed.
- Z. Peng and H. Yang, Nano Today, 2009, 4, 143–164 CrossRef CAS.
- Q. Zhang, K. Kusada, D. Wu, T. Yamamoto, T. Toriyama, S. Matsumura, S. Kawaguchi, Y. Kubota and H. Kitagawa, Nat. Commun., 2018, 9, 510 CrossRef PubMed.
- Q. Zhang, K. Kusada, D. Wu, N. Ogiwara, T. Yamamoto, T. Toriyama, S. Matsumura, S. Kawaguchi, Y. Kubota, T. Honma and H. Kitagawa, Chem. Sci., 2019, 10, 5133–5137 RSC.
- N. K. Sahu, A. Prakash and D. Bahadur, Dalton Trans., 2014, 43, 4892–4900 RSC.
- G. Chen, S. Desinan, R. Rosei, F. Rosei and D. Ma, Chem.–Eur. J., 2012, 18, 7925–7930 CrossRef CAS PubMed.
- S. Zhang, Ö. Metin, D. Su and S. Sun, Angew. Chem., Int. Ed., 2013, 52, 3681–3684 CrossRef CAS PubMed.
- K. L. More, Y. Liu, V. Mazumder, M. Chi, J. D. Henao, S. Sun and S. Soled, Chem. Mater., 2011, 23, 4199–4203 CrossRef.
- J. Sopoušek, J. Pinkas, P. Brož, J. Buršík, V. Vykoukal, D. Škoda, A. Stýskalík, O. Zobač, J. Vřešťál, A. Hrdlička and J. Šimbera, J. Nanomater., 2014, 2014, 1–13 CrossRef.
- K. E. Elkins, T. S. Vedantam, J. P. Liu, H. Zeng, S. Sun, Y. Ding and Z. L. Wang, Nano Lett., 2003, 3, 1647–1649 CrossRef CAS.
- C. L. Lee, Y. C. Huang and L. C. Kuo, Electrochem. Commun., 2006, 8, 1021–1026 CrossRef CAS.
- S. Alayoglu and B. Eichhorn, J. Am. Chem. Soc., 2008, 130, 17479–17486 CrossRef CAS PubMed.
- X. Wang, L. Altmann, J. Stover, V. Zielasek, M. Bauer, K. Al-Shamery, H. Borchert, J. Parisi and J. Kolny-Olesiak, Chem. Mater., 2013, 25, 1400–1407 CrossRef CAS.
- F. Ai, A. Yao, W. Huang, D. Wang and X. Zhang, Phys. E, 2010, 42, 1281–1286 CrossRef CAS.
- N. T. Thanh, N. Maclean and S. Mahiddine, Chem. Rev., 2014, 114, 7610–7630 CrossRef CAS PubMed.
- L. Zhang, R. He and H. C. Gu, Appl. Surf. Sci., 2006, 253, 2611–2617 CrossRef CAS.
- J. Borges, J. A. Ribeiro, E. M. Pereira, C. A. Carreira, C. M. Pereira and F. Silva, J. Colloid Interface Sci., 2011, 358, 626–634 CrossRef CAS PubMed.
- I. J. Gomez, B. Arnaiz, M. Cacioppo, F. Arcudi and M. Prato, J. Mater. Chem. B, 2018, 6, 5540–5548 RSC.
- L. D. Marks, Rep. Prog. Phys., 1994, 57, 603–649 CrossRef CAS.
- J. Wu, P. Li, Y.-T. F. Pan, S. Warren, X. Yin and H. Yang, Chem. Soc. Rev., 2012, 41, 8066 RSC.
- S. Xiong, W. Qi, B. Huang and M. Wang, ChemPhysChem, 2011, 12, 1317–1324 CrossRef CAS PubMed.
- P. Kim, L. Shi, A. Majumdar and P. L. McEuen, Phys. Rev. Lett., 2001, 87, 215502 CrossRef CAS PubMed.
Footnotes |
| † Electronic supplementary information (ESI) available. See DOI: 10.1039/d0na00450b |
| ‡ Present address: Centre Interdisciplinaire de Nanoscience de Marseille, CNRS, U. Aix-Marseille, CNRS, Aix-Marseille, 13009, France |
| This journal is © The Royal Society of Chemistry 2020 |

