DOI:
10.1039/C9NA00348G
(Paper)
Nanoscale Adv., 2019,
1, 4052-4066
The role of nanoparticle size and ligand coverage in size focusing of colloidal metal nanoparticles†
Received
3rd June 2019
, Accepted 5th September 2019
First published on 9th September 2019
Abstract
Controlling the size distribution of nanoparticles is important for many applications and typically involves the use of ligands during synthesis. In this study, we show that the mechanism of size focusing involves a dependence of the growth rate on the size of the nanoparticles and the ligand coverage on the surface of the nanoparticles. To demonstrate these effects, we used in situ small angle X-ray scattering (SAXS) and population balance kinetic modeling (PBM) to investigate the evolution of size distribution during the synthesis of colloidal Pd metal nanoparticles. Despite temporal overlap of nucleation and growth, our in situ SAXS show size focusing of the distribution under different synthetic conditions (different concentrations of metal and ligand as well as solvent type). To understand the mechanism of size focusing using PBM, we systematically studied how the evolution of the nanoparticle size distribution is affected by nucleation rate, and dependence of the growth rate constant on ligand surface coverage, and size of the nanoparticles. We show that continuous nucleation contributes to size defocusing. However, continuous nucleation results in different reaction times for the nanoparticle population leading to time and size-dependent ligand surface coverage. Using density functional theory (DFT) calculations and Brønsted–Evans–Polanyi relations, we show that as the population grows, larger nanoparticles grow more slowly than smaller ones due to lower intrinsic activity and higher ligand coverage on the surface. Therefore, despite continuous nucleation, the faster growth of smaller nanoparticles in the population leads to size focusing. The size focusing behaviour (due to faster growth of smaller nanoparticles) was found to be model independent and similar results were demonstrated under different nucleation and growth pathways (e.g. growth via ion reduction on the surface and/or monomer addition). Our results provide a microscopic connection between kinetics and thermodynamics of nanoparticle growth and metal–ligand binding, and their effect on the size distribution of colloidal nanoparticles.
Introduction
Nanoparticles are becoming key building blocks for many applications. Colloidal synthesis offers a versatile bottom-up approach and has been constantly advancing over the past few decades, with better control over size, shape, composition, super-lattice structure and consequently the nanoparticles' properties (catalytic, electronic, optical, etc.).1–6 For example, recent synthetic methods enabled fabrication of colloidal nanoparticles with different sizes by simply altering the reaction conditions (solvent, ligand, precursor, and synthesis temperature).7–11 However, since the size distribution of the nanoparticles is often key to their specific, desired physical and chemical properties,12–18 a fundamental understanding of how to control the nucleation and growth is key to enable predictive synthesis of nanoparticles with the desired properties. To date, different models and mechanisms have been proposed to describe the nucleation and growth of colloidal nanoparticles as well as size focusing and defocusing.19–25 The classical LaMer model which has been used to describe the formation of various nanoparticles, postulates a burst nucleation followed by diffusion-controlled growth of existing nuclei, where no additional nuclei form during the growth step.26,27 In this model (and other models based on LaMer's),24,25 the temporal separation of nucleation and growth and the diffusion-controlled growth result in narrowing of the size distribution to near monodisperse. Other mechanisms such as oxidative etching (dissolution process due to the presence of structural defects)28,29 and digestive ripening30–32 (transformation of polydisperse nanoparticles into monodisperse ones, where ligands play major role in the etching process) could also result in controlling the morphology and focusing of the size distribution.
Recent breakthroughs in advanced in situ characterization techniques, such as in situ scanning transmission electron microscopy (STEM) and in situ small-angle X-ray scattering (SAXS) have allowed direct observation of the nanoparticles nucleation and growth7,33–38 and provided key insights on the underlying mechanisms.7,39–41 Additionally, the direct observation during synthesis can provide evidence for, or against the central hypotheses in the different proposed nucleation and growth models. For example, in contrast to the LaMer burst nucleation, temporal overlap of nucleation and growth has been observed in the synthesis of several colloidal nanoparticles including Ir,42,43 Pd,7,40,44,45 Rh,46 and CdSe.47 Moreover, growth was shown to be reaction- instead of diffusion-limited while the final nanoparticles had a narrow size distribution.7,22,48,49 Therefore, it can be seen that the conditions of burst of nucleation followed by diffusion-controlled growth in the LaMer model are neither sufficient, nor necessary for the synthesis of narrow size distribution nanoparticles. In fact, Watzky and Finke developed an important minimalistic two step mechanism48,49 where the synthesis follows a slow continuous nucleation and fast autocatalytic growth and has been successfully used to describe the kinetics (but not size distribution) in different systems.42,50,51 However, it is not well understood how continuous nucleation, and/or the growth not being diffusion limited, lead to nanoparticles with narrow size distribution. One of the important factors affecting the nucleation and growth kinetics, and consequently size distribution,52 is the presence of ligands53 but few models explicitly account for the ligand–metal interactions.7,22,47,54 In our recent study, using in situ SAXS and kinetic modeling, we showed that the binding of ligands with both the metal complex and nanoparticle surface control the rates of nucleation and growth, and accounting for the ligand–metal binding was critical to predict the evolution of average diameter and concentration of nanoparticles.7,55 While significant progress has been made in the field, no theoretical framework could yet unravel the non-trivial role of capping ligands in controlling the evolution of particle size distribution.
In this manuscript, we investigated the possible mechanisms leading to the focusing and defocusing of colloidal nanoparticle size distribution during the synthesis. We used in situ SAXS to measure the evolution of size, size distribution and concentration of Pd colloidal nanoparticles during synthesis. Using population balance modeling (PBM), we accounted for different possible nucleation and growth pathways and predicted the evolution of the particle size distribution. In addition, we systematically studied the effect of continuous nucleation on the size distribution and how size focusing could be achieved under the condition where nucleation overlaps with the nanoparticle growth. In order to describe the size focusing observed experimentally, our PBM results provide evidence for growth rate constant that strongly depends on ligand coverage. Specifically, we demonstrate that ligand surface coverage plays a key role in altering the activation energy of surface growth to slow down the growth on larger nanoparticles and allow size focusing. Additionally, our thermodynamic calculations show that the nanoparticle size can affect the enthalpy of surface growth, which leads to faster growth of smaller nanoparticles than larger ones and contribute to size focusing. Finally, we compared the contribution of different mechanisms involved in size focusing and the ligand surface coverage-dependent growth rate constant appeared to be the major factor in size focusing of Pd nanoparticles studied in this work.
Methodology
In situ Small Angle X-ray Scattering
In situ SAXS measurements were conducted at sector 12-ID-C at the Advanced Photon Source in Argonne National Laboratory. The synthesis of Pd nanoparticles was performed with different concentrations of Pd(OAc)2 ranging from 2.5 to 10 mM and trioctylphosphine (TOP) in pyridine or toluene and hexanol mixture (TOP![[thin space (1/6-em)]](https://www.rsc.org/images/entities/char_2009.gif) :Pd molar ratios = 1 and 2, solvent:hexanol = 1:1 by volume) at 100 °C under 300 rpm stirring. We note that using filtered solvents (filter with pore size of 2 μm) had no effect on the final nanoparticle size. 600 μL of 3 mL reaction solution was taken into a quartz capillary through the pump every few seconds for SAXS data collection, and then injected back into the reactor. The energy of incident X-ray and the exposure time were 18 keV and 0.1 s, respectively. SAXS spectra examples for the solvent, solvent + ligand, solvent + ligand + precursor, and Pd nanoparticles in pyridine (10 mM Pd(OAc)2 with TOP:Pd = 1) at different reaction time are shown in Fig. S1.† Detailed experimental and data analysis procedures can be found in previous reports.7,55
:Pd molar ratios = 1 and 2, solvent:hexanol = 1:1 by volume) at 100 °C under 300 rpm stirring. We note that using filtered solvents (filter with pore size of 2 μm) had no effect on the final nanoparticle size. 600 μL of 3 mL reaction solution was taken into a quartz capillary through the pump every few seconds for SAXS data collection, and then injected back into the reactor. The energy of incident X-ray and the exposure time were 18 keV and 0.1 s, respectively. SAXS spectra examples for the solvent, solvent + ligand, solvent + ligand + precursor, and Pd nanoparticles in pyridine (10 mM Pd(OAc)2 with TOP:Pd = 1) at different reaction time are shown in Fig. S1.† Detailed experimental and data analysis procedures can be found in previous reports.7,55
Ligand-mediated nanoparticle nucleation and growth reactions
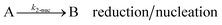
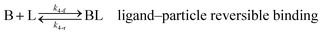
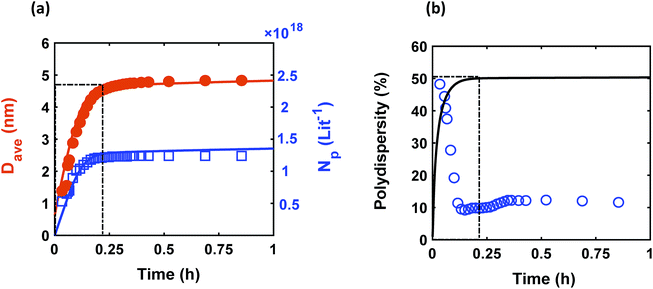
As shown in our previous work7 for the synthesis of Pd nanoparticles in different solvents (i.e. toluene and pyridine), trioctylphosphine (TOP) plays an important role in controlling the rates of both nucleation and growth. Specifically, we found that accounting for the reversible reactions of ligands with both the metal precursor and nanoparticle surface in the model is necessary to capture the evolution of average diameter and concentration of the nanoparticles.7 The model of ligand-mediated nanoparticle nucleation and growth is schematically shown in Fig. 1, and the corresponding reactions are presented below:| |  | (1) |
| |  | (2) |
| |  | (3) |
| |  | (4) |
k1-f and k1-r are the forward and reverse rate constants for ligand-precursor reversible binding, eqn (1). k2-nuc and k3-growth are the rate constants of reduction/nucleation, eqn (2), and autocatalytic surface growth, eqn (3), respectively. k4-f and k4-r are the forward and reverse rate constants for ligand–nanoparticle reversible binding, eqn (4). Herein, A and AL represent the kinetically active metal precursor (e.g. Pd(II)) and the ligand–metal complex (Pd(II)–TOP), respectively. Further, L is the capping ligand (here TOP); B the free Pd surface sites; and BL the surface sites capped by a ligand. In this model (reactions (1)–(4)), a slow continuous nucleation step overlaps with fast autocatalytic surface growth (i.e. growth through reduction of precursor on the nanoparticle surface) which follows Finke–Watzky's two-step model.48 Depending on the binding strength (AL, BL), the ligand affects the concentrations of the active precursor56 (A) and number of free surface sites (B), respectively, thereby controlling the rates of both the nucleation and surface growth. We note that the solvent (e.g. pyridine) can also act as a ligand and cover the surface of nanoparticles; however, pyridine is expected to be replaced by TOP via ligand exchange due to the stronger binding affinity of TOP towards the nanoparticle surface. Therefore, L in reaction (4) represents TOP, and the reaction represents a ligand exchange between L and the solvent. It is necessary to account for both association and dissociation reactions of the ligand binding and as we will discuss later in the text, the modeling results (average diameter and concentration of nanoparticles) are strongly affected by changing the k4-f indicating the ligand–nanoparticle binding (eqn (4)) is not at equilibrium. Consequently, the ligand surface coverage changes with time and reaches equilibrium only at the late stage of reaction. Recent studies have also shown that the ligand surface coverage is time-dependent and the equilibrium assumption does not hold true, in particular in the early stage of reaction.7,47,54 In these studies (for the synthesis of thiol-capped Au nanoparticles and TOP-capped CdSe), the reported ligand adsorption rate constant (k4-f) ranged from ∼2–25 m3 mol−1 h−1 (reaction temperature for the synthesis of Au and CdSe was 25 and 230 °C, respectively) which is in the same order of magnitude of our estimated values shown in this work (1.5–2.2 m3 mol−1 h−1) and previous work.47,54 Additionally, the ligand exchange reaction on the nanoparticle surface already covered by other coordinating ligands can be in the range of several minutes to hours.57,58
 |
| | Fig. 1 Schematic diagram of nanoparticle nucleation, growth, and surface capping. | |
We note that the process of nanoparticle nucleation and growth can include larger number of complex reactions (e.g. nucleation through AL, solvent–nanoparticle binding, growth by monomer addition). Our sensitivity analysis showed that reactions (1)–(4) constitute the minimal model required to capture the underlying kinetics of nucleation and growth in the presence of ligands.7 However, it is important to mention that while statistically less probable, a model with a different growth mode, specifically solution reduction followed by monomer addition to the nanoparticle surface, similar results were obtained as autocatalytic surface growth for all the cases considered in this work (details provided in the Results section and ESI†). Lastly, growth by agglomeration was not considered in the model since there was no evidence of agglomeration during the synthesis (as evident by the continuous increase in the concentration of nanoparticles from SAXS).
Population balance model (PBM)
To predict the evolution of particle size distribution, it is required to develop a model capable of tracking the properties of different sized nanoparticles. PBM explicitly identifies the nanoparticles of different sizes during synthesis and therefore allows for predicting the particle size distribution (concentration of nanoparticles, average diameter, and polydispersity).22,47,59 As the nanoparticle surface area and surface coverage of ligands evolve with time, we can identify the nanoparticles using a bivariate number density n(v,al,t), where n(v,al,t)dvdal signifies the number of nanoparticles in size (volume) range v to v + dv with ligand covered surface area in the range al to al + dal per reaction volume at time t. The developed PBM framework is based on Perala and Kumar modeling approach,54 but we take into account the reversible binding of ligand with the metal precursor as well as with the nanoparticle surface. In addition, the rates of nanoparticle growth and surface binding of ligands are considered to be proportional to the number of available surface sites and not the volume of the nanoparticles as used in our previous work and other literature reports.7,43,60 The governing population balance equation for ligand-mediated nanoparticle nucleation and growth in the absence of agglomeration is presented by:54| |  | (5) |
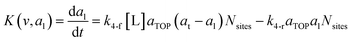
where G is the rate of nanoparticle growth, K the rate of ligand capping on the nanoparticle surface (net rate of increase in ligand coverage), and Ṅ(t) the nucleation rate. In addition, vnuc and anuc represent the volume and capped surface area of nucleus, respectively. We assume (except where otherwise mentioned) that nuclei have a zero-ligand coverage, anuc = 0 and that capping starts taking place after a nucleus forms. The parameters G and K can be defined as| | 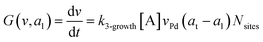 | (6) |
| |  | (7) |
here, vPd is the volume of Pd atom, Nsites the number of surface sites per unit area,61at the total surface area of nanoparticles (all nanoparticles are assumed to be spherical, which is in agreement with the TEM images for the case studies considered herein), and al the capped surface area of the nanoparticles. Therefore, (at − al)Nsites corresponds to the number of free surface sites for growth or capping. As shown in eqn (7), the capped surface area of the nanoparticles changes with ligand association and dissociation from the surface. Here, aTOP is the surface area covered by one ligand (TOP) which is assumed to be size independent, and k4-r is the ligand–nanoparticle dissociation rate constant which is related to the association rate constant by thermodynamics,  . The constant parameters (i.e. Nsites, aTOP, vPd, and etc.) are summarized in Table S1.† To extract the properties of the size distribution, the general moments of distribution (Mi,k) can be defined as
| | 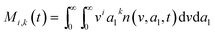 | (8) |
here, M0,0 is the total number of nanoparticles per reaction volume; M1,0 is the total volume of nanoparticles; M2/3,0 and M1/3,0 are the total surface area and sum of the diameter of all nanoparticles, respectively. In addition, M0,1 accounts for the total ligand covered surface area of all nanoparticles.
To obtain the time variation of the general moments  , the governing population balance eqn (5) needs to be multiplied by vialk and integrated with respect to both v and al from 0 to ∞.54 Using the generic moments of size distribution, the concentration of nanoparticles (Np), number average diameter (Dave), width of size distribution (σ), polydispersity (P), and the average fractional surface coverage (Fc; i.e. the ligand capped surface area over total nanoparticle surface area) as a function of time for spherical shape nanoparticle can be formulated as follows:
| |  | (9) |
| |  | (10) |
| |  | (11) |
| |  | (12) |
| |  | (13) |
here “
nc” in
eqn (9) corresponds to the number of atoms/nucleus (based on the estimation reported in our previous work,
nc = 4 (
ref. 7 and 55)). We note that with this definition of coverage, the time dependent coverage can be obtained only as an average for the entire population (
i.e. the average coverage changes with time, but is the same for all sizes of the population at that time). To compute the above terms, the differential equations for moments of size distribution need to be coupled with the reactants' concentrations (metal precursor, ligands, and
etc.) and solved simultaneously (see corresponding differential equations in ESI
†). In addition, to estimate the rate constants (
kf and
kf) more accurately, we used different sets of experimental observables from
in situ SAXS, namely the average diameter and concentration of nanoparticles as the model input and fitted both simultaneously (see the details of data fitting and model parameters estimation in the ESI
†). The rate constants are summarized in Tables S2 and S3.
† Additionally, the obtained model parameters were similar under different synthetic conditions (different concentrations of metal and ligand) despite the different final sizes as shown in Table S2 (refer to the ESI
† for the full lists of model constants and symbols). Therefore, the results suggest our model can capture the kinetics of nucleation and growth with chemical fidelity.
Density functional theory (DFT) calculations
Periodic DFT calculations were performed using the CP2K package with the PBE functional.62,63 To account for dispersion interactions between ligands Grimme's D3 dispersion corrections were employed.64 Double-zeta valence polarized basis sets (DZVP) with the Goedecker, Teter, and Hutter (GTH) pseudopotentials were used with a kinetic energy cutoff of 500 Ry. The bulk unitcell parameters of Pd were obtained by relaxing a 2 × 2 × 2 supercell of the conventional metallic Pd unit cell. The Broyden–Fletcher–Goldfarb–Shanno (BFGS) minimization algorithm was used to optimize initial geometries with convergence criteria of 4.0 × 10⁻⁴Eh per Bohr and 10−7 au for force and energy, respectively. We chose Pd(111) surface to perform DFT calculations of ligand–particle binding energy as Pd(111) was the dominant crystal facet in the nanoparticle synthesis (see Fig. S2 in the ESI†). Previous reports also showed that Pd(111) facet was the dominant facet in Pd nanoparticle synthesis.65,66 To construct the model of the (111) surface facet of Pd, we employed p5 × 5 supercell that was created using the primitive (optimized) unitcell. The surface slab calculations were performed with four atomic layers and a vacuum of 12 Å was used. The atoms of two bottom layers were kept frozen at their corresponding bulk positions and two top layers were allowed to relax. To reduce the computational cost, we used triethylphosphine (TEP) as a model to represent the TOP ligand. We note that four TEP molecules sufficiently cover the full supercell of Pd(111). The adsorption energy of TEP (ETEPads) and the Pd–TEP complex (ETEP–Pdads) as a function of TEP coverage are defined as:| |  | (14) |
| |  | (15) |
where EnMLTEP/Pd(111) is the energy of the Pd(111) surface at a given coverage of TEP (n = 0.25 monolayer (ML), 0.50 ML, 0.75 ML, 1.00 ML, corresponding to one, two, three and four TEP molecules on the surface, respectively), E(n-0.25)MLTEP/Pd(111) is the energy of the surface Pd(111) surface at a TEP-coverage of n-0.25 ML and  is the energy of TEP molecule in the gas phase. EmMLPd–TEP@TEP/Pd(111) is the energy of the Pd(111) surface with a Pd–TEP complex (Pd single atom bound to a TEP molecule) adsorbed on the surface at a given coverage of TEP (m = 0.0 ML, 0.25 ML, 0.50 ML, 0.75 ML, corresponding to zero, one, two and three TEP molecules on the surface, respectively), EmMLTEP/Pd(111) is the energy of the Pd(111) surface at a TEP-coverage of m and
  is the energy of Pd–TEP molecule in the gas phase.
Results and discussion
Size focusing for overlapped nucleation and growth
Despite observing continuous nucleation in many colloidal synthesis studies, the final polydispersity can be as low as 10–20%.7,22,44,59,67 As shown in Fig. 2, there is a continuous formation of Pd nanoparticles (increase in the concentration of nanoparticles) that overlaps with the nanoparticles growth (increase in the average diameter) from t = 0 to 0.2 h, which is consistent with our previous work.7 However, the polydispersity during this time dropped noticeably from ∼48% to 10%, indicating focusing of the size distribution (average diameter and polydispersity from TEM was 4.9 ± 0.65 nm (see Fig. S3†), i.e. 13% polydispersity, which agrees with the SAXS results shown in Fig. 2, 4.9 ± 0.49 nm). We compared the measured size distribution from TEM with the one obtained from SAXS based on Shultz distribution and as shown in Fig. S3† the results are in excellent agreement. Additionally, we used the Monte Carlo based McSAS software to fit some of the SAXS spectra68,69 to estimate the size distribution and compare it with the Shultz imposed distribution and the distribution obtained from TEM. As shown in Fig. S3,† the fitting results and the corresponding size distribution (average diameter = 4.8 ± 0.70 nm; polydispersity = 14%) are consistent with the results from TEM and SAXS fit using Igor. Moreover, the overall shape of the distribution is similar to a Shultz distribution except for the small percentage of smaller nanoparticles (<4 nm) which were observed by TEM and also captured in the size distribution from McSAS. The presence of smaller nanoparticles should be expected due to the continuous nucleation and they have a small effect on the size distribution at the end of the synthesis (average diameter and polydispersity) but it is noteworthy that it can be detected using the fit from the McSAS software.
 |
| | Fig. 2 Time evolution of (a) average diameter (Dave) and concentration of nanoparticles (Np); and (b) polydispersity  . Symbols (circles and squares) and lines correspond to the experimental data from in situ SAXS and modeling results, respectively. The window at early times shows the overlap of nucleation and growth (increase in concentration of nanoparticles and average diameter) and highlights the concomitant decrease in polydispersity. Experimental conditions: 10 mM Pd(OAc)2 in 1:1 pyridine/hexanol, TOP:Pd = 1, and T = 100 °C. . Symbols (circles and squares) and lines correspond to the experimental data from in situ SAXS and modeling results, respectively. The window at early times shows the overlap of nucleation and growth (increase in concentration of nanoparticles and average diameter) and highlights the concomitant decrease in polydispersity. Experimental conditions: 10 mM Pd(OAc)2 in 1:1 pyridine/hexanol, TOP:Pd = 1, and T = 100 °C. | |
The continuous increase in concentration of nanoparticles at early times (Fig. 2) further confirms that the nanoparticle growth via agglomeration is not a major growth pathway; otherwise, the concentration of nanoparticles should decrease.60,70 The size focusing behaviour was also observed under different concentrations of metal and ligand in pyridine as well as different type of solvent (i.e. toluene, see Fig. S4†). The overlap of nucleation and growth while reaching a narrow final size distribution is in fact very common and has been reported for Au,39,71 Pd,7,44 Ir,48 and CdSe.23Fig. 3 and Table S4† show several examples of size focusing despite continuous nucleation and overlap with growth (including this work). Additionally, since growth is reaction limited7,22,43,48,60 (refer to ESI† for the estimation of Damköhler number (i.e. reaction rate/diffusion rate), which was found to be in the range of 10−8 to 10−9 confirming that growth is not limited by diffusion), the results indicate that both requirements of the LaMer model are not applicable in these systems and subsequently cannot be used to explain the size focusing behaviour. Therefore, it is important to determine the mechanism(s) involved in focusing of the size distribution; in particular, under the condition where nucleation and growth overlap.
 |
| | Fig. 3 Polydispersity as a function of normalized reaction time for Au (Abécassis et al.39 (acidic ligand)), Rh (Harada et al.46 (without NaCl)), Pd (our work), and Fe3O4 (Vreeland et al.27). Normalized time is defined as: time (experimental data collected)/time (end of reaction). | |
Model prediction for size-independent ligand coverage
Using our PBM approach, we estimated the evolution of size, concentration of nanoparticles, and polydispersity for Pd nanoparticles synthesis in pyridine/hexanol with accounting for the effect of capping ligands (Fig. S5† shows the results without the binding with ligands, eqn (1) and (4), and it did not capture the experimental results). The results in Fig. 2 show that the PBM closely follows the average diameter and concentration of the nanoparticles (model parameters and rate constants under different synthetic conditions are listed in Tables S1–S3†). However, in contrast to the size focusing observed experimentally, the model predicts a size defocusing and the distribution becomes broader overtime (Fig. 2b). This result is worth discussing in more details to understand how it could be related to the underlying assumptions used for solving the PBM equations or the reactions chosen for the model.
To determine if the choice of the model reactions affects the prediction of polydispersity, we accounted for different nucleation and growth pathways (i.e. solution reduction followed by growth via monomer addition;  ) and similar results were obtained as the autocatalytic surface growth case shown in Fig. 2 (see the reaction network and simulation results for growth via monomer addition in Table S5 and Fig. S6†). Unlike the experimentally observed size focusing, the model predicts an increase in polydispersity regardless of the mode of growth. Therefore, we suspect that the increase in polydispersity is related to the PBM approach and not the reactions chosen. In particular, to solve the PBM equations, the ligand-surface coverage was assumed to be independent of size. In other words, while the model accounts for the ligand-surface coverage of the entire population as it evolves with time (see Fig. S7† for the time evolution of average surface coverage), at each time, the different size nanoparticles in the population were assumed to have the same ligand coverage. This assumption is similar to imposing an equilibrium on eqn (4) (i.e. the ligand-surface coverage is at equilibrium at all times). However, our sensitivity analysis shows that the average diameter and concentration of nanoparticles are strongly affected by altering the rate constants for the ligand–nanoparticle binding indicating the importance of accounting for both ligand association and dissociation reactions (see Fig. S8†). Furthermore, the ligand–nanoparticle binding was also reported to be time-dependent (not equilibrated) in particular in the early stage of reaction.7,47,54 Consequently, due to the continuous nucleation, the population consists of nanoparticles with different size and also different “age” (time since nucleation) resulting in a ligand-surface coverage that depends on size and time as also described by Lazzari et al.47 Therefore, it is important to correctly account for ligand-surface coverage to determine the effect of ligand affinity and continuous nucleation on evolution of polydispersity and will be investigated next.
Model prediction while accounting for ligand coverage as a function of size and time
We modified the model by using separate multiple nanoparticle populations to account for continuous nucleation while allowing to track (vs. time) the size distribution as well as ligand surface coverage as a function of nanoparticle size and time (see the model equations for the modified PBM that accounts for the size-dependent ligand coverage in ESI†). Specifically, starting at the time where the polydispersity was ∼48% (time = 0.03 h in Fig. 2), we replaced the continuous nanoparticle population with two monodisperse populations (delta functions) of 0.6 and 2 nm. The diameters of 0.6 and 2 nm were chosen for the two populations to represent nuclei just formed and large nanoparticles that have had time to grow, respectively (the exact initial size of the two populations had no effect on the results, see details below). This allows us to determine what controls the relative growth rates of small and large nanoparticles and track the evolution of size distribution under different conditions (i.e. in the absence or presence of continuous nucleation, different ligand surface coverage, etc.). The initial concentration of nanoparticles in each population was chosen such that the average diameter and polydispersity of the combined population would be equal to the experimental values at time = 0.03 h (1.3 nm and 48%, respectively). The initial ligand coverage for the 2 nm nanoparticle population was 15% (based on the average fractional surface coverage (Fc) at time = 0.03 h in Fig. S7† from the full modelling results) while that on the 0.6 nm (and all new nuclei) was 0% (the effect of this assumption was negligible, see details in ESI text and Fig. S9†). The higher coverage on the 2 nm population is due to longer time spent in solution and the kinetics of ligand-surface association (reaction (4)) where the coverage increases with time (see Fig. S7†).
Reactions (1), (3), and (4) are allowed to proceed with shared metal precursor and ligands among the two populations (and all new populations, see below) as schematically shown in Fig. 4 (the rate constants reported in Table S2† were used to perform the simulations). To account for continuous nucleation (reaction (2)), we added a series of nucleation events at specific times (200 new monodisperse populations, 0.6 nm in diameter) where the rate (concentration of nanoparticles in each new population) drops as the reaction proceeds (as [A] decreases, according to eqn (2) and (9)) to match the concentration of nanoparticles measured experimentally at each time (see details in ESI text†). Fig. 5a shows the results for ligand coverage vs. nanoparticle diameter at two different reaction times. It can be seen that the larger nanoparticles have higher ligand coverage and the average coverage increases with time. By accounting for the different ligand surface coverage on the different size nanoparticles, the polydispersity was found to decrease with time (from ∼48% to 28%, see Fig. 5b). The decrease in polydispersity can be attributed to the higher ligand coverage on the larger nanoparticles thereby decreasing the available number of surface sites which allows the smaller nanoparticles (and new nuclei formed at later times) to grow at a faster rate (see Fig. S10† for agreement with the time evolution of the average diameter and concentration of the nanoparticles). However, the predicted final polydispersity (28%) was still much higher than the experimental value of ∼10% indicating this mechanism by itself cannot explain such a sharp size focusing observed during the synthesis. To confirm those findings, we also compared the results of the full PBM and our modified-PBM considering the coverage to be constant for the entire population. As shown in Fig. S11,† the size focusing behaviour was not observed similar to the full PBM prediction. This further confirms that the difference in the ligand surface coverage of different nanoparticle sizes plays an important role in size focusing (and not the introduction of multiple populations in our modified PBM).
 |
| | Fig. 4 Schematic diagram for the growth and capping of two different sized populations. The metal precursor and ligands are shared among 0.6 nm (new born nanoparticles) and 2 nm nanoparticles. Additional nucleation events are not shown for clarity; however, continuous nucleation is accounted for in this approach by adding more nuclei (0.6 nm) overtime as described in the text. | |
 |
| | Fig. 5 (a) Model prediction of coverage vs. nanoparticle diameter at time = 0.05 and 0.10 h; a (b) time evolution of polydispersity  . At time zero, the 2 nm nanoparticle population has 15% initial ligand coverage, while the initial coverage of smaller size population; 0.6 nm, is zero. Experimental conditions: 10 mM Pd(OAc)2 in 1:1 pyridine/hexanol, TOP:Pd = 1, and T = 100 °C. . At time zero, the 2 nm nanoparticle population has 15% initial ligand coverage, while the initial coverage of smaller size population; 0.6 nm, is zero. Experimental conditions: 10 mM Pd(OAc)2 in 1:1 pyridine/hexanol, TOP:Pd = 1, and T = 100 °C. | |
To investigate how much continuous nucleation and effectively the length of overlap with growth contributes to size focusing/defocusing, we compared the time evolution of the average diameter and polydispersity of the all the populations using different nucleation rates (see Fig. S12 and S13 and additional details in the ESI†). The results for different nucleation rates confirm that continuous nucleation contributes to defocusing of the size distribution due to the introduction of smaller nanoparticles at later times when the population has grown to a larger average size. We next investigate different mechanisms that could lead to the size focusing observed experimentally.
Effect of ligand–nanoparticle binding affinity on the evolution of polydispersity
One of the possible mechanisms that could explain the formation of near monodispersed nanoparticles in the presence of continuous nucleation is that the nuclei formed at different stages of the synthesis grow to almost the same size when they are almost fully capped by the ligands.40,54 This could occur as larger nanoparticles have much higher coverage than the smaller nanoparticles. As a result, the smaller nanoparticles can grow faster than the larger ones leading to focusing the size distribution. However, full capping of the surface by the ligands is not common and some open surface sites are expected to be present. Fig. 6 compares the effect ligand–nanoparticle binding affinity, which is reflected in the initial coverage on the 2 nm nanoparticles (15–40% for the 2 nm nanoparticles while the 0.6 nm nanoparticles start with 0% coverage, see the corresponding rate constants and further details in the ESI†) on the time evolution of polydispersity in the case of continuous nucleation. A higher initial ligand coverage on the 2 nm nanoparticles (40% vs. 15%) decreases the final polydispersity (down to 24% compared with 28%, respectively) due to a decrease in available number of surface sites which allows the 0.6 nm nanoparticle population and new nuclei formed at later times to grow at a faster rate (see the average diameter and ligand coverage vs. diameter in Fig. S14†). However, the effect was small and did not lower the polydispersity to the value measured experimentally. Additionally, higher initial coverage than 40% on the 2 nm nanoparticles (even when adjusting the rate constants in the model) could not capture both the increase in size and decrease in polydispersity observed experimentally (see Fig. S15 and S16†). Therefore, this proposed mechanism, by itself, could not explain the extent of size focusing observed experimentally.
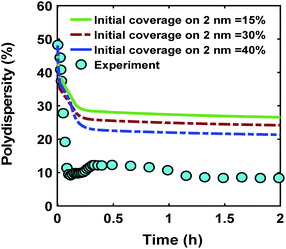 |
| | Fig. 6 Effect of initial ligand coverage at time zero (15, 30 and 40%) of the larger size (2 nm) population on the time evolution of polydispersity  in the case of continuous nucleation. The maximum coverage for the cases with 15%, 30%, and 40% initial ligand coverage on 2 nm nanoparticles is 32%, 45%, and 55%, respectively. Nucleation rate (model = experiment). in the case of continuous nucleation. The maximum coverage for the cases with 15%, 30%, and 40% initial ligand coverage on 2 nm nanoparticles is 32%, 45%, and 55%, respectively. Nucleation rate (model = experiment). | |
The results therefore show that in order to capture such a large decrease in the polydispersity (size focusing) with overlap of nucleation and growth, the smaller nanoparticles should grow at a much faster rate than the larger ones. The higher growth rate for the smaller nanoparticles (e.g. nanoparticles nucleated at later times) than larger ones could be due to one or a combination of the following: (i) the smaller nanoparticles have higher growth rate constant than the larger ones (the nanoparticle size can affect growth enthalpies and/or catalytic properties72); (ii) larger nanoparticles grow at the expense of smaller ones (Ostwald ripening73) and/or growth via agglomeration. However, we did not observe any evidence of ripening and/or agglomeration in our system (based on SAXS) as these phenomena often lead to a significant and measurable decrease in the concentration of nanoparticles.60,70 Additionally, as shown in several studies, the nanoparticle average diameter increases much more rapidly once ripening and/or agglomeration occurs70,74 (not observed in our system); (iii) the growth rate on free surface sites is affected by the ligand coverage on the surface of the nanoparticle. As shown in Fig. 5, the continuous nucleation and gradual increase in ligand coverage result in a size-dependent ligand coverage, where the larger nanoparticles have higher ligand coverage than those new born ones. Therefore, if the ligand coverage affects the growth rate on neighbouring free sites, in addition to having a smaller fraction of free surface sites, the larger nanoparticles will grow at a slower rate per site. Below we account for the effects of ligand surface coverage and size-dependent growth rate on the evolution of size distribution. We will first focus on case (iii) to understand if/how the extent of ligand coverage ( , and the higher coverage on larger nanoparticles than smaller ones, see Fig. 5a) could affect the growth rate to counteract the size defocusing effect caused by continuous nucleation and decrease the polydispersity overtime. We then show the effect of size-dependent (i.e. case (i)) intrinsic growth rate and ligand–nanoparticle binding and their contribution to the size focusing of metal nanoparticles.
Ligand coverage-dependent growth rate constant
In the presence of continuous nucleation, the decrease in polydispersity predicted by the PBM for the different cases considered was still far from that observed experimentally, despite the higher ligand coverage on the larger nanoparticles. This suggests that in order to achieve such a sharp size focusing as observed experimentally (where polydispersity drops from 48% to 10%, see Fig. 2), the smaller nanoparticles should grow at a much faster rate than the larger ones. In other words, the higher ligand coverage on larger nanoparticles should have a stronger effect on the growth rate other than simply decreasing the number of free surface sites. An extreme case is the synthesis of molecular nanoparticles75,76 (e.g. Au and Ag atomically precise nanoparticles and we use Ag44 synthesis as an example) where the nanoparticle becomes “inert” due to achieving a closed electronic shell at a certain number of atoms (size) and ligands (e.g. Na4Ag44(p-MBA)30, hence the term “molecule”).77,78 Consequently, despite continuous nucleation, the growth of existing nanoparticles completely stops at that size (or a narrow distribution around that size for non-molecular-like nanoparticles) leading to monodisperse nanoparticles. Therefore, we investigated how the coverage of ligands can affect the reactivity of neighbouring free sites as explained below.
It is well known that the ligand–nanoparticle binding energy decreases with increase in coverage on the nanoparticle surface.79–82 For example, the CO adsorption energy on Pt(111) was shown to decrease (i.e. less exothermic) significantly from −121 to −52 and −7 kJ mol−1 as the coverage of CO increased from 0.11 to 0.55 and 0.67 ML, respectively, indicating strong repulsive interactions between the adsorbed CO molecules.80 Similarly, in the case of 3-mercapto-1-propanol (MPOH) capped CdSe, the ligand–nanoparticle binding energy decreased as the fractional coverage on the nanoparticle surface increased.81 The coverage-dependent ligand binding energy effectively lowers the maximum coverage on larger nanoparticles (due to weaker adsorption as coverage increases). Consequently, this will limit the effect of surface site blockage by ligands in focusing the size distribution, since the size focusing observed in Fig. 6 was a result of decreasing the fraction of free surface sites on larger nanoparticles (i.e. coverage independent adsorption energy).
The nanoparticle growth, which occurs through the reduction of metal precursor and/or monomer addition to the nanoparticle surface, is also expected to depend on ligand surface coverage. In both modes of growth, the metal precursor or the reduced metal atom (monomer) are often coordinated with ligands as illustrated in our recent studies for the formation of Pd nanoparticles7,55 and other types of nanoparticles, such as Ir,49 CdSe,47 and Pt.51 Therefore, the activation energy for growth (i.e. the activation energy for the reduction of metal precursor and/or monomer addition to the nanoparticle surface) is expected to be affected by the ligand surface coverage due to: (i) lateral interaction of metal atoms (that are coordinated with ligands) with the ligands bound to the nanoparticle surface (steric hindrance or just adsorbate–adsorbate interaction due to the long chain length83), and/or (ii) the change in the electronic state of the free metal surface sites induced by the ligands that are bound to adjacent surface sites.84,85
To estimate the effect of ligand-surface coverage, we used density functional theory (DFT) to calculate the adsorption energy (Eads) of trioctylphosphine (modelled as triethylphosphine, TEP) at coverages from 0.25 ML to 1 ML on Pd(111) (where 1 ML represents the maximum coverage on Pd(111) which was equal to 20%). As depicted in Fig. 7a, the ligand adsorption energy decreases by ∼15% with increase in coverage (from −259 to −220 kJ mol−1). Similarly in the case of surface growth, modelled as adsorption of Pd–TEP (a monomer–ligand complex consisting of Pd atom coordinated with TEP) on Pd(111), the DFT calculations show the adsorption energy of Pd–TEP vs. TEP coverage also decreases by 9% (from −340 to −309 kJ mol−1, see Fig. 7b). According to Brønsted–Evans–Polanyi (BEP)86,87 relationship (eqn (16)), the decrease in reaction (here adsorption of TEP and Pd–TEP) energy leads to an increase in the reaction activation energy. This is important since it would increase the activation energy for surface growth as the ligand coverage increases (i.e. kgrowth decreases with increase in coverage) and thus the growth rate (per site) of larger nanoparticles slows down compared to smaller nanoparticles (because of higher coverage on larger nanoparticles). The increase in reaction activation energy due to the increase in the ligand coverage has been also reported in the literature. For example, the activation energy for O2 dissociation on Pt(111) increased from 27 kJ mol−1 to 100 kJ mol−1 as CO coverage increased from 0.22 to 0.67 ML, respectively.80 To simulate the effect of coverage on ligand binding and growth rates in our model, we used the BEP relationship to correlate the activation energy (Ea) of the reaction (i.e. ligand–nanoparticle binding and surface growth) to the reaction enthalpy (ΔH) via the following equation:86,87
where
E0 and
α are the intrinsic activation energy and transfer coefficient, respectively. Assuming Δ
H decays linearly with increase in ligand surface coverage (
θ) following a Temkin adsorption isotherm,
88,89 the following relationship can be written between Δ
H and
θ:
| | | ΔHL(θ) = ΔH0-L(1 − CLθ) | (17) |
where Δ
H0-L is the enthalpy of reaction at zero coverage,
CL the constant which varies depending on the type of chemical reaction (
CL is the slope of
eqn (17) and can be obtained by measuring Δ
H at different coverages).
90 Substituting
eqn (17) into
(16), the activation energy for ligand–nanoparticle binding can be obtained
via the following relationship:
| | | Ea-fL(θ) = E0 + αLΔH0-L(1 − CLθ) | (18) |
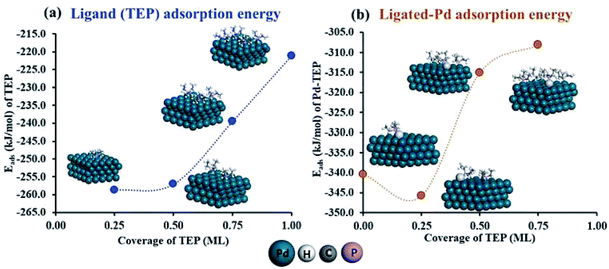 |
| | Fig. 7 (a) Adsorption energy (Eads) of triethylphosphine at coverages from 0.25 ML to 1 ML on Pd(111); (b) adsorption energy of Pd–TEP (where a single Pd atom is coordinated with triethylphosphine through a Pd–P bond) vs. TEP coverage on Pd(111). Color code for atoms: Pd-teal, H-white, C-grey, and P-magenta. Adsorbed Pd atoms are shown in light grey. | |
Similarly, we can obtain the activation energy for the ligand dissociation (Ea-rL) and for the nanoparticle surface growth (Ea-G):
| | | Ea-rL(θ) = E0 + (αL − 1)ΔH0-L(1 − CLθ) | (19) |
| | | Ea-G(θ) = E01 + αGΔH0-G(1 − Cgθ) | (20) |
The transfer coefficient, α varies between 0 to 1 (the earlier the transition state, the smaller the value of α). For relatively high exothermic reactions (e.g. ligand–nanoparticle binding and surface growth), α ≈ 0.1–0.5.91,92
Based on eqn (18) and (20), the activation energies of ligand–nanoparticle binding and nanoparticle growth increase as the ligand coverage increases (Ea-fL(θ) = Ea-L0 − αLΔH0-LCLθ; kf and kgrowth decrease accordingly since k ∝ exp(−Ea/RT)). We estimated CL (in eqn (17): ΔHL(θ) = ΔH0-L(1 − CLθ)) and Cg (in ΔHG(θ) = ΔH0-G(1 − Cgθ)) in a way to obtain similar trends in the adsorption energies at different coverages as those calculated using DFT. Additionally, the activation energies at zero coverage for ligand binding and for surface growth were both chosen to be 25 kJ mol−1. We note that while this value was chosen such that the range of activation energies is consistent with reports from the literature, the exact value does not affect the results. This is because the observed effect of coverage on the rate constants is relative and depends on the change in activation energy with ligand coverage rather than the actual values.
Based on the adsorption energies and other parameters summarized in Table 1, as the ligand coverage increases from 0 to 20%, the activation energies for ligand binding and for nanoparticle growth increase from 25 to 37 kJ mol−1 and 25 to 35 kJ mol−1 respectively. In addition, for thermodynamic consistency, the desorption is also affected by the ligand coverage which limits the coverage to a maximum of ∼20% (the forward and reverse rate constants are reported in Table S6†). The values for growth activation energy are consistent with literature reports. For example, in the synthesis of Pd nanoparticles an activation energy of ∼43 kJ mol−1 for autocatalytic surface growth was reported.50 During the growth and dissolution of quantum dots (i.e. CdSe), the extracted activation energy for growth was found to be in the range of ∼20–50 kJ mol−1.47,93
Table 1 Activation energy and enthalpy values at 0 and 20% ligand coverage (for both ligand–nanoparticle binding and surface growth) used for the simulations in this study
|
|
0% coverage |
20% coverage |
| ΔHL (ligand–nanoparticle binding) |
−260 kJ mol−1 |
−220 kJ mol−1 |
|
E
a-L (ligand–nanoparticle binding) |
25 kJ mol−1 |
37 kJ mol−1 |
| ΔHG (growth) |
−340 kJ mol−1 |
−310 kJ mol−1 |
|
E
a-G (growth) |
25 kJ mol−1 |
35 kJ mol−1 |
|
α
L and αG |
0.3 |
|
C
L
|
0.75 |
|
C
g
|
0.45 |
The ligand coverage on the nanoparticle surface and its effect on the evolution of the size distribution for the case of ligand coverage-dependent growth rate constant is shown in Fig. 8. First, Fig. 8a shows that larger nanoparticles have a higher ligand coverage because they have been in solution longer (similar to Fig. 5a, which is expected, and similar trend can be seen at other reaction times, see Fig. S18†) and this results in a significantly lower growth rate constant on larger nanoparticles. For example, at time = 0.10 h, the 0.8 nm nanoparticles have 2% coverage, while the coverage is 17% for 3.8 nm nanoparticles. Such a large difference in coverage translates into a significant difference in the growth rate, where the 3.8 nm nanoparticles grow at a much slower rate than 0.8 nm (20 vs. 145 h−1 per site, respectively). In Fig. 8b we show the effect of coverage-dependent growth rate constant on the evolution of polydispersity and compare it to the case where the growth rate constant is independent of ligand coverage. The polydispersity decreases significantly when the coverage effect on growth rate constant is considered (see blue dashed line in Fig. 8b), while the polydispersity decreases to a much lesser extent for the case of coverage-independent growth rate constant (i.e. the green line; see also Fig. S19† for agreement with the time evolution of the average diameter and concentration of the nanoparticles). Using the Schulz distribution function,7 we also compared the final size distribution for the two cases of coverage-dependent and coverage-independent growth rate constants with the one obtained from TEM. As shown in Fig. 8c, the case of coverage-dependent growth rate constant closely matches the narrow size distribution obtained from TEM, while the case of coverage-independent growth rate constant shows a broad size distribution.
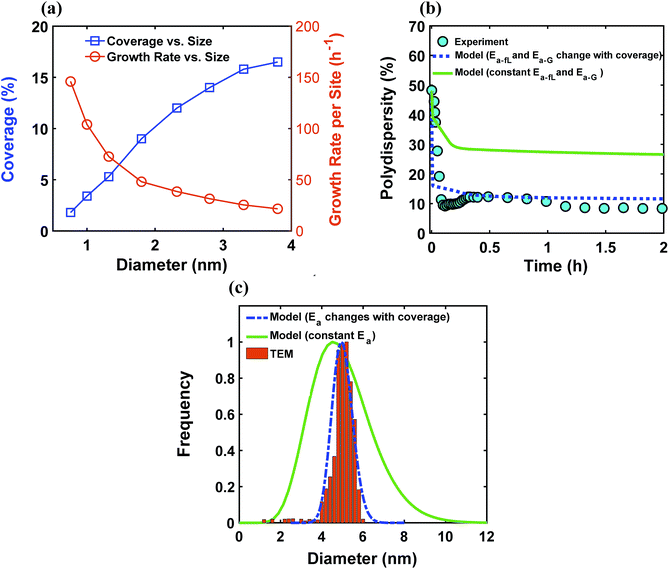 |
| | Fig. 8 (a) Model prediction of ligand coverage (blue square) and growth rate per site (orange circle) as a function of diameter at time = 0.10 h; (b) model prediction of polydispersity  for two different cases; coverage-independent (green line) and coverage-dependent (blue dashed line) growth rate constant, and (c) comparison of the particle size distribution (frequency) for the two cases with the size distribution from TEM. In the case of coverage-independent growth rate constant (green lines), the 2 nm nanoparticle population starts with 15% initial ligand coverage and the activation energies are not affected by coverage (the initial coverage of smaller size population; 0.6 nm, is zero in all cases). In the case of coverage-dependent growth rate constant (blue dashed line), the 2 nm nanoparticles population starts with 15% ligand surface coverage and the surface coverage affects both the enthalpy and activation energies for ligand–nanoparticle binding and surface growth linearly according to Table 1. Nucleation rate (model = experiment). The results were unaffected by the initial size of the starting two populations as shown in Fig. S17† for 1 and 3 nm instead of 0.6 and 2 nm. for two different cases; coverage-independent (green line) and coverage-dependent (blue dashed line) growth rate constant, and (c) comparison of the particle size distribution (frequency) for the two cases with the size distribution from TEM. In the case of coverage-independent growth rate constant (green lines), the 2 nm nanoparticle population starts with 15% initial ligand coverage and the activation energies are not affected by coverage (the initial coverage of smaller size population; 0.6 nm, is zero in all cases). In the case of coverage-dependent growth rate constant (blue dashed line), the 2 nm nanoparticles population starts with 15% ligand surface coverage and the surface coverage affects both the enthalpy and activation energies for ligand–nanoparticle binding and surface growth linearly according to Table 1. Nucleation rate (model = experiment). The results were unaffected by the initial size of the starting two populations as shown in Fig. S17† for 1 and 3 nm instead of 0.6 and 2 nm. | |
To show the generality of the results, we also tested the model, specifically the effect of coverage-dependant growth rate constant, using in situ data for different ligand/metal ratio, metal concentration, and different solvent type (i.e. toluene), and the model could capture the experimentally measured size focusing behaviour (see Fig. S20 and S21 and the corresponding rate constants in the ESI†). Additionally, we considered different modes of surface growth (i.e. monomer addition to the nanoparticle surface) and the results were similar to those obtained via autocatalytic surface growth already shown in Fig. 8 (see Fig. S22†). This further suggests that, for this Pd system, the effect of ligand coverage on the growth kinetics (reaction (4),  ) has a major contribution to the size focusing behaviour, independent of the growth pathway.
It is important to emphasize that while the ligand coverage affects both, the number of free surface sites and the growth rate constant, the contribution of the latter to size focusing is much more pronounced (exponential via change in Ea). More importantly, we note that the actual value (20%) of the maximum ligand coverage is not crucial given that the exact value of ligand coverage is not the main cause of the sharp size focusing (when the activation energy of growth (Ea-G) was independent of coverage, the polydispersity only dropped slightly from 28% to 24% when the maximum coverage in the model was increased from 20% to 55%, Fig. S14†). The size focusing is due to the effect of coverage on the activation energy of growth (Ea-G), i.e. the relative activity of surface sites for different coverage, which will be dominant regardless of the actual maximum coverage. Even though the nanoparticles are not fully covered with ligands, the ligand surface coverage can have a very strong effect on the activity of the free surface sites and therefore, make the growth rate very slow as the coverage increases. Such a very low activity of surface sites makes the nanoparticles almost inactive, thereby limiting the nanoparticles to a specific size distribution that depends on initial concentrations (see Fig. S4† for effect of Pd and TOP concentrations in pyridine and Fig. S20† for model prediction using the same kinetic parameters). This effect is similar to the synthesis of molecular nanoparticles75,76 (e.g. Au and Ag atomically precise nanoparticles) where it was shown that the nanoparticle becomes “inert” due to achieving a closed electronic shell at a certain number of atoms (size) and ligands.
Size-dependent growth rate constant
In addition to the effect of ligand coverage on the reaction energy for surface growth and binding with ligands, and consequently the rate constants, the nanoparticle size could also have a strong effect on both. However, there are contradictory reports on the effect of size on ligand–nanoparticle binding energies94–96 and surface reactivity.97,98 Nevertheless, to account for the nanoparticle size we used the square root bond cutting model99 which was applied for predicting the stability of metal nanoparticles,100 to calculate the binding energy of an adatom (on hollow position in every case) on nanoparticles of different sizes (10–300 atoms). The results showed a small effect on the enthalpy of growth as a function of size, where the enthalpy changed from −251 to −240 kJ mol−1 (4.5% less exothermic for larger nanoparticles, see Fig. S23 in ESI†). Similarly, the ligand–nanoparticle binding can be size-dependent95,101 and similar to the case of growth, we expect the smaller nanoparticles to have higher affinity to bind with ligands (due to higher number of under-coordinated sites than larger nanoparticles102). It can be seen that from a thermodynamics perspective, the size-dependent growth and ligand binding reaction energies would have opposite effects on size focusing. Specifically, as the nanoparticles get larger, the reaction energy for both, growth and ligand binding become less exothermic which means that while the growth rate constant for each site will be lower (due to less exothermic growth), the ligand binding is also expected to be weaker leading to larger fraction of free surface sites on larger nanoparticles. To estimate both effects, we accounted for the size-dependent growth and binding reaction energies on the activation energies of the growth and binding rate constants (same trend for both was used in the model as shown in Fig. S23,† see the corresponding rate constants vs. diameter for the surface growth and ligand–nanoparticle binding in Fig. S24†). As shown in Fig. 9, despite their opposite effects, accounting for nanoparticle size-dependent growth and size-dependent ligand binding leads to an overall decrease in the polydispersity down to ∼22% (see Fig. S25† for the prediction of average diameter and polydispersity). However, the effect is small compared to the effect of ligand surface coverage. This is due to the smaller effect on the dependence of the growth rate constant on size as seen in Fig. S26† where the growth of larger nanoparticles is slowed down to a lesser extent for the case of size-dependent growth rate constant than the coverage-dependent case.
 |
| | Fig. 9 Model prediction of polydispersity  for three different cases (circles are experimental data). In the first case (green line), the activation energies are not affected by coverage and/or nanoparticle size. In the second case (red dashed line), the size affects both the enthalpy and activation energies for growth and ligand–nanoparticle binding. In the third case, the surface coverage affects both the enthalpy and activation energies for ligand–nanoparticle binding and surface growth. for three different cases (circles are experimental data). In the first case (green line), the activation energies are not affected by coverage and/or nanoparticle size. In the second case (red dashed line), the size affects both the enthalpy and activation energies for growth and ligand–nanoparticle binding. In the third case, the surface coverage affects both the enthalpy and activation energies for ligand–nanoparticle binding and surface growth. | |
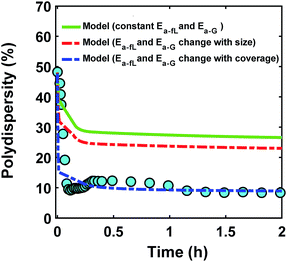
We note that the objective of this work was to show the possible effects (i.e. size and ligand coverage) that contribute to size focusing. While we find that the effect of ligand coverage-dependent growth rate constant appeared to contribute the most to size focusing, the effects of nanoparticle size and ligand binding affinity have non-negligible contributions and could become dominant depending on the system (different ligand and/or metal, temperature) and therefore need to be considered on case-by-case basis. Additionally, we do not account for the agglomeration and digestive ripening phenomena. While these phenomena are not the major growth pathways in our system, they could be important under different synthetic conditions (e.g. different type of metal and temperature).
The results contribute to the current understanding of nanoparticle nucleation and growth and signify the importance of nanoparticle size and ligand surface coverage in size focusing of colloidal nanoparticles. Our PBM approach along with the findings highlight the limitations of current kinetic models in accurately capturing the nanoparticle size distribution. Additionally, the PBM approach provides a new method to account for the non-trivial effects of ligand surface coverage and nanoparticle size on the kinetics of ligand binding and surface growth. The results highlight the important connection between growth kinetics and thermodynamics of metal–ligand binding for the control of colloidal nanoparticle size distribution. In order to further investigate the effects of ligand coverage and role of nanoparticle size, experimental measurements of the enthalpies and activation energies for ligand–nanoparticle binding and surface growth would be required. Future work will be focused on investigating how general the findings are using different metal–ligand systems and determining the most likely model/mechanism capable of capturing the size distribution.
Conclusions
In this work, we developed a population balance model (PBM) to account for the role of ligand surface coverage in the evolution of size distribution. Using in situ small angle X-ray scattering we directly compared the average properties of size distribution (size, concentration of nanoparticles, and polydispersity) to those predicted by the model under different synthetic conditions (different concentrations of metal and ligand as well as solvent type). We examined: (i) how the formation of new nuclei (nucleation events) alters the size distribution and (ii) how size focusing could be obtained under the condition where nuclei formation overlaps with the growth of existing nanoparticles. The results show that continuous nucleation contributes to defocusing of the size distribution. On the other hand, continuous formation of nuclei at different stages of the reaction leads to time and size-dependent ligand coverage. Based on theoretical calculations and Brønsted–Evans–Polanyi relations, our results show that as the population grows, larger nanoparticles grow at a slower rate than smaller ones due to: (i) lower intrinsic surface activity and (ii) higher coverage of ligand on the surface which affects the fraction and reactivity of the free surface sites. Therefore, despite continuous nucleation, the smaller nanoparticles (having lower ligand coverage and higher growth rate constant) grow faster than larger nanoparticles, leading to size focusing. The size focusing behaviour was found to be model independent and the results were similar under different nucleation and growth modes. The presented methodology allows for the prediction of size distribution in ligated nanoparticle systems and help guide the control over size and polydispersity.
Conflicts of interest
The authors have no conflict of interest to report.
Acknowledgements
We acknowledge funding from the National Science Foundation (NSF), Chemistry Division (CHE) under Grant No. 1507370 and CBET Division (CAREER program) under Grant No. 1652694. Ayman M. Karim would like to acknowledge partial financial support provided by 3M Non-Tenured Faculty Award. This work used resources of the Advanced Photon Source (beamline 12-ID-C, user proposal GUP-45774), a U.S. Department of Energy (DOE) Office of Science User Facility operated for the DOE Office of Science by Argonne National Laboratory under Contract No. DE-AC02-06CH11357. A portion of the research was performed at EMSL, a national scientific user facility sponsored by the Department of Energy’s Office of Biological and Environmental Research and located at PNNL. PNNL is a multiprogram national laboratory operated for the U.S. DOE by Battelle. Computational support was provided by the University of Pittsburgh Center for Research Computing. We thank Michael G. Taylor for the binding energy calculations shown in Fig. S23.† We are also very grateful to Prof. Richard Finke at Colorado State University (CSU) for fruitful discussions regarding the possible effect of nanoparticle size on surface growth.
Notes and references
- Q. A. Akkerman, M. Gandini, F. Di Stasio, P. Rastogi, F. Palazon, G. Bertoni, J. M. Ball, M. Prato, A. Petrozza and L. Manna, Nat. Energy, 2017, 2, 16194 CrossRef CAS.
- S. P. Shields, V. N. Richards and W. E. Buhro, Chem. Mater., 2010, 22, 3212–3225 CrossRef CAS.
- R. L. Li, N. C. Flanders, A. M. Evans, W. Ji, I. Castano, L. X. Chen, N. C. Gianneschi and W. Dichtel, Chem. Sci., 2019, 10, 3796–3801 RSC.
- L. Gabrielli, D. Rosa-Gastaldo, M.-V. Salvia, S. Springhetti, F. Rastrelli and F. Mancin, Chem. Sci., 2018, 9, 4777–4784 RSC.
- D. Eguchi, M. Sakamoto and T. Teranishi, Chem. Sci., 2018, 9, 261–265 RSC.
- D. V. Talapin, J.-S. Lee, M. V. Kovalenko and E. V. Shevchenko, Chem. Rev., 2009, 110, 389–458 CrossRef.
- S. Mozaffari, W. Li, C. Thompson, S. Ivanov, S. Seifert, B. Lee, L. Kovarik and A. M. Karim, Nanoscale, 2017, 9, 13772–13785 RSC.
- J. Piella, N. G. Bastús and V. Puntes, Chem. Mater., 2016, 28, 1066–1075 CrossRef CAS.
- M. Saruyama, S. Kim, T. Nishino, M. Sakamoto, M. Haruta, H. Kurata, S. Akiyama, T. Yamada, K. Domen and T. Teranishi, Chem. Sci., 2018, 9, 4830–4836 RSC.
- I. Fedin and D. V. Talapin, J. Am. Chem. Soc., 2016, 138, 9771–9774 CrossRef CAS PubMed.
- H. Zhang, J. Jang, W. Liu and D. V. Talapin, ACS Nano, 2014, 8, 7359–7369 CrossRef CAS PubMed.
- T.-C. Hung, T.-W. Liao, Z.-H. Liao, P.-W. Hsu, P.-Y. Cai, W.-H. Lu, J.-H. Wang and M.-F. Luo, RSC Adv., 2016, 6, 3830–3839 RSC.
- S. Cao, F. Tao, Y. Tang, Y. Li and J. Yu, Chem. Soc. Rev., 2016, 45, 4747–4765 RSC.
- Y. Xia, X. Xia and H.-C. Peng, J. Am. Chem. Soc., 2015, 137, 7947–7966 CrossRef CAS PubMed.
- B. H. Zhou and J. D. Rinehart, ACS Cent. Sci., 2018, 4, 1222–1227 CrossRef CAS PubMed.
- W. Edwards, N. Marro, G. Turner and E. R. Kay, Chem. Sci., 2018, 9, 125–133 RSC.
- M. M. Coulter, J. A. Dinglasan, J. B. Goh, S. Nair, D. J. Anderson and V. M. Dong, Chem. Sci., 2010, 1, 772–775 RSC.
- D. Tanaka, Y. Inuta, M. Sakamoto, A. Furube, M. Haruta, Y.-G. So, K. Kimoto, I. Hamada and T. Teranishi, Chem. Sci., 2014, 5, 2007–2010 RSC.
- J. Baek, P. M. Allen, M. G. Bawendi and K. F. Jensen, Angew. Chem., Int. Ed., 2011, 50, 627–630 CrossRef CAS.
- M. D. Clark, S. K. Kumar, J. S. Owen and E. M. Chan, Nano Lett., 2011, 11, 1976–1980 CrossRef CAS.
- M. Koolyk, D. Amgar, S. Aharon and L. Etgar, Nanoscale, 2016, 8, 6403–6409 RSC.
- J. Y. Rempel, M. G. Bawendi and K. F. Jensen, J. Am. Chem. Soc., 2009, 131, 4479–4489 CrossRef CAS PubMed.
- X. Peng, J. Wickham and A. P. Alivisatos, J. Am. Chem. Soc., 1998, 120, 5343–5344 CrossRef CAS.
- H. Reiss, J. Chem. Phys., 1951, 19, 482–487 CrossRef CAS.
- T. Sugimoto, Adv. Colloid Interface Sci., 1987, 28, 65–108 CrossRef CAS.
- V. K. LaMer and R. H. Dinegar, J. Am. Chem. Soc., 1950, 72, 4847–4854 CrossRef CAS.
- E. C. Vreeland, J. Watt, G. B. Schober, B. G. Hance, M. J. Austin, A. D. Price, B. D. Fellows, T. C. Monson, N. S. Hudak, L. Maldonado-Camargo, A. C. Bohorquez, C. Rinaldi and D. L. Huber, Chem. Mater., 2015, 27, 6059–6066 CrossRef CAS.
- Y. Zheng, J. Zeng, A. Ruditskiy, M. Liu and Y. Xia, Chem. Mater., 2013, 26, 22–33 CrossRef.
- H. Zhang, M. Jin and Y. Xia, Angew. Chem., Int. Ed., 2012, 51, 7656–7673 CrossRef CAS PubMed.
- N. Razgoniaeva, M. Yang, P. Garrett, N. Kholmicheva, P. Moroz, H. Eckard, L. Royo Romero, D. Porotnikov, D. Khon and M. Zamkov, Chem. Mater., 2018, 30, 1391–1398 CrossRef CAS.
- J. R. Shimpi, D. S. Sidhaye and B. L. Prasad, Langmuir, 2017, 33, 9491–9507 CrossRef CAS PubMed.
- S. Zhang, L. Zhang, K. Liu, M. Liu, Y. Yin and C. Gao, Mater. Chem. Front., 2018, 2, 1328–1333 RSC.
- H.-G. Liao, L. Cui, S. Whitelam and H. Zheng, Science, 2012, 336, 1011–1014 CrossRef CAS.
- J. Polte, T. T. Ahner, F. Delissen, S. Sokolov, F. Emmerling, A. F. Thünemann and R. Kraehnert, J. Am. Chem. Soc., 2010, 132, 1296–1301 CrossRef CAS PubMed.
- T. Li, A. J. Senesi and B. Lee, Chem. Rev., 2016, 116, 11128–11180 CrossRef CAS.
- T. H. Moser, H. Mehta, C. Park, R. T. Kelly, T. Shokuhfar and J. E. Evans, Sci. Adv., 2018, 4, eaaq1202 CrossRef.
- P. Abellan, L. R. Parent, N. Al Hasan, C. Park, I. Arslan, A. M. Karim, J. E. Evans and N. D. Browning, Langmuir, 2016, 32, 1468–1477 CrossRef CAS.
- A. Hutzler, T. Schmutzler, M. P. M. Jank, R. Branscheid, T. Unruh, E. Spiecker and L. Frey, Nano Lett., 2018, 18, 7222–7229 CrossRef CAS PubMed.
- B. Abécassis, F. Testard, O. Spalla and P. Barboux, Nano Lett., 2007, 7, 1723–1727 CrossRef.
- A. M. Karim, N. Al Hasan, S. Ivanov, S. Siefert, R. T. Kelly, N. G. Hallfors, A. Benavidez, L. Kovarik, A. Jenkins, R. E. Winans and A. K. Datye, J. Phys. Chem. C, 2015, 119, 13257–13267 CrossRef.
- M. Wuithschick, A. Birnbaum, S. Witte, M. Sztucki, U. Vainio, N. Pinna, K. Rademann, F. Emmerling, R. Kraehnert and J. r. Polte, ACS Nano, 2015, 9, 7052–7071 CrossRef CAS PubMed.
- M. A. Watzky, E. E. Finney and R. G. Finke, J. Am. Chem. Soc., 2008, 130, 11959–11969 CrossRef CAS PubMed.
- S. Özkar and R. G. Finke, J. Am. Chem. Soc., 2017, 139, 5444–5457 CrossRef PubMed.
- L. Wu, H. Lian, J. J. Willis, E. D. Goodman, I. S. McKay, J. Qin, C. J. Tassone and M. Cargnello, Chem. Mater., 2018, 30, 1127–1135 CrossRef CAS.
- N. Ortiz and S. E. Skrabalak, Angew. Chem., Int. Ed., 2012, 51, 11757–11761 CrossRef CAS.
- M. Harada, N. Tamura and M. Takenaka, J. Phys. Chem. C, 2011, 115, 14081–14092 CrossRef CAS.
- S. Lazzari, P. M. Theiler, Y. Shen, C. W. Coley, A. Stemmer and K. F. Jensen, Langmuir, 2018, 34, 3307–3315 CrossRef CAS PubMed.
- M. A. Watzky and R. G. Finke, J. Am. Chem. Soc., 1997, 119, 10382–10400 CrossRef CAS.
- W. W. Laxson and R. G. Finke, J. Am. Chem. Soc., 2014, 136, 17601–17615 CrossRef CAS PubMed.
- T.-H. Yang, H.-C. Peng, S. Zhou, C.-T. Lee, S. Bao, Y.-H. Lee, J.-M. Wu and Y. Xia, Nano Lett., 2017, 17, 334–340 CrossRef CAS PubMed.
- X. Yin, M. Shi, J. Wu, Y.-T. Pan, D. L. Gray, J. A. Bertke and H. Yang, Nano Lett., 2017, 17, 6146–6150 CrossRef CAS PubMed.
- M. Sakamoto, D. Tanaka and T. Teranishi, Chem. Sci., 2013, 4, 824–828 RSC.
- B. Reiser, L. González-García, I. Kanelidis, J. Maurer and T. Kraus, Chem. Sci., 2016, 7, 4190–4196 RSC.
- S. R. K. Perala and S. Kumar, Langmuir, 2013, 29, 9863–9873 CrossRef CAS PubMed.
- S. Mozaffari, W. Li, C. Thompson, S. Ivanov, S. Seifert, B. Lee, L. Kovarik and A. M. Karim, JoVE, 2018, e57667 Search PubMed.
- W. Li, S. Ivanov, S. Mozaffari, N. Shanaiah and A. M. Karim, Organometallics, 2018, 38, 451–460 CrossRef.
- A. M. Smith, L. E. Marbella, K. A. Johnston, M. J. Hartmann, S. E. Crawford, L. M. Kozycz, D. S. Seferos and J. E. Millstone, Anal. Chem., 2015, 87, 2771–2778 CrossRef CAS PubMed.
- R. Dinkel, B. Braunschweig and W. Peukert, J. Phys. Chem. C, 2016, 120, 1673–1682 CrossRef CAS.
- S. R. K. Perala and S. Kumar, Langmuir, 2014, 30, 12703–12711 CrossRef CAS.
- M. Harada and R. Ikegami, Cryst. Growth Des., 2016, 16, 2860–2873 CrossRef CAS.
-
G. Bergeret, P. Gallezot, G. Ertl, H. Knözinger and J. Weitkamp, Handbook of heterogeneous catalysis, VCH, Weinheim, 1997, vol. 2, p. 439 Search PubMed.
- J. VandeVondele, M. Krack, F. Mohamed, M. Parrinello, T. Chassaing and J. Hutter, Comput. Phys. Commun., 2005, 167, 103–128 CrossRef CAS.
- J. P. Perdew, K. Burke and M. Ernzerhof, Phys. Rev. Lett., 1996, 77, 3865 CrossRef CAS.
- S. Grimme, J. Antony, S. Ehrlich and H. Krieg, J. Chem. Phys., 2010, 132, 154104 CrossRef.
- M. Crespo-Quesada, A. Yarulin, M. Jin, Y. Xia and L. Kiwi-Minsker, J. Am. Chem. Soc., 2011, 133, 12787–12794 CrossRef CAS.
- H. Ramezani-Dakhel, P. A. Mirau, R. R. Naik, M. R. Knecht and H. Heinz, Phys. Chem. Chem. Phys., 2013, 15, 5488–5492 RSC.
- S. Özkar and R. G. Finke, Langmuir, 2017, 33, 6550–6562 CrossRef PubMed.
- I. Breßler, B. R. Pauw and A. F. Thünemann, J. Appl. Crystallogr., 2015, 48, 962–969 CrossRef PubMed.
- B. R. Pauw, J. S. Pedersen, S. Tardif, M. Takata and B. B. Iversen, J. Appl. Crystallogr., 2013, 46, 365–371 CrossRef CAS PubMed.
- J. r. Polte, T. T. Ahner, F. Delissen, S. Sokolov, F. Emmerling, A. F. Thünemann and R. Kraehnert, J. Am. Chem. Soc., 2010, 132, 1296–1301 CrossRef CAS.
- X. Chen, J. Schröder, S. Hauschild, S. Rosenfeldt, M. Dulle and S. Förster, Langmuir, 2015, 31, 11678–11691 CrossRef CAS PubMed.
- W. Fang, J. Chen, Q. Zhang, W. Deng and Y. Wang, Chem.–Eur. J., 2011, 17, 1247–1256 CrossRef CAS PubMed.
- Z. Zhang, Z. Wang, S. He, C. Wang, M. Jin and Y. Yin, Chem. Sci., 2015, 6, 5197–5203 RSC.
- F. Wang, V. N. Richards, S. P. Shields and W. E. Buhro, Chem. Mater., 2013, 26, 5–21 CrossRef.
- D. Jose, J. E. Matthiesen, C. Parsons, C. M. Sorensen and K. J. Klabunde, J. Phys. Chem. Lett., 2012, 3, 885–890 CrossRef PubMed.
- R. Jin, C. Zeng, M. Zhou and Y. Chen, Chem. Rev., 2016, 116, 10346–10413 CrossRef CAS PubMed.
- B. Bhattarai, Y. Zaker, A. Atnagulov, B. Yoon, U. Landman and T. P. Bigioni, Acc. Chem. Res., 2018, 51, 3104–3113 CrossRef CAS PubMed.
- A. Desireddy, B. E. Conn, J. Guo, B. Yoon, R. N. Barnett, B. M. Monahan, K. Kirschbaum, W. P. Griffith, R. L. Whetten and U. Landman, Nature, 2013, 501, 399 CrossRef CAS PubMed.
- J. Aldana, N. Lavelle, Y. Wang and X. Peng, J. Am. Chem. Soc., 2005, 127, 2496–2504 CrossRef CAS PubMed.
- A. D. Allian, K. Takanabe, K. L. Fujdala, X. Hao, T. J. Truex, J. Cai, C. Buda, M. Neurock and E. Iglesia, J. Am. Chem. Soc., 2011, 133, 4498–4517 CrossRef CAS PubMed.
- J. Schrier and L.-W. Wang, J. Phys. Chem. B, 2006, 110, 11982–11985 CrossRef CAS PubMed.
- B. Shan, Y. Zhao, J. Hyun, N. Kapur, J. B. Nicholas and K. Cho, J. Phys. Chem. C, 2009, 113, 6088–6092 CrossRef CAS.
- Z. Li and X. Peng, J. Am. Chem. Soc., 2011, 133, 6578–6586 CrossRef CAS PubMed.
- F. Dufour, B. Fresch, O. Durupthy, C. Chanéac and F. Remacle, J. Phys. Chem. C, 2014, 118, 4362–4376 CrossRef CAS.
- M. G. Taylor and G. Mpourmpakis, Nat. Commun., 2017, 8, 15988 CrossRef CAS.
- M. Evans and M. Polanyi, Trans. Faraday Soc., 1936, 32, 1333–1360 RSC.
- J. Brønsted and K. Pedersen, Z. Phys. Chem., 1924, 108, 185–235 Search PubMed.
- M. Temkin, Acta Physicochim. URSS, 1940, 12, 327–356 CAS.
- K. Y. Foo and B. H. Hameed, Chem. Eng. J., 2010, 156, 2–10 CrossRef CAS.
- J. D. Gonzalez, K. Shojaee, B. S. Haynes and A. Montoya, Phys. Chem. Chem. Phys., 2018, 20, 25314–25323 RSC.
- J. r. m. Zaffran, C. Michel, F. o. Delbecq and P. Sautet, J. Phys. Chem. C, 2015, 119, 12988–12998 CrossRef CAS.
-
L. G. Arnaut, S. J. Formosinho and H. Burrows, Chemical kinetics: from molecular structure to chemical reactivity, Elsevier, 2006 Search PubMed.
- E. M. Brauser, T. D. Hull, J. D. McLennan, J. T. Siy and M. H. Bartl, Chem. Mater., 2016, 28, 3831–3838 CrossRef CAS.
- E. Parks, G. Nieman, K. Kerns and S. Riley, J. Chem. Phys., 1998, 108, 3731–3739 CrossRef CAS.
- I. V. Yudanov, A. Genest, S. Schauermann, H.-J. Freund and N. Rösch, Nano Lett., 2012, 12, 2134–2139 CrossRef CAS PubMed.
- S. Jharimune, A. A. Sathe and R. M. Rioux, Nano Lett., 2018, 18, 6795–6803 CrossRef CAS PubMed.
- C. Dong, C. Lian, S. Hu, Z. Deng, J. Gong, M. Li, H. Liu, M. Xing and J. Zhang, Nat. Commun., 2018, 9, 1252 CrossRef.
- N. Semagina, A. Renken and L. Kiwi-Minsker, J. Phys. Chem. C, 2007, 111, 13933–13937 CrossRef CAS.
- D. Tomanek, S. Mukherjee and K. Bennemann, Phys. Rev. B: Condens. Matter Mater. Phys., 1983, 28, 665 CrossRef CAS.
- Z. Yan, M. G. Taylor, A. Mascareno and G. Mpourmpakis, Nano Lett., 2018, 18, 2696–2704 CrossRef CAS PubMed.
- L. Li, A. H. Larsen, N. A. Romero, V. A. Morozov, C. Glinsvad, F. Abild-Pedersen, J. Greeley, K. W. Jacobsen and J. K. Nørskov, J. Phys. Chem. Lett., 2012, 4, 222–226 CrossRef PubMed.
- B. Han, C. Miranda and G. Ceder, Phys. Rev. B: Condens. Matter Mater. Phys., 2008, 77, 075410 CrossRef.
Footnote |
| † Electronic supplementary information (ESI) available. See DOI: 10.1039/c9na00348g |
|
| This journal is © The Royal Society of Chemistry 2019 |

 Open Access Article
 This Open Access Article is licensed under a Creative Commons Attribution-Non Commercial 3.0 Unported Licence
 b,
Soenke
Seifert
c,
Byeongdu
Lee
b,
Soenke
Seifert
c,
Byeongdu
Lee
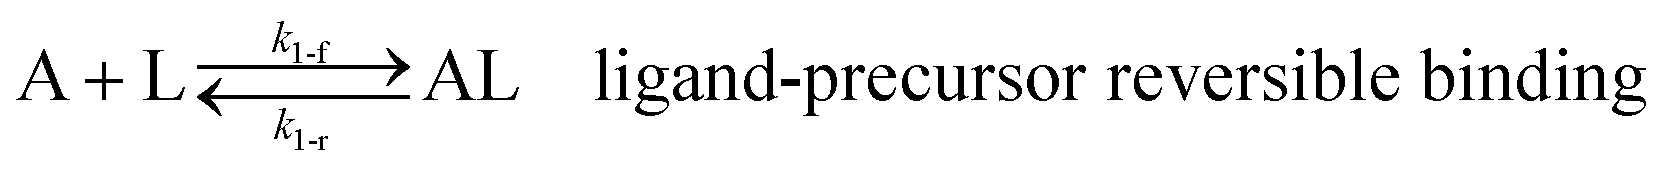
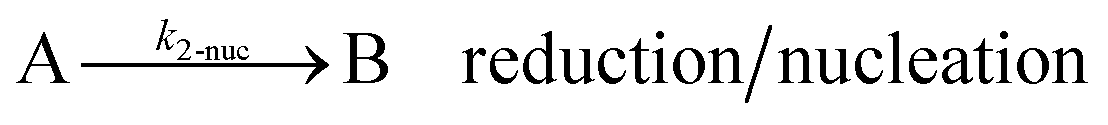


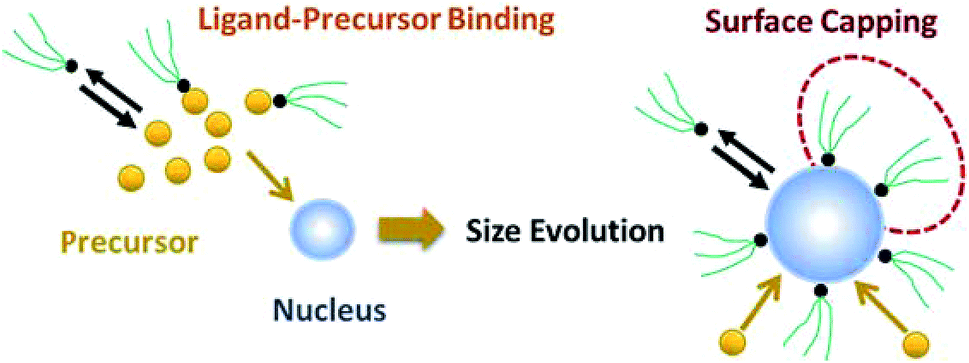


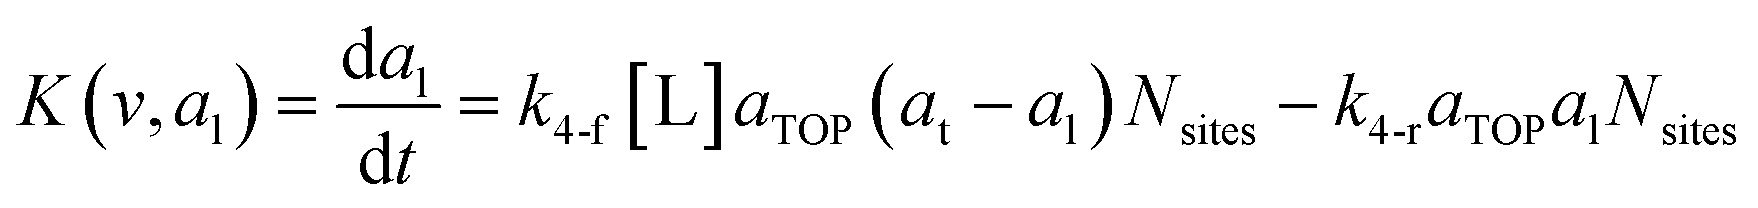
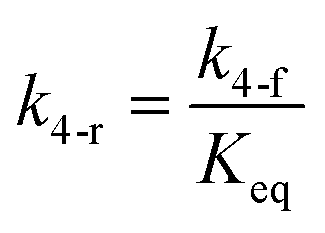 . The constant parameters (i.e. Nsites, aTOP, vPd, and etc.) are summarized in Table S1.† To extract the properties of the size distribution, the general moments of distribution (Mi,k) can be defined as
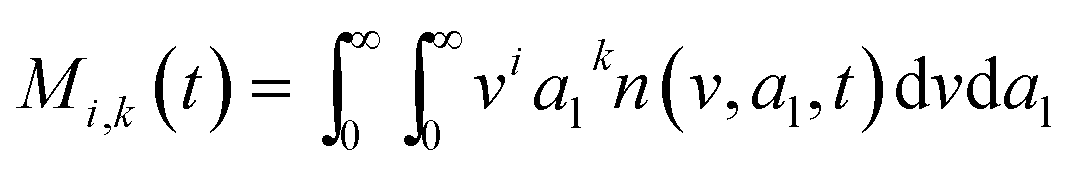
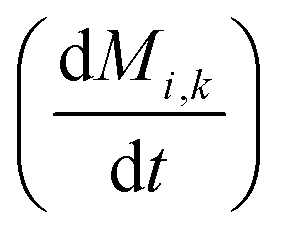 , the governing population balance eqn (5) needs to be multiplied by vialk and integrated with respect to both v and al from 0 to ∞.54 Using the generic moments of size distribution, the concentration of nanoparticles (Np), number average diameter (Dave), width of size distribution (σ), polydispersity (P), and the average fractional surface coverage (Fc; i.e. the ligand capped surface area over total nanoparticle surface area) as a function of time for spherical shape nanoparticle can be formulated as follows:
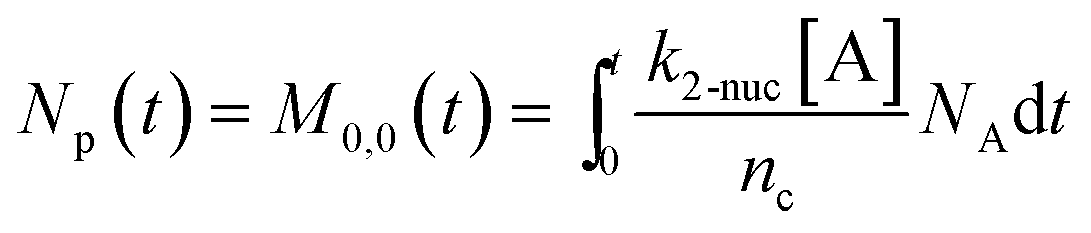
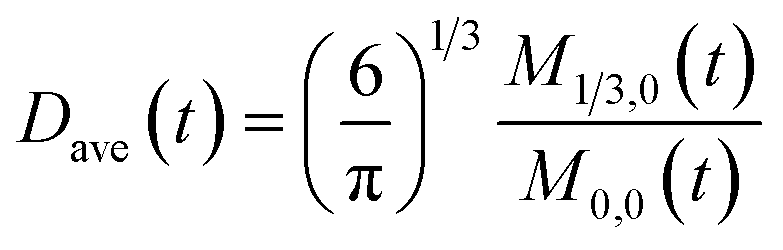
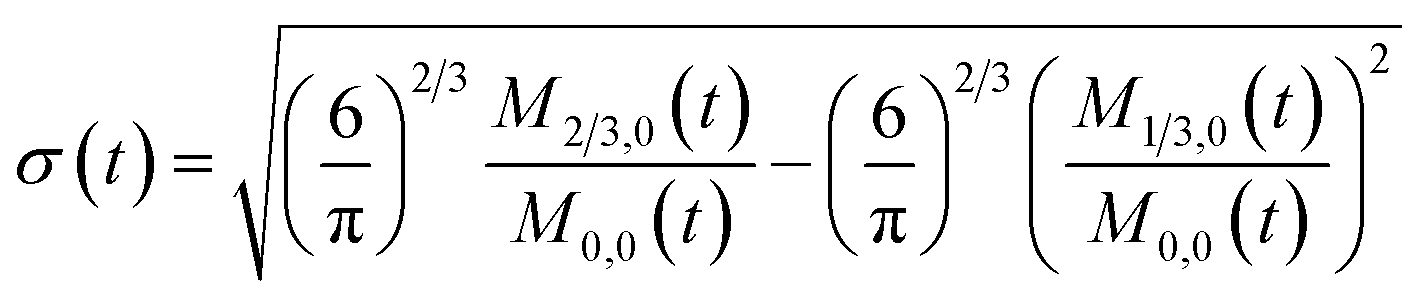
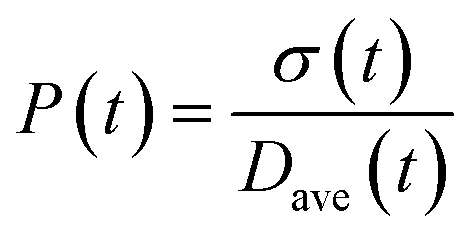
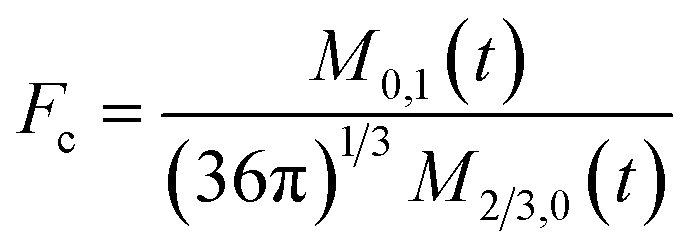
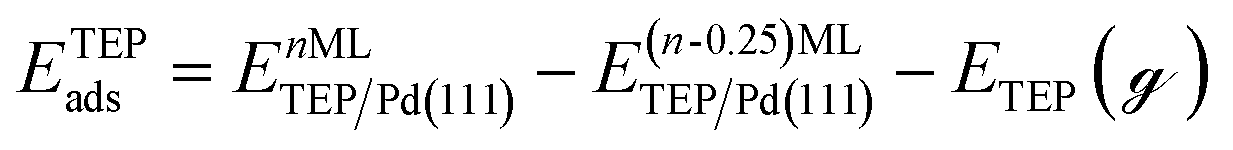

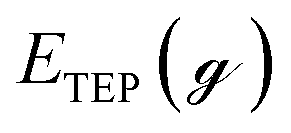 is the energy of TEP molecule in the gas phase. EmMLPd–TEP@TEP/Pd(111) is the energy of the Pd(111) surface with a Pd–TEP complex (Pd single atom bound to a TEP molecule) adsorbed on the surface at a given coverage of TEP (m = 0.0 ML, 0.25 ML, 0.50 ML, 0.75 ML, corresponding to zero, one, two and three TEP molecules on the surface, respectively), EmMLTEP/Pd(111) is the energy of the Pd(111) surface at a TEP-coverage of m and
 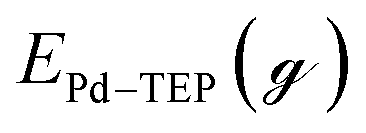 is the energy of Pd–TEP molecule in the gas phase.
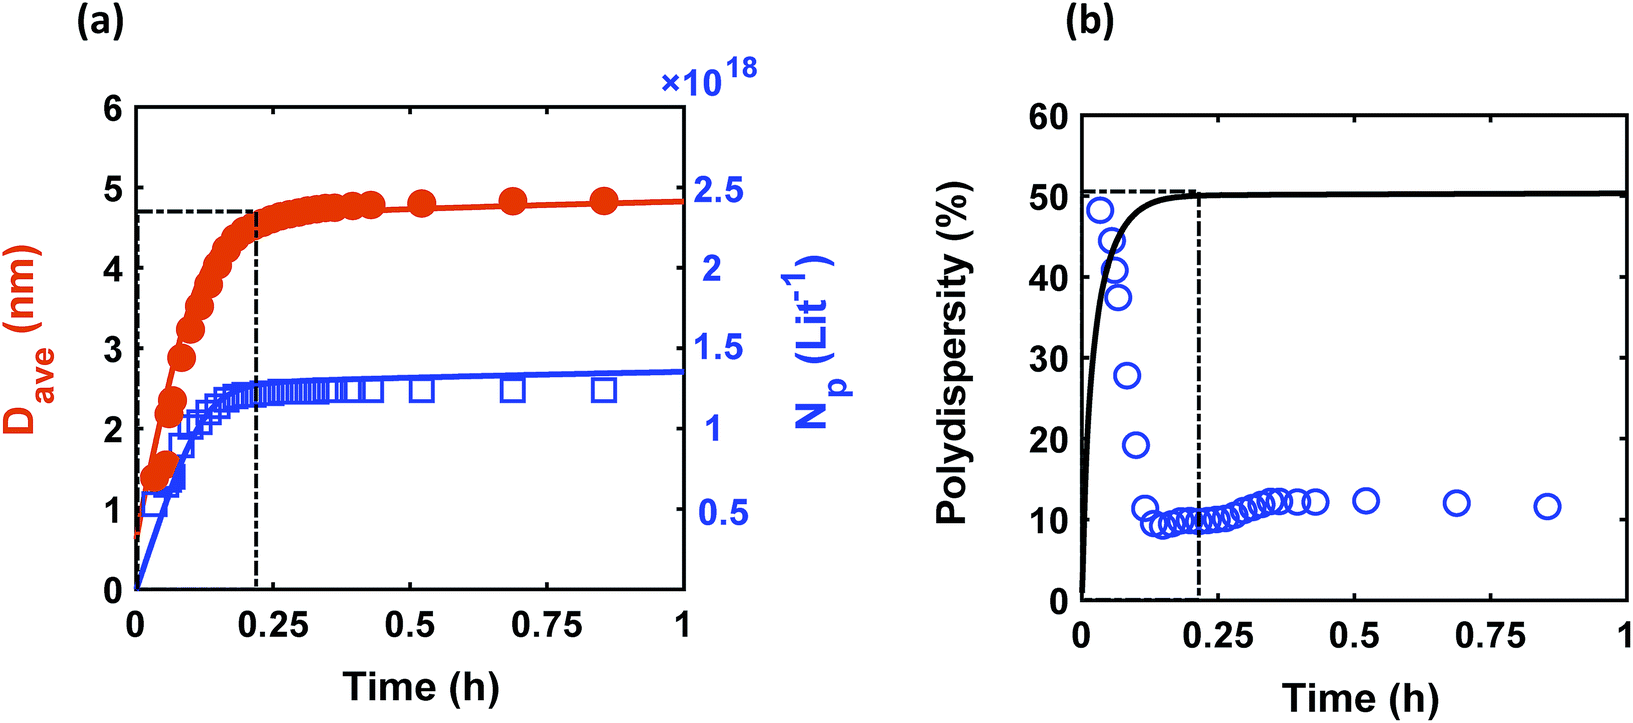
 . Symbols (circles and squares) and lines correspond to the experimental data from in situ SAXS and modeling results, respectively. The window at early times shows the overlap of nucleation and growth (increase in concentration of nanoparticles and average diameter) and highlights the concomitant decrease in polydispersity. Experimental conditions: 10 mM Pd(OAc)2 in 1
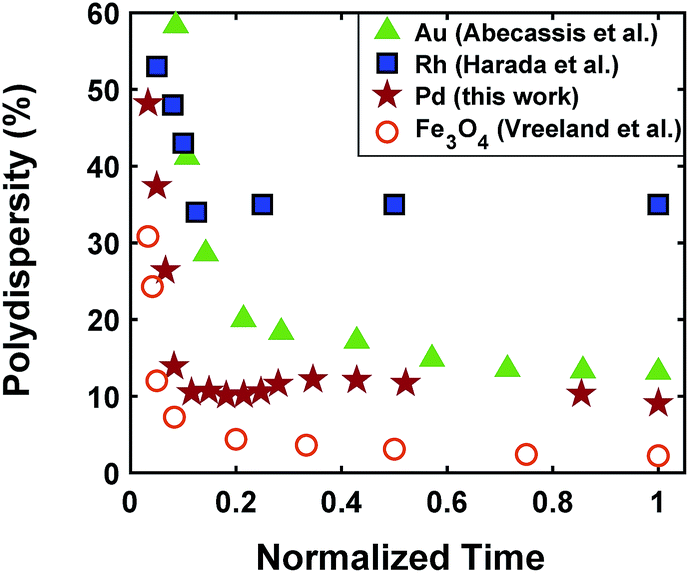
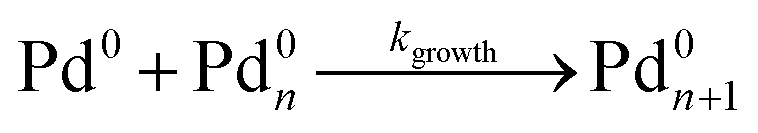 ) and similar results were obtained as the autocatalytic surface growth case shown in Fig. 2 (see the reaction network and simulation results for growth via monomer addition in Table S5 and Fig. S6†). Unlike the experimentally observed size focusing, the model predicts an increase in polydispersity regardless of the mode of growth. Therefore, we suspect that the increase in polydispersity is related to the PBM approach and not the reactions chosen. In particular, to solve the PBM equations, the ligand-surface coverage was assumed to be independent of size. In other words, while the model accounts for the ligand-surface coverage of the entire population as it evolves with time (see Fig. S7† for the time evolution of average surface coverage), at each time, the different size nanoparticles in the population were assumed to have the same ligand coverage. This assumption is similar to imposing an equilibrium on eqn (4) (i.e. the ligand-surface coverage is at equilibrium at all times). However, our sensitivity analysis shows that the average diameter and concentration of nanoparticles are strongly affected by altering the rate constants for the ligand–nanoparticle binding indicating the importance of accounting for both ligand association and dissociation reactions (see Fig. S8†). Furthermore, the ligand–nanoparticle binding was also reported to be time-dependent (not equilibrated) in particular in the early stage of reaction.7,47,54 Consequently, due to the continuous nucleation, the population consists of nanoparticles with different size and also different “age” (time since nucleation) resulting in a ligand-surface coverage that depends on size and time as also described by Lazzari et al.47 Therefore, it is important to correctly account for ligand-surface coverage to determine the effect of ligand affinity and continuous nucleation on evolution of polydispersity and will be investigated next.
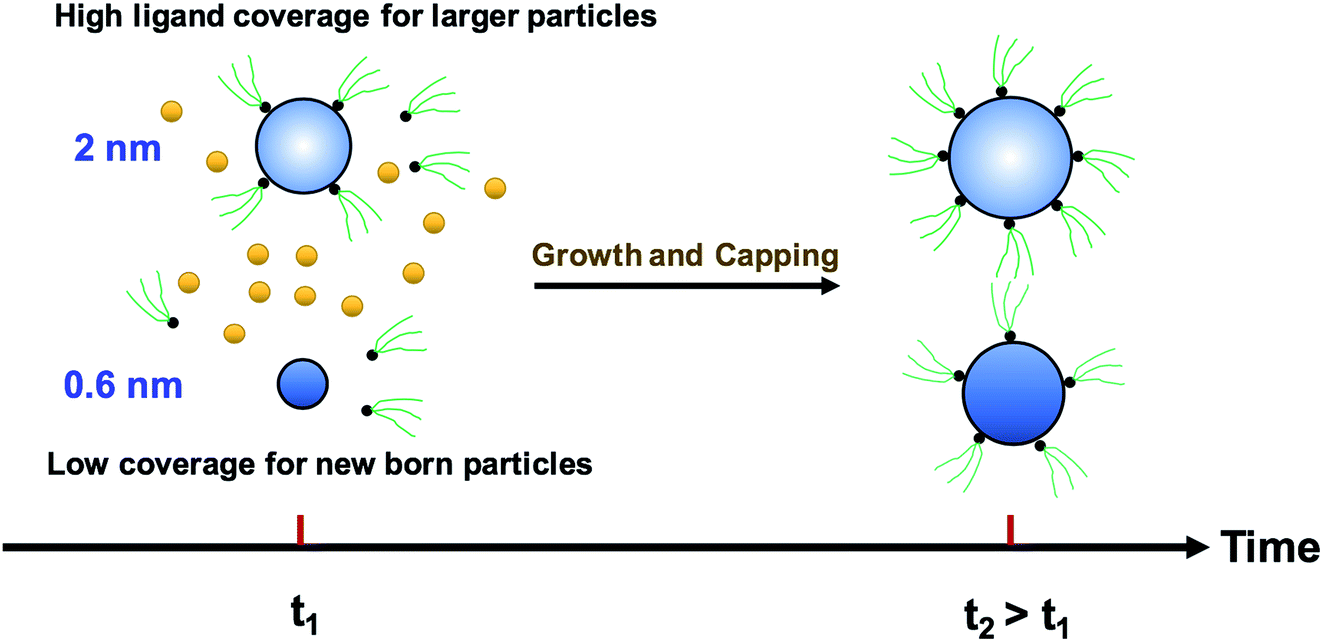
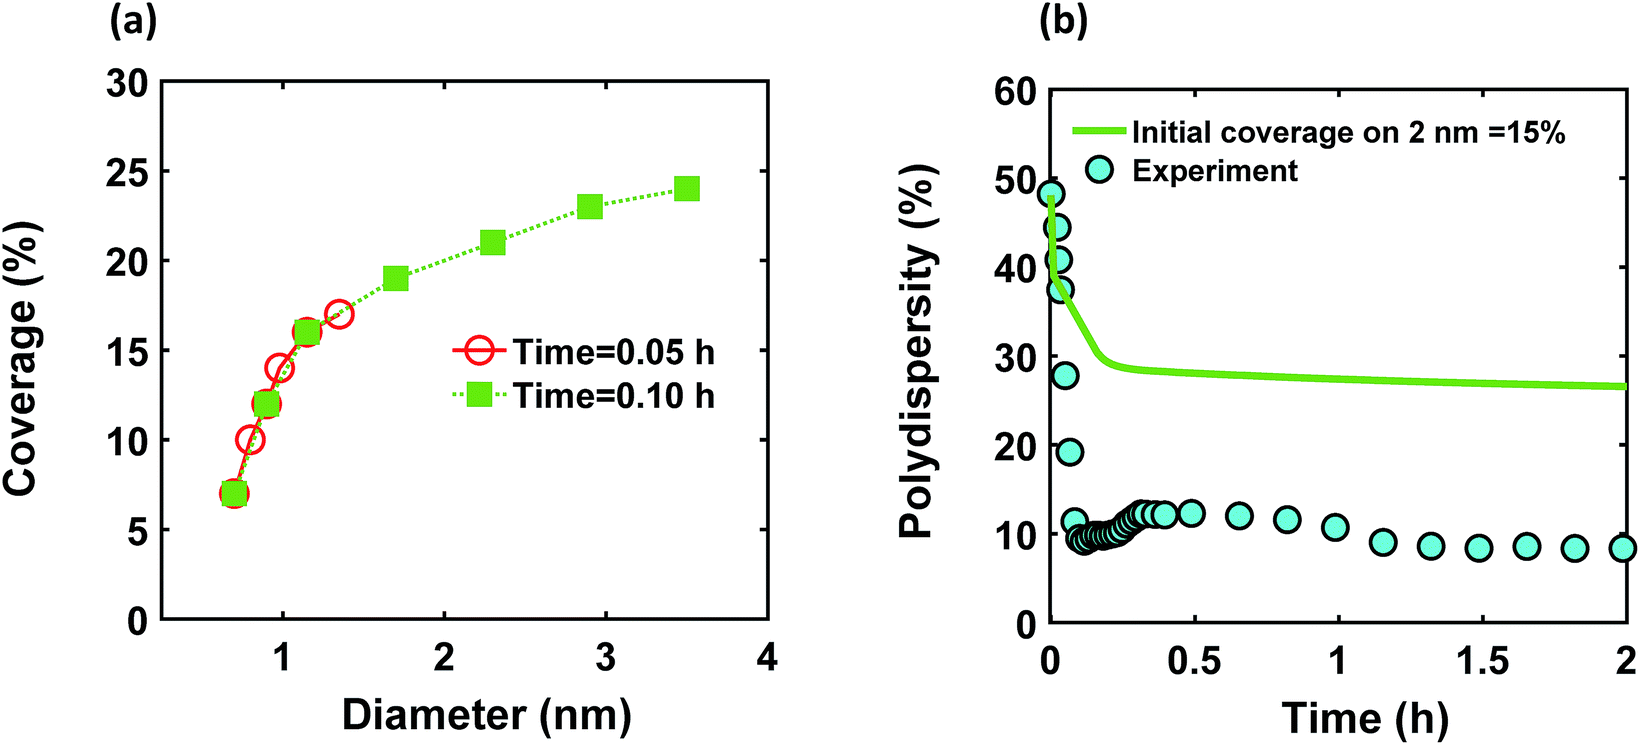
 . At time zero, the 2 nm nanoparticle population has 15% initial ligand coverage, while the initial coverage of smaller size population; 0.6 nm, is zero. Experimental conditions: 10 mM Pd(OAc)2 in 1
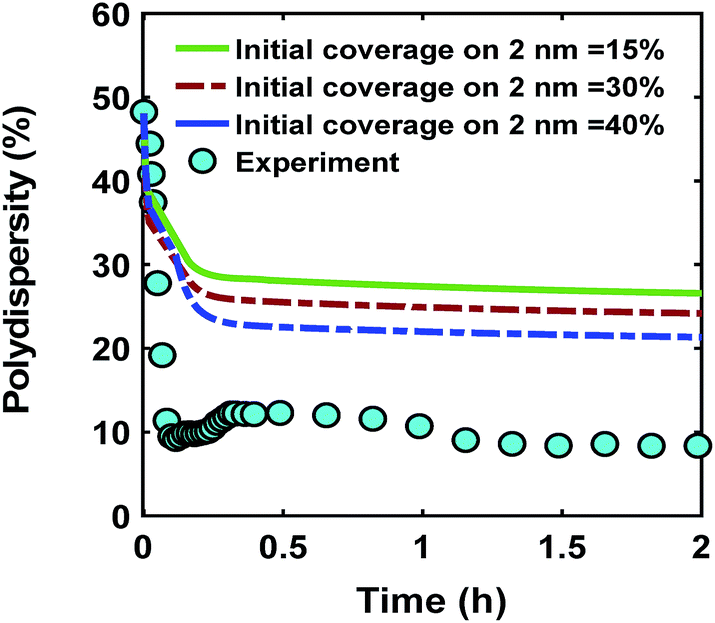
 in the case of continuous nucleation. The maximum coverage for the cases with 15%, 30%, and 40% initial ligand coverage on 2 nm nanoparticles is 32%, 45%, and 55%, respectively. Nucleation rate (model = experiment).
 , and the higher coverage on larger nanoparticles than smaller ones, see Fig. 5a) could affect the growth rate to counteract the size defocusing effect caused by continuous nucleation and decrease the polydispersity overtime. We then show the effect of size-dependent (i.e. case (i)) intrinsic growth rate and ligand–nanoparticle binding and their contribution to the size focusing of metal nanoparticles.
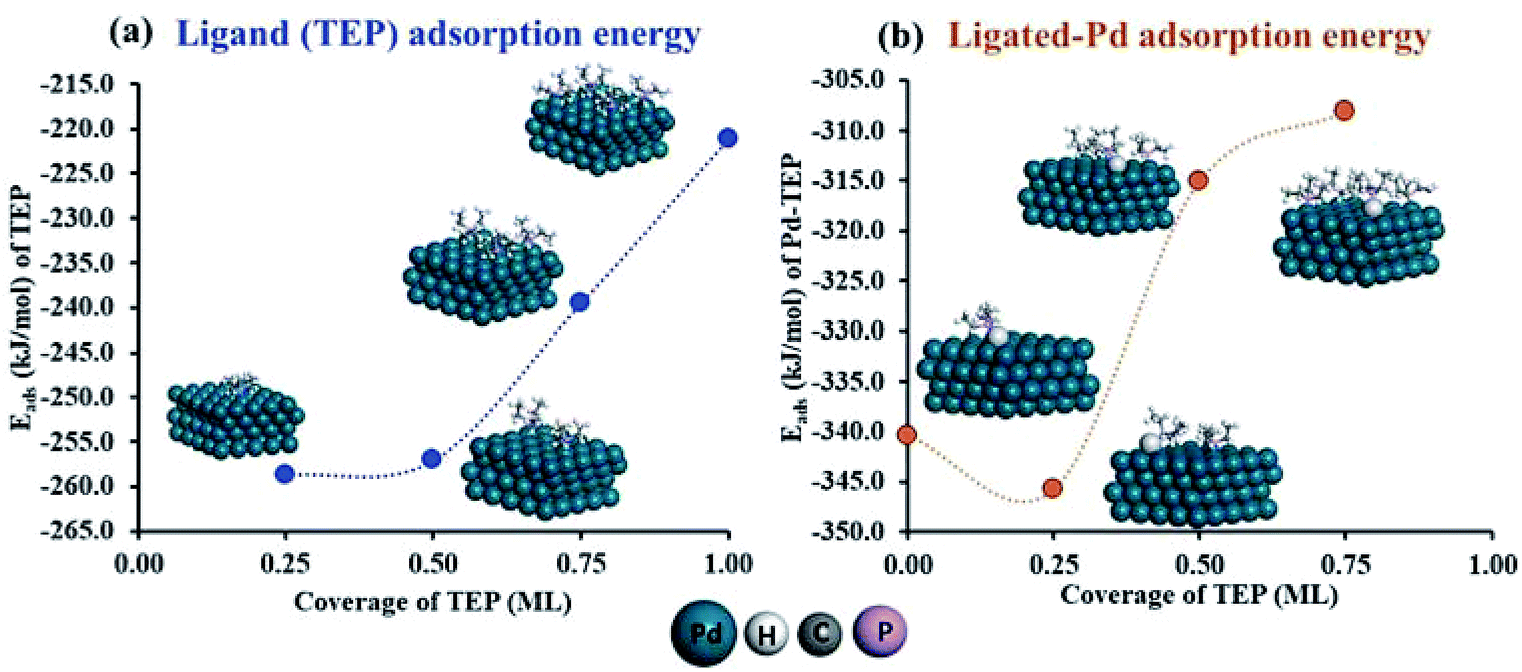
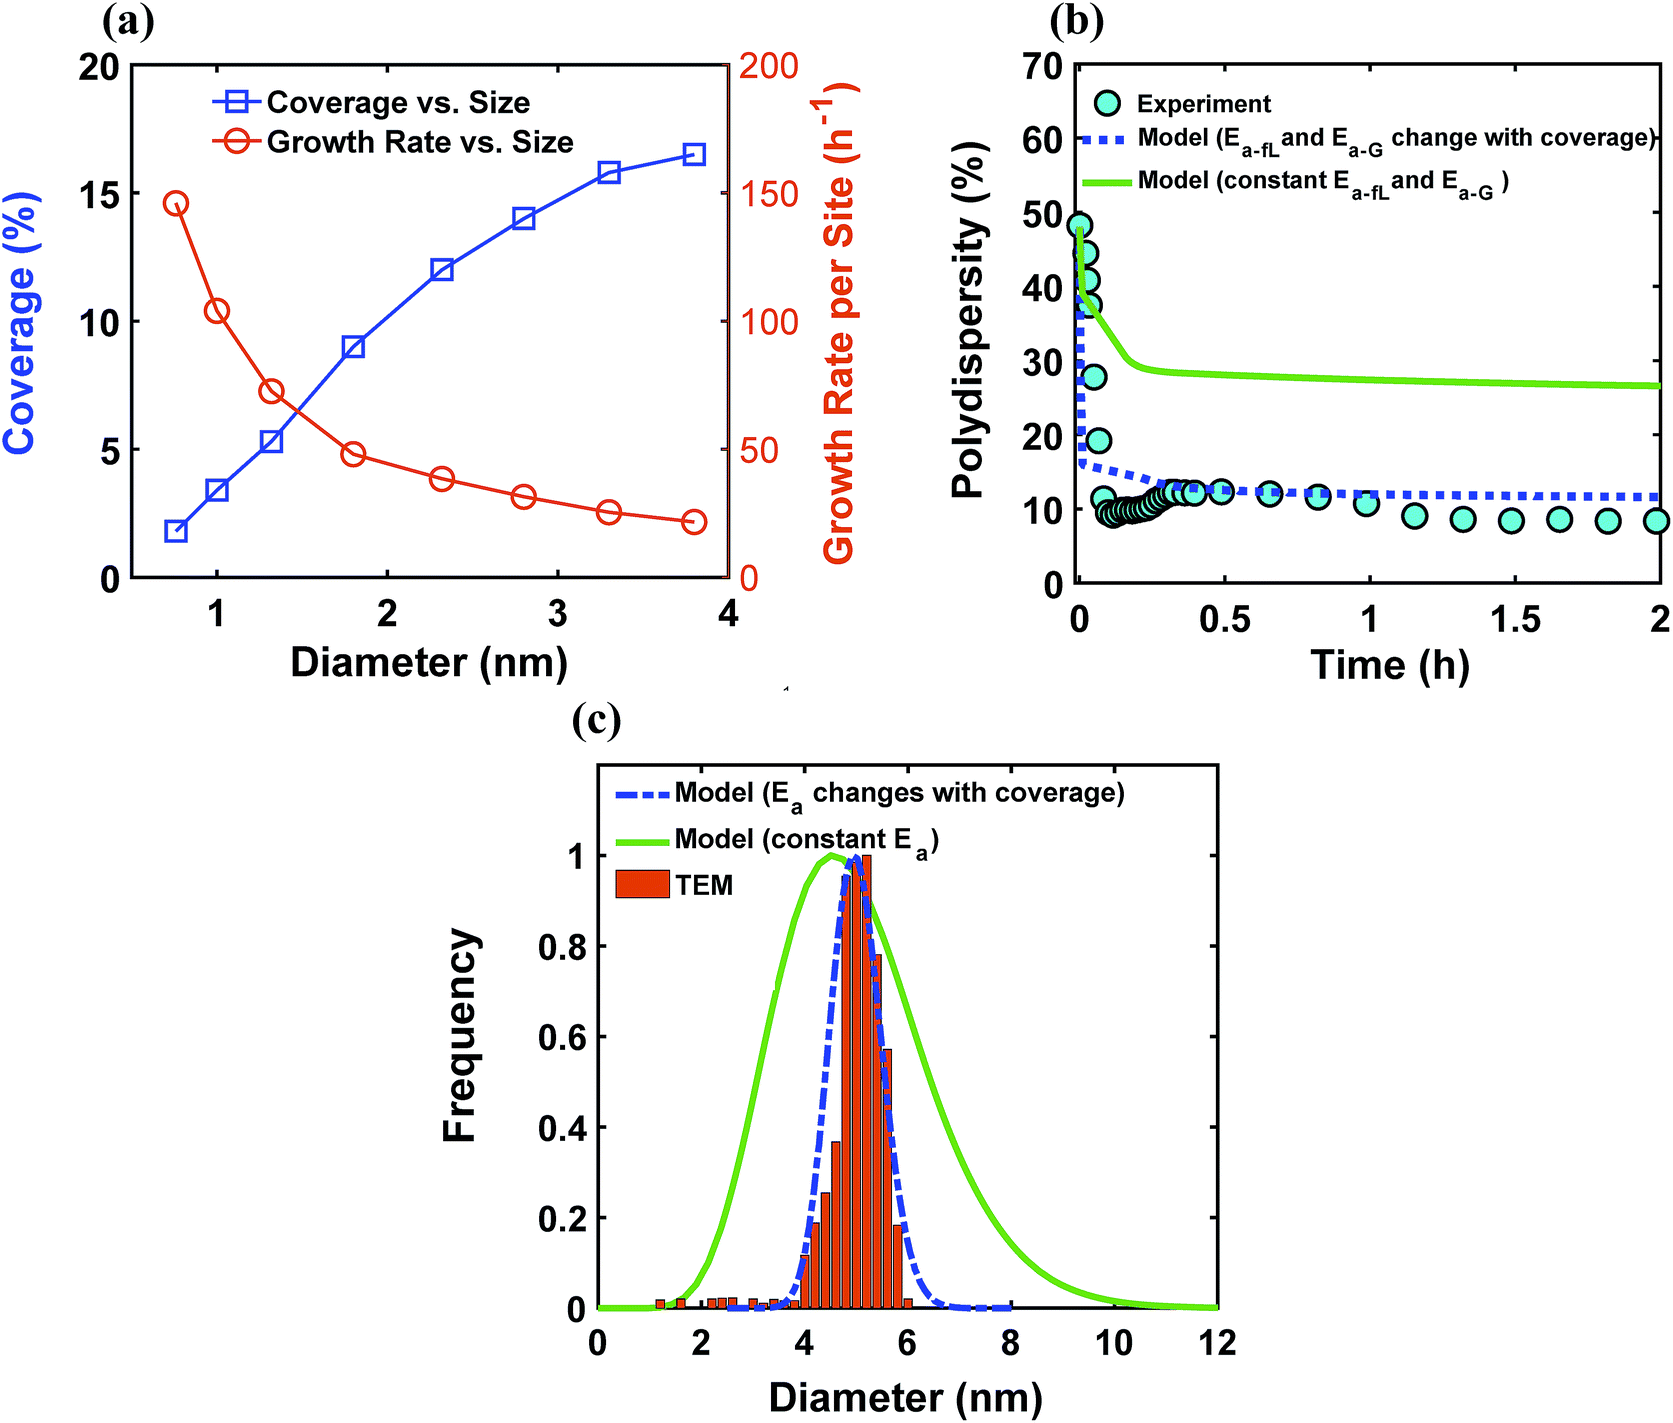
 for two different cases; coverage-independent (green line) and coverage-dependent (blue dashed line) growth rate constant, and (c) comparison of the particle size distribution (frequency) for the two cases with the size distribution from TEM. In the case of coverage-independent growth rate constant (green lines), the 2 nm nanoparticle population starts with 15% initial ligand coverage and the activation energies are not affected by coverage (the initial coverage of smaller size population; 0.6 nm, is zero in all cases). In the case of coverage-dependent growth rate constant (blue dashed line), the 2 nm nanoparticles population starts with 15% ligand surface coverage and the surface coverage affects both the enthalpy and activation energies for ligand–nanoparticle binding and surface growth linearly according to Table 1. Nucleation rate (model = experiment). The results were unaffected by the initial size of the starting two populations as shown in Fig. S17† for 1 and 3 nm instead of 0.6 and 2 nm.
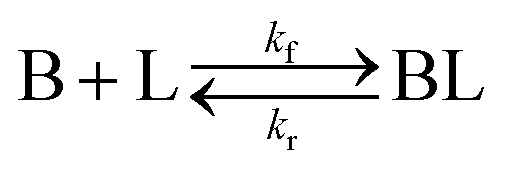 ) has a major contribution to the size focusing behaviour, independent of the growth pathway.
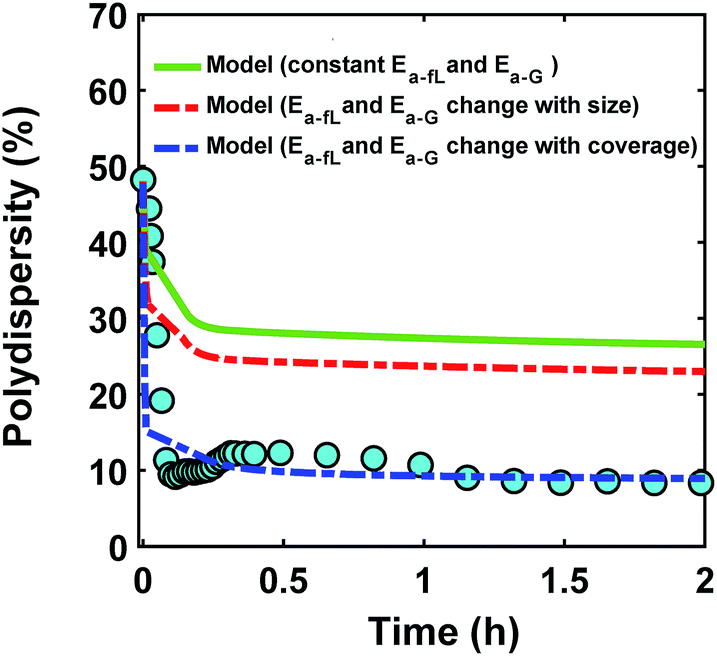
 for three different cases (circles are experimental data). In the first case (green line), the activation energies are not affected by coverage and/or nanoparticle size. In the second case (red dashed line), the size affects both the enthalpy and activation energies for growth and ligand–nanoparticle binding. In the third case, the surface coverage affects both the enthalpy and activation energies for ligand–nanoparticle binding and surface growth.