Synthesis of silicon complexes from rice husk derived silica nanoparticles†
Weixing
Wang
*a,
Jarett C.
Martin
b,
Rongcai
Huang
b,
Wenxi
Huang
a,
Anhua
Liu
c,
Aijie
Han
d and
Luyi
Sun
*b
aMinistry of Education Key Laboratory of Enhanced Heat Transfer & Energy Conservation, School of Chemistry and Chemical Engineering, South China University of Technology, Guangzhou, China 510640. E-mail: cewxwang@scut.edu.cn; Fax: 8620-22236985; Tel: 8620-22236985
bDepartment of Chemistry and Biochemistry & Materials Science, Engineering, and Commercialization Program, Texas State University–San Marcos, San Marcos, TX 78666. E-mail: luyi.sun@txstate.edu; Fax: (512) 245-2374; Tel: (512) 245-5563
cSchool of Materials Science and Engineering, South China University of Technology, Guangzhou, China 510640
dDepartment of Chemistry, The University of Texas–Pan American, Edinburg, TX 78539-2999
First published on 2nd August 2012
Abstract
Organosilicon complexes were synthesized via a green chemical process using silica nanoparticles derived from rice husk (RH) biomass. By controlling the pre-treatment of RHs and pyrolysis conditions, silica samples with various surface areas and degrees of crystallinity were synthesized. Such silica can be converted to silicon complexes via a low temperature approach. The synthesized silicon complexes were characterized by 1H, 13C, 29Si nuclear magnetic resonance and elemental analysis. Overall, the biogenic silica nanoparticles with high surface area and low crystallinity exhibit high reactivity, comparable to commercial fumed silica. Considering their high reactivity and low cost, such biogenic silica nanoparticles from RHs are ideal starting materials to produce organosilicon compounds.
Introduction
Organosilicon compounds are a group of important materials and are used in a wide variety of areas including biocides, polymers, advanced ceramics and electronic components.1 However, their synthesis relies mainly on the carbothermal reduction of silica to silicon and subsequent reaction between silicon and alkyl or aryl chloride.1–4 This multi-step approach involves high temperature, high pressure, and strong acidity, which is energy-intensive, expensive, and eco-hazardous.1–3,5 Thus, it is highly desirable to seek new approaches that are more economical and environmentally benign, which may in turn help widen the applications of organosilicon compounds.To address the above challenge, several groups have explored alternative approaches, which bypass the carbothermal process, to synthesize organosilicon compounds from silica.2,3,6–13 Such approaches typically require much lower reaction temperatures and energy consumption than the carbothermal process.2,3,6–13 In particular, Laine and coworkers2,3 invented a very promising one-step reaction which can directly convert silica to various silicon complexes via a reaction with an alkali or alkali earth hydroxide and ethylene glycol (EG). The ultimate goal for these researches is to produce organosilicon compounds directly from low cost silica resources, such as sand, which is widely available on earth.2,14 However, when sand is used as the starting material, it requires a much longer reaction time (>200 h) due to its low reactivity,2 which sets a huge obstacle for commercial production. While silica gel exhibits high reactivity and yield,2,3 the high cost of silica gel diminishes the advantage of this novel approach. Therefore, it is highly desirable to seek an alternative silica resource which is of low cost and possesses sufficiently high chemical reactivity, so that it can be converted to organosilicon compounds via one of the developed low temperature approaches at high reaction rate and yield.
Rice husk (RH), the byproduct of rice milling, is a major agricultural waste. Dry RH contains ca. 15 to 28 wt% of hydrated silica, depending on the variety, climate, and geographic location.15,16 Silicon is an important element for rice growth, and sometimes is even considered as a nutrition for rice.17 Silicon enters into rice in the form of water soluble silicic acid, which is subsequently polymerized and precipitated as amorphous silica.5,18–20 The biosilicification process under mild physiological conditions generates biogenic silica nano-structured frameworks, which contribute to the compression resistance and rigidity of cell walls.17,21–23 A typical approach to derive silica from RHs is to degrade the organic components in RHs.15 RH ash contains a high concentration of silica, which provides an abundant and low cost alternative source of silica for many potential applications.15 Chandrasekhar et al.24 used RH ash to prepare a hexacoordinate silicon complex. They pyrolyzed RHs at 1000 °C and obtained crystalline silica particles (ca. 5 μm in diameter) as the starting material. While the reaction did proceed, it required a long reaction time of 96 h, which did not show an obvious advantage over beach sand.24 The low reaction rate is believed mainly to be owing to the high crystallinity of the silica they used. Earlier researches have suggested that both the surface area and crystallinity of silica are critical to achieve a high rate of reaction to form silicon complexes.2,3,11 Amorphous silica with high surface area is highly preferred for such low temperature reactions.
Recently, we managed to derive amorphous porous silica nanoparticles from RHs.25,26 It is expected that such amorphous porous silica nanoparticles with high surface area will be a much better candidate to produce organosilicon complexes compared to the crystalline RH ash reported before.24 In this work, we evaluated the reactivity of biogenic silica from RHs for the synthesis of silicon complexes, and explored how significantly the crystallinity and surface area of silica will affect its reactivity. Considering the low cost of such amorphous porous silica nanoparticles from RHs, if they can be converted to organosilicon complexes at a reasonably high reaction rate and yield, they may open the door for practical production of organosilicon compounds directly from inorganic silica.
Experimental
Analytical reagent grade hydrochloric acid (37 wt%), KOH and ethylene glycol (EG) were used as received. Methanol, anhydrous ethanol, and acetonitrile were dried using 4 Å molecular sieves. Crystalline silica powders (analytical reagent grade, 20–40 μm in diameter) were purchased from Shanghai Aijian Chemical Reagent Company and used as a control to mimic natural sand. A fumed silica sample was obtained from Guangzhou Tiantai Chemical Company.The RHs used in this project were obtained from Guangdong Academy of Agricultural Science, China. Earlier researches have shown that both the pyrolysis temperature and the removal of metal cation impurities (especially K+) that might catalyze the melting of silica are very critical to control the size and crystallinity of silica nanoparticles from RHs.15,26 Thus, a series of pretreatments and pyrolysis conditions were adopted to synthesize silica samples with various morphologies for evaluation, as summarized in Table 1.
| Pretreatment | Pyrolysis T/°C | Pyrolysis time (h) | Sample ID | Sample color |
|---|---|---|---|---|
| None | Natural burning in an open field | RHS1 | Grey | |
| Rinsed with deionized water three times at room temperature and then dried at 100.0 °C for 24 h | 600 | 2 | RHS2-600 | Grey |
| 700 | 2 | RHS2-700 | Light grey | |
| 800 | 2 | RHS2-800 | Light grey | |
| Boiled in 10 wt% HCl for 2 h to remove metal impurities, then rinsed with deionized water, and finally dried at 100.0 °C for 24 h | 600 | 2 | RHS3-600 | Grey |
| 700 | 2 | RHS3-700 | White | |
| 800 | 2 | RHS3-800 | White | |
The reaction to form a pentacoordinate silicon complex (eqn (1)) was selected to evaluate the reactivity of the synthesized silica nanoparticles. 7.50 g of RH silica sample was reacted with 7.00 g of KOH and 135 mL of EG in a round bottom flask connected with a distillation setup at 200 °C with constant stirring. The commercial micro-sized silica (20–40 μm in diameter) and fumed silica were evaluated as controls.
 | (1) |
After reacting for a pre-determined amount of time (1, 2, or 8 h), the system was evacuated to remove most of the excessive ethylene glycol, and then was cooled down under the protection of nitrogen. The product, pentacoordinate silicon complex, KSi(OCH2CH2O)2OCH2CH2OH, crystallized and precipitated at the flask bottom together with the unreacted silica. The precipitated mixture was washed with anhydrous ethanol and acetonitrile, and subsequently mixed with methanol to dissolve the pentacoordinate silicon complex. Unreacted silica was obtained after filtration, while the dissolved pentacoordinate silicon complex was precipitated in acetonitrile, and then collected and dried in a vacuum oven at 130 °C for 2 h. Selected dried KSi(OCH2CH2O)2OCH2CH2OH samples were further purified by recrystallization in methanol/acetonitrile, and finally dried in a vacuum oven at 130 °C for 2 h for various characterizations.3
X-Ray diffraction (XRD) analysis was performed on a Rigaku D/MAX-III diffractometer with a monochromic copper Kα (λ = 0.1540 nm) radiation source. Scanning electron microscopy (SEM) images were acquired on a JEOL JSM 6330F Field Emission-SEM (FE-SEM) on sputter coated samples (ca. 3 nm of gold). Energy-dispersive spectroscopy (EDS) analysis was performed on a Link-Oxford-ISIS-300 EDS system. Transmission electron microscopy (TEM) characterization was carried out on a JEOL JEM-100CXII transmission electron microscope operated at 100 kV. The samples were ultrasonicated in ethanol. Then, a drop of ethanol suspension was placed on a carbon-coated copper grid followed by solvent evaporation in vacuum.
The surface area and porosity of the selected silica samples were characterized using a Micromeritics' Accelerated Surface Area and Porosimetry (ASAP) 2020 analyzer (Atlanta, Georgia, USA) by N2 sorption at 77 K. The samples were dried at 100 °C for 12 h prior to the test.
1H, 13C, and 29Si nuclear magnetic resonance (NMR) spectra were recorded on a Bruker DRX-400 NMR spectrometer using the recrystallized sample dissolved in CD3OD. 1H NMR spectrum was calibrated using the CD3OD residual solvent peak at 3.31 ppm.2713C and 29Si spectra were referenced to tetramethylsilane (TMS). Solid state 29Si cross-polarization magic angle spinning (CP/MAS) NMR analysis was acquired on a Bruker DRX-400 NMR spectrometer operating at 79. 5 MHz, and the 29Si chemical shifts were referenced to TMS.
Results and discussion
The hydrated silica in RHs is originally in amorphous phase.15 After pyrolysis reaction, silica exists in various levels of crystallinity and purity (as roughly indicated by color as summarized in Table 1) depending on the pretreatment and pyrolysis conditions. Natural burning of raw RHs in an open field generated RH ash, which was a mixture of off-white, grey, and black powders. Black color was contributed by the carbonaceous residues from the incomplete degradation of organic components in RHs. Off-white RH ash with a trace amount of grey/black particles were carefully collected, and hereafter referred to as RHS1. Overall, RHS1 exhibits a grey color after grinding. The X-ray diffraction (XRD) characterization showed that RHS1 is a mixture of amorphous and crystalline silica, as evidenced by the sharp diffraction peak imposed on a broad hump as shown in Fig. 1.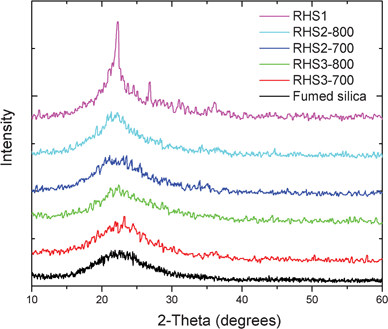 | ||
| Fig. 1 XRD patterns of silica obtained from various pretreated RHs under different pyrolysis conditions. | ||
A pyrolysis temperature of 600 °C appeared to be not sufficient to completely remove carbonaceous residues within 2 h, thus both RHS2-600 and RHS3-600 exhibit grey color. Evaluations of such grey colored silica samples suggested that the carbonaceous impurities did not negatively prevent the conversion of silica to form organosilicon compounds. However, they severely complicated the purification process. It is necessary to remove those carbonaceous impurities so that the synthesized organosilicon compounds can be used for potential commercial applications. Thus, RHS2-600 and RHS3-600, which contain appreciable amounts of carbonaceous residues, are not included in the following discussions.
Rinsing RHs with water helps significantly lower the overall crystallinity of the prepared silica, while the treatment with HCl turned out to be even more effective. This is because HCl treatment can effectively remove K+ cations, which can catalyze the melting of silica,15 while rinsing with water can only partially remove K+ cations, as evidenced by the elemental analysis of the selected silica samples (RHS1, RHS2-700, and RHS3-700) shown in Fig. S1 in the ESI.† Because of the effective removal of K+ cations, the HCl treated RHs appeared to be much less sensitive to the pyrolysis temperature compared to the water rinsed ones in terms of maintaining amorphous phase. For example, two hours pyrolysis of HCl treated RHs at a temperature up to 800 °C still resulted in amorphous silica. However, the silica obtained from the water rinsed RHs started to exhibit an appreciable level of crystallinity when the pyrolysis temperature was raised to 800 °C, as shown in Fig. 1.
The color of the prepared silica samples is also consistent with their crystallinity and pyrolysis temperature. RHS3-700 and RHS3-800 samples exhibit a white color, indicating they are free of carbonaceous residues. While RHS2-700 and RHS2-800 appear to contain a trace amount of carbonaceous residues, exhibiting a light grey color. That is because water rinse can only partially remove K+ cations. During the melting of silica particles catalyzed by K+ cations, a tiny amount of carbonaceous residues were encapsulated within the silica crystal structure, which cannot be removed even after two hours of pyrolysis at 800 °C.
The scanning electron microscopy (SEM) images of the silica samples are shown in Fig. 2. Two typical morphologies of RHS1 were observed: virtually completely melted silica (Fig. 2A) and partially melted silica forming an irregular porous structure (Fig. 2B). The results indicated that with increasing temperature, silica particles started to melt and gradually fused together. Since the RHs went through uncontrolled combustion, certain regions reached silica melt temperature and maintained at melting state long enough, which allowed the melt to merge. Upon cooling, they form crystalline silica. While for certain regions, owing to the insufficient heat supply, they cooled down before silica completely melted and fused. This led to the irregular porous structure.
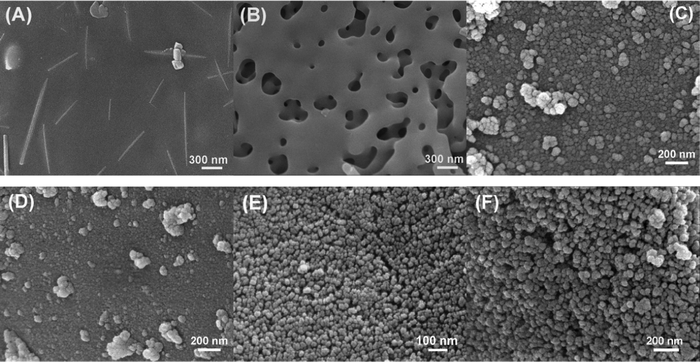 | ||
| Fig. 2 SEM images of silica samples. (A) and (B): RHS1; (C): RHS2-700; (D): RHS2-800; (E): RHS3-700; (F): RHS3-800. | ||
Fig. 2C and 2D present the morphology of RHS2-700 and RHS2-800, respectively. As the images clearly show, after 2 h of pyrolysis at 700 °C, the water rinsed RHs were converted to fine silica particles with a diameter ranging from ca. 30 to 80 nm. However, pyrolysis at a higher temperature of 800 °C for 2 h led to the melting of silica nanoparticles, resulting in semi-crystalline aggregates. Ultrafine silica nanoparticles were successfully obtained by pyrolyzing HCl treated RHs at 700 °C for 2 h. Silica nanoparticles with a narrow size distribution of ca. 20–30 nm were shown in Fig. 2E. Upon increasing the pyrolysis temperature to 800 °C, silica nanoparticle clusters formed, indicating the start of melting for some of the silica particles (Fig. 2F). The much less significant melting of silica nanoparticles shown in Fig. 2F compared to the ones shown in Fig. 2D is owing to the much more effective removal of K+ cations by HCl treatment than by water rinsing.26 Overall, the morphology of the silica samples shown in the SEM images is consistent with their crystallinity characterized by XRD as shown in Fig. 1.
Sample RHS3-700 was also imaged under transmission electron microscopy (TEM, shown in Fig. S2 in the ESI†). The particle size from TEM agrees with the SEM characterization. The surface area of selected silica samples was measured and is listed in Table 2. Their surface area is consistent with the sample crystallinity and morphology. The effect of silica surface area on its reactivity will be discussed later.
The reaction of silica with EG and KOH to produce a pentacoordinate silicon complex, KSi(OCH2CH2O)2OCH2CH2OH (eqn (1)),2,3 was selected to evaluate the reactivity of the synthesized silica samples from RHs, because this approach represents the state of the art on direct conversion of inorganic silica to silicon complexes,2,3 and such silicon complexes can be subsequently converted to a variety of organosilicon compounds.2,28–30
The detailed characterization results, including 1H, 13C, 29Si NMR spectra, solid-state 29Si cross-polarization magic angle spinning (CP/MAS) NMR spectrum, and energy-dispersive spectrum, all agree well with the literature data,2,3 and support the formation of KSi(OCH2CH2O)2OCH2CH2OH. The NMR spectra of the purified KSi(OCH2CH2O)2OCH2CH2OH samples from different silica resources are almost identical. Since the RHS3-700 sample exhibited the highest surface area and conversion rate (will be discussed in detail later), the following NMR spectra are all based on the KSi(OCH2CH2O)2OCH2CH2OH from RHS3-700.
Fig. 3 shows the 13C NMR spectrum of KSi(OCH2CH2O)2OCH2CH2OH dissolved in CD3OD. It has been revealed that KSi(OCH2CH2O)2OCH2CH2OH dissolves in CD3OD via a ligand exchange process2,3 as shown in eqn (2), instead of a simple dissolution process. This also explains why methanol is the only polar solvent to effectively dissolve KSi(OCH2CH2O)2OCH2CH2OH.2 The 13C NMR spectrum presented in Fig. 3 shows two peaks. The peak at ca. 64.4 ppm matches the free EG in solvent,3,27 while the one located at ca. 61.3 ppm is from the bonded EG as shown in eqn (2).3
 | (2) |
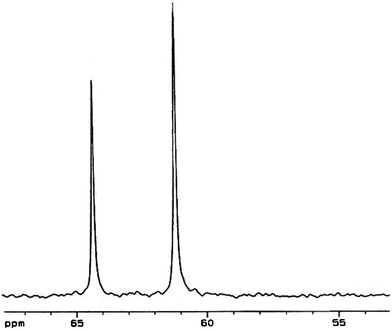 | ||
| Fig. 3 13C NMR spectra of KSi(OCH2CH2O)2OCH2CH2OH (dissolved in CD3OD) from RHS3-700. | ||
The 29Si CD3OD solution NMR spectrum of KSi(OCH2CH2O)2OCH2CH2OH shows a peak at −103.0 ± 0.3 ppm (Fig. 4). The Solid-state 29Si CP/MAS NMR spectrum of dried KSi(OCH2CH2O)2OCH2CH2OH (Fig. 4) exhibits the same −103 ppm peak. This shows that the silicon magnetic environment in the solid state is almost identical to its solution environment, indicating that the counter cations do not affect the magnetic environment of Si.3 The two weak peaks at 108.1 and 108.8 ppm in Fig. 4 are contributed by the polymeric glycolates, [KSi(OCH2CH2O)2.5]n.3 In addition, the solution 1H NMR spectrum (Fig. S3†) also shows high consistency with the above NMR characterizations, and supports the formation of KSi(OCH2CH2O)2OCH2CH2OH.
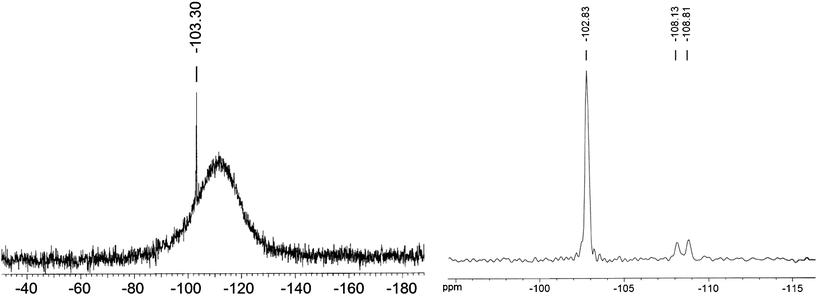 | ||
| Fig. 4 Left: 29Si NMR spectrum of KSi(OCH2CH2O)2OCH2CH2OH dissolved in CD3OD. Right: solid-state 29Si CP/MAS NMR spectrum of KSi(OCH2CH2O)2OCH2CH2OH. Both silicon complex samples were synthesized from RHS3-700. | ||
The elemental analysis result of KSi(OCH2CH2O)2OCH2CH2OH is shown in Fig. 5. It shows that the ratio of K/Si is 1.02. The slightly excessive K in the sample should be owing to the K+ residue from KOH. Overall, the concentration between K and Si supports the formation of KSi(OCH2CH2O)2OCH2CH2OH.
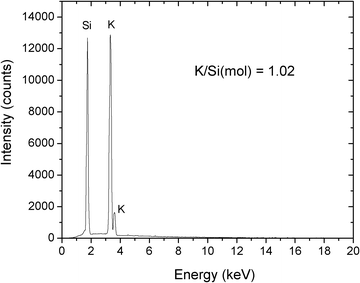 | ||
| Fig. 5 EDS spectrum of KSi(OCH2CH2O)2OCH2CH2OH from RHS3-700. | ||
The conversion data in Table 2 show that the silica from RHs exhibited much higher reactivity compared to the micro-sized crystalline silica particles. Overall, the conversion rates show a high consistency with the surface area of the silica samples. Both RHS2 and RHS3 silica samples exhibited reduced reactivity with increasing pyrolysis temperature from 700 to 800 °C. The reactivity trends of RHS2 and RHS3 silica samples show a good correlation with their crystallinity and morphology as shown in Fig. 1 and 2. After one hour of reaction, approximately 94% RHS3-700 silica was reacted; extending reaction time to two hours led to a higher conversion rate of 98%. The yield based on the recrystallized KSi(OCH2CH2O)2OCH2CH2OH is about 90% of theory for 2 h of reaction using RHS3 as the starting material. The reactivity of RHS3-700 is slightly lower than that of fumed silica, but the cost of RHS3-700 is estimated to be much lower. Even for RHS1 silica, a conversion rate of 56% was achieved, which is believed to be mainly contributed by its amorphous component. In contrast, the conversion rates for the reactions using micro-sized crystalline silica particles (mimicking natural sand) are only 2 and 6% for a reaction time of 1 and 8 h, respectively.
Conclusions
In summary, this work has clearly demonstrated that the biogenic silica nanoparticles from RHs can exhibit high reactivity if their morphology is properly controlled. Their high chemical reactivity is mainly attributed to their high surface area and low crystallinity. It is very critical to remove the impurities in RHs which might catalyze the melting of silica and thus resulting in the formation of large crystalline silica particles. And the pyrolysis temperature must be balanced to minimize the carbonaceous residues and meanwhile avoid the melting of silica. Thanks to their high reactivity and low cost, such biogenic silica nanoparticles from RHs can serve as an ideal starting material for producing organosilicon complexes. They may open the door to produce organosilicon compounds directly from low cost inorganic silica via an energy-conserving and economically viable green approach.Acknowledgements
This research is sponsored by the U.S. Environmental Protection Agency (P3 Award, No. SU-83529201) and the National Science Foundation (Partnerships for Research and Education in Materials, DMR-1205670). W.W. thanks the support by the Fundamental Research Funds for the Central Universities (No. 2011ZM0046) and the National Natural Science Foundation of China (No. 21176093). L.S. would like to acknowledge the U.S. Department of Agriculture (No. 2011-38422-30803), the American Chemical Society Petroleum Research Fund (No. 51833-UNI7), and the Welch Foundation for partial support for this research. We would like to thank Prof. Kecheng Gong for valuable discussions.References
- L. Rösch, P. John and R. Reitmeier, in Ullmann's Encyclopedia of Industrial Chemistry, Wiley-VCH Verlag GmbH & Co. KGaA, Wiley-VCH, Weinheim, 2000 Search PubMed.
- R. M. Laine, K. Y. Blohowiak, T. R. Robinson, M. L. Hoppe, P. Nardi, J. Kampf and J. Uhm, Nature, 1991, 353, 642–644 CrossRef CAS.
- K. Y. Blohowiak, D. R. Treadwell, B. L. Mueller, M. L. Hoppe, S. Jouppi, P. Kansal, K. W. Chew, C. L. S. Scotto, F. Babonneau, J. Kampf and R. M. Laine, Chem. Mater., 1994, 6, 2177–2192 CrossRef CAS.
- J. Barton Thomas and P. Boudjouk, in Silicon-Based Polymer Science, American Chemical Society, 1989, pp. 3–46 Search PubMed.
- V. Bansal, A. Ahmad and M. Sastry, J. Am. Chem. Soc., 2006, 128, 14059–14066 CrossRef CAS.
- A. Rosenheim, B. Raibmann and G. Schendel, Z. Anorg. Allg. Chem., 1931, 196, 160 CrossRef CAS.
- C. L. Frye, J. Am. Chem. Soc., 1964, 86, 3170 CrossRef CAS.
- J. J. Glynn and F. P. Boer, J. Am. Chem. Soc., 1969, 91, 5756 CrossRef.
- D. W. Barnum, Inorg. Chem., 1970, 9, 1942 CrossRef CAS.
- A. Boudin, G. Cerveau, C. Chuit, R. J. P. Corriu and C. Reye, Angew. Chem., Int. Ed. Engl., 1986, 25, 473 CrossRef.
- M. L. Hoppe, R. M. Laine, J. Kampf, M. S. Gordon and L. W. Burggraf, Angew. Chem., Int. Ed. Engl., 1993, 32, 287–289 CrossRef.
- A. Boudin, G. Cerveau, C. Chuit, R. J. P. Corriu and C. Reye, Organometallics, 1988, 7, 1165–1171 CrossRef CAS.
- H. Cheng, R. Tamaki, R. M. Laine, F. Babonneau, Y. Chujo and D. R. Treadwell, J. Am. Chem. Soc., 2000, 122, 10063–10072 CrossRef CAS.
- C. R. Bickmore, M. L. Hoppe, R. M. Laine, K. A. Y. Blohowiak, P. Nardi, T. R. Robinson and J. Uhm, in Chemical Processing of Advanced Materials, ed. L. L. Hench and J. K. West, John Wiley and Sons, Inc., New York, NY, 1992, pp. 663–670 Search PubMed.
- L. Sun and K. Gong, Ind. Eng. Chem. Res., 2001, 40, 5861–5877 CrossRef CAS.
- Y. L. Chiew and K. Y. Cheong, Mater. Sci. Eng., B, 2011, 176, 951–964 CrossRef CAS.
- T. P. Ding, G. R. Ma, M. X. Shui, D. F. Wan and R. H. Li, Chem. Geol., 2005, 218, 41–50 CrossRef CAS.
- Y. Lucas, F. J. Luizao, J. Rouiller and D. Nahon, Science, 1993, 260, 521 CAS.
- P. Treguer, D. M. Nelson, A. J. Van Bennkom, D. J. DeMaster, A. Leynaert and B. Queguiner, Science, 1995, 268, 375 CAS.
- L. A. Derry, A. C. Kurtz, K. Ziegler and O. A. Chadwick, Nature, 2005, 433, 728 CrossRef CAS.
- S. Mann, Nature, 1993, 365, 499–505 CrossRef CAS.
- S. Oliver, A. Kuperman, N. Coombs, A. Lough and G. A. Ozin, Nature, 1995, 378, 47–50 CrossRef CAS.
- S. Mann and G. A. Ozin, Nature, 1996, 382, 313–318 CrossRef CAS.
- V. Chandrasekhar, S. Nagendran, Samiksha and G. T. S. Andavan, Tetrahedron Lett., 1998, 39, 8505–8508 CrossRef CAS.
- W. Wang, J. Martin, N. Zhang, C. Ma, A. Han and L. Sun, J. Nanopart. Res., 2011, 13, 6981–6990 CrossRef CAS.
- W. Wang, J. C. Martin, X. Fan, A. Han, Z. Luo and L. Sun, ACS Appl. Mater. Interfaces, 2011, 4, 977–981 Search PubMed.
- H. E. Gottlieb, V. Kotlyar and A. Nudelman, J. Org. Chem., 1997, 62, 7512–7515 CrossRef CAS.
- J. Song, L. Sun and K. Gong, High Technology Letters, 2000, 10, 104–106 CAS.
- J. Song, L. Sun, A. Liu and K. Gong, Mater. Res. Soc. Symp. Proc., 2001, 661, KK8.16/11–KK8.16/15 Search PubMed.
- J.-H. Song, A.-H. Liu, L. Sun and K.-C. Gong, Chinese Journal of Organic Chemistry, 2001, 21, 53–55 CAS.
Footnote |
| † Electronic supplementary information (ESI) available. See DOI: 10.1039/c2ra20986a |
| This journal is © The Royal Society of Chemistry 2012 |
