Enabling separation intensification of a lanthanide pair with closely similar kinetics based on droplet microfluidics: hydrodynamic and kinetic approaches
Hao
Zhang
 *ac,
Huizhi
Wang
*b,
Hong
Xu
d,
Li
Zhang
 d and
Jin
Xuan
 c
c
aSchool of Mechanical and Electrical Engineering, Jiangxi University of Science and Technology, Ganzhou, China. E-mail: haozhang@jxust.edu.cn
bDepartment of Mechanical Engineering, Imperial College London, Exhibition Road, South Kensington Campus, London, UK. E-mail: huizhi.wang@imperial.ac.uk
cDepartment of Chemical Engineering, Loughborough University, Loughborough, UK
dState Key Laboratory of Chemical Engineering, School of Mechanical and Power Engineering, East China University of Science and Technology, Shanghai, China
First published on 12th June 2019
Abstract
Microfluidics has been proved a promising way for highly efficient lanthanide extraction and separation benefiting from the astounding mass transfer characteristics. Efforts have been devoted by us previously to provide a clear understanding of the separation intensification mechanism of lanthanide pairs with distinguished extraction kinetics in microfluidics, such as Eu3+/La3+. However, for those lanthanide pairs with closely similar extraction kinetics, the working principles of separation intensification are different, which could not be explained by our former proposed theory of nonequilibrium separation intensification. In this study, a numerical model considering nonlinear extraction kinetics was presented to comprehend the separation characteristics of Eu3+/Sm3+, a lanthanide pair with very similar extraction kinetics, in microfluidics. The hydrodynamic and kinetic approaches, i.e. flow rate, initial concentration of metal ions and extractant, pH and temperature, were studied to manipulate separation performance. Analyses on dimensionless number (Damköhler number) were conducted to unveil the working mechanism of such approaches. The numerical study provides a mechanistic understanding of lanthanide separation in microfluidics and offers manipulating principles for further optimization.
1. Introduction
Lanthanides have drawn extensive attention for application for permanent magnets, catalysts, luminescent materials and energy materials due to their attractive physicochemical properties.1–4 Since the lanthanides are always mineral associated, separation and purification are vital metallurgy procedures for further processing and application of lanthanides. To date, solvent extraction is the most commonly used approach for lanthanide separation. Due to the resemblance of electronic configuration and close chemical similarity of lanthanides, it is arduous to accomplish their separation. A microfluidic-based extraction platform has been proved to hold a bright prospect for efficient extraction and separation.5–9 Compared with the mixer-settler, a widely applied conventional separation device, microfluidic extraction enables excellent mass transfer performance benefiting from the convex flow in the droplets.10–12 More attractively, intensified separation performance has been certified to be accomplished in a microfluidic extraction system.Despite the advantages of microfluidic extraction, the working mechanism of separation enhancement brought about by microfluidics is still veiled due to the complex interactions among mass transfer, microfluidic hydrodynamics, and extraction kinetics. The effects of hydrodynamic and kinetic factors (such as velocity and pH) on separation performance vary under different circumstances. According to the experimental study conducted by Jiang et al., the separation performance of Ce3+ and La3+ could be enhanced through reducing flow velocity.13 However, increasing the flow rate was found to play a positive role in enhancing the separation of cobalt and nickel.14 Uncertain impacts of pH on the separation factor were observed as well. High acidity was found to be preferable for separation of Pr3+ and Ce3+, whereas low acidity was suggested to be favorable for Nd3+/Pr3+ separation.15,16
Although all the lanthanides show similar chemical properties, the difference in extraction kinetics still exists.17 In our previous study, the working principles of nonequilibrium separation intensification in microfluidics were presented.18 Our proposed mechanism provides a clear explanation of the reason why separation performance of lanthanide pairs with distinguished extraction kinetics, such as Eu3+/La3+ with a mass transfer rate constant of 1.2 × 10⁻²/2.1 × 10−1 mm s−1, can be promoted through increasing the flow rate.17 In such a circumstance, since La3+ exhibits much faster extraction kinetics than Eu3+, much less residence time is needed for La3+ to obtain a relatively high extraction rate while keeping the extraction rate of Eu3+ low. Therefore, a high flow rate is favorable for separation of Eu3+/La3+ under nonequilibrium extraction conditions. However, the proposed theory is unable to clarify the separation intensification mechanism of lanthanide pairs with closely similar extraction kinetics The experiments on microfluidic separation of Ce3+/La3+ (with a mass transfer rate constant of 1.6 × 10⁻¹/2.1 × 10−1 mm s−1), Pr3+/Ce3+ (with a mass transfer rate constant of 9.0 × 10⁻²/1.6 × 10−1 mm s−1) and Nd3+/Pr3+ (with a mass transfer rate constant of 3.7 × 10⁻²/9.0 × 10−2 mm s−1) showed that increasing the flow rate would weaken the separation performance.13,15–17
In order to further unveil the mechanism of separation intensification in microfluidics and develop manipulating approaches for performance optimization, a 3D numerical model coupling nonlinear extraction kinetics, rather than linear kinetics in our previous model, with mass transfer and hydrodynamics on droplet-based microfluidic separation of Eu3+/Sm3+ is presented. The chosen lanthanide pair shows sluggish and closely similar extraction kinetics with a mass transfer rate constant of 1.2 × 10⁻²/1.5 × 10−2 mm s−1.17
Moreover, both Eu3+ and Sm3+ have bright application prospects in materials engineering. Europium is a crucial element for developing novel phosphorescent materials for display, screen and bio-probe applications,19 while samarium is a critical ingredient for permanent magnets.20 In this paper, the effects of hydrodynamic and kinetic factors, i.e. flow rate, initial concentration of metal ions and extractant, pH and temperature, on Eu3+/Sm3+ separation were analyzed to explore manipulating rules of microfluidic extraction. In order to offer more insightful information on separation, dimensionless analysis on the Damköhler number (Da) was applied to clarify the rate-determining step of the extraction process. The operation principle of separation optimization was developed based on Da analyses.
2. Numerical model
2.1 Physicochemical problem statement
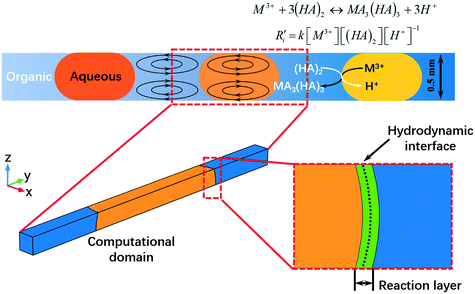
A numerical model was built to simulate the extraction separation processes of lanthanide pairs in a droplet flow. Eu3+/Sm3+ were chosen as the target lanthanide pair because they show similar extraction kinetics and thus can hardly be separated.17,21 A phosphorus reagent, 2-ethylhexylphosphonic acid mono-2-ethylhexyl ester, also known as P507 or PC-88A, diluted in sulfonated kerosene was chosen as the extractant. Droplet-flow geometry was built as the computational domain as shown in Fig. 1. The dimensions of the microchannel are 0.5 mm × 0.5 mm in width and height. The size of droplets is determined by multiple factors, such as flow rate, dimensions of the microchannel and viscosity of fluids. The flow patterns of the same liquid–liquid flow system in a rectangular channel were studied by Yin et al.22 It was found that the length of droplets decreases linearly with flow rate rising at the given geometry of the channel. Therefore, the lengths of droplets at various flow rates were kept the same as that of the experimental study.Due to the periodical distribution and centrosymmetry of the droplets, only a quarter of one droplet unit was modeled. A typical extraction process, trivalent actinide–lanthanide separation by phosphorus reagent extraction from aqueous komplexes (TALSPEAK), was modeled in this study. The geometry of the interfacial surface could be defined by the following equation set:23
 | (1) |
 | (2) |
 | (3) |
 | (4) |
2.2 Governing equations
| ∇·(ρu) = 0 | (5) |
| ∇·(ρuu) = −∇·p + ∇·τ | (6) |
During the extraction process, the mass transfer of metal ions and the lanthanide ligand complex is determined by conservation of species. Since the concentration of each species varies with time, the conservation equation was treated as time-dependent.
 | (7) |
![[D with combining macron]](https://www.rsc.org/images/entities/i_char_0044_0304.gif) denotes diffusivity (m2 s−1), and R′ is the generation or consumption rate of the species (mol m−3 s−1).
denotes diffusivity (m2 s−1), and R′ is the generation or consumption rate of the species (mol m−3 s−1).
| M3+ + 3(HA)2 ↔ MA3(HA)3 + 3H+ | (8) |
The maximum extraction ability can be evaluated by the distribution ratio at the extraction equilibrium condition:
 | (9) |
 | (10) |
K eq can be obtained from the change of enthalpy and entropy of the extraction reaction according to the van't Hoff expression:25,26
 | (11) |
 | (12) |
The equilibrium separation factor of Eu3+/Sm3+ is defined as follows
 | (13) |
It is found that the separation factor at equilibrium condition is affected only by temperature.
Although only one chemical equation (eqn (8)) is used to express the whole extraction reaction, the extraction reaction is complex and involves a series of reaction steps. The net extraction reaction kinetics can be expressed as follows.21
 | (14) |
The reaction rate constant can be calculated through the Arrhenius equation.
 | (15) |
The diffusivity of lanthanide ligand complexes is estimated by the Wilke–Chang equation.29,30
 | (16) |
The diffusivities of lanthanides are calculated by the following equation proposed by Gordon.31
 | (17) |
![[V with combining macron]](https://www.rsc.org/images/entities/i_char_0056_0304.gif) s is the partial molar volume of the solvent (cm3 mol−1), m is the molality of the solute (mol (kg solvent)−1), γ± is the mean ionic activity coefficient of the solute, and
s is the partial molar volume of the solvent (cm3 mol−1), m is the molality of the solute (mol (kg solvent)−1), γ± is the mean ionic activity coefficient of the solute, and ![[D with combining macron]](https://www.rsc.org/images/entities/i_char_0044_0304.gif) Ln0 is the diffusion coefficient at infinite dilution, which can be derived from the Nernst–Haskell equation,29
Ln0 is the diffusion coefficient at infinite dilution, which can be derived from the Nernst–Haskell equation,29 | (18) |
![[thin space (1/6-em)]](https://www.rsc.org/images/entities/char_2009.gif) 485 C mol−1), T is the absolute temperature (K), λ0+, λ0−, is the limiting conductance of ions (m2 s equiv−1), and n+, n− is the charge number of ions.
485 C mol−1), T is the absolute temperature (K), λ0+, λ0−, is the limiting conductance of ions (m2 s equiv−1), and n+, n− is the charge number of ions.
2.3 Boundary conditions
Boundary conditions were set to solve the hydrodynamic governing equations. The moving wall condition was applied.| uwall = u0 | (19) |
In order to satisfy the momentum continuity at the interfacial surface between two immiscible phases, the velocities of the surface were equalized.23
| uaqu = uorg | (20) |
Moreover, no momentum transfer has occurred through the interfacial surface in the direction perpendicular to the surface. Therefore, the perpendicular velocity at the surface was set equal to zero.
u·![[n with combining right harpoon above (vector)]](https://www.rsc.org/images/entities/char_006e_20d1.gif) = 0 = 0 | (21) |
Periodic conditions were set on both cross-sectional faces.
| u1 = u2 | (22) |
To solve the differential equation governing mass transfer, the initial concentration of each species was set in each phase.
| ci,t=0s = ci,0 | (23) |
In order to simulate the extraction reaction with more kinetic details, a thin extraction reaction layer rather than an equilibrium reaction surface was modeled at the interface of two immiscible phases. Two surfaces parallel to the interface extend to each phase forming a layer of 0.01 mm in thickness, as shown in Fig. 1. The extraction reaction is restricted within the layer to keep the surface reaction feature of the extraction process. The generation or consumption rate of each species was calculated by eqn (14). The mass transfer equation for the metal ions and protons was applied in the aqueous domain and reaction layer, while the mass conservation equation for the extractant and lanthanide ligand complex was applied in the organic domain and reaction layer. Periodic concentration conditions were set on both cross-sectional surfaces. No species flux condition was applied on the walls. In modeling, the hydrodynamic field was numerically solved in advance and served as an input for mass transfer calculation.
2.4 Numerical solution
COMSOL Multiphysics was utilized to build and solve the coupled model. The computational geometry was discretized with tetrahedral meshes. A grid independence check has been conducted to ensure the numerical accuracy. The total number of meshes is about 760![[thin space (1/6-em)]](https://www.rsc.org/images/entities/char_2009.gif) 000 with an average mesh size of 4 × 10⁻⁷ mm3. A direct solution procedure with Multifrontal Massively Parallel Solver (MUMPS) was used to accomplish the numerical calculation. The key input parameters of the model are listed in Table 1.
000 with an average mesh size of 4 × 10⁻⁷ mm3. A direct solution procedure with Multifrontal Massively Parallel Solver (MUMPS) was used to accomplish the numerical calculation. The key input parameters of the model are listed in Table 1.
| Parameters | Unit | Value | ref. |
|---|---|---|---|
| α | Degree | 160 | 22 |
| μ aqu | mPa s | 1.2 | 22 |
| μ org | mPa s | 2.6 | 22 |
| ρ aqu | kg m−3 | 1040 | 22 |
| ρ org | kg m−3 | 850 | 22 |
| A Eu | s−1 | 0.02 | 21 |
| A Sm | s−1 | 3.918 | 21 |
| E Eu | kJ mol−1 | 13.4 | 21 |
| E Sm | kJ mol−1 | 26.8 | 21 |
| k Eu,298K | s−1 | 9.09 × 10⁻⁵ | 21 |
| k Sm,298K | s−1 | 7.32 × 10⁻⁵ | 21 |
| D NaOH | m2 s−1 | 2 × 10⁻⁹ | Calculated |
| D TA | m2 s−1 | 3.2 × 10⁻⁹ | Calculated |
| D Eu | m2 s−1 | 1.91 × 10⁻⁹ | Calculated |
| D Sm | m2 s−1 | 1.92 × 10⁻⁹ | Calculated |
| D HCl | m2 s−1 | 3.3 × 10⁻⁹ | Calculated |
| D (HA)2 | m2 s−1 | 3.96 × 10⁻⁹ | Calculated |
| D SmA3(HA)3 | m2 s−1 | 3.96 × 10⁻⁹ | Calculated |
| D EuA3(HA)3 | m2 s−1 | 3.96 × 10⁻⁹ | Calculated |
| k forward,Sm | s−1 | 1.59 | Fitted |
| K backward,Sm | s−1 | 0.265 | Fitted |
| k forward,Eu | s−1 | 1.05 | Fitted |
| k forward,Eu | s−1 | 0.15 | Fitted |
3. Results and discussion
3.1 Model validation
The extraction process of metal ions between two immiscible phases in a droplet flow occurs step by step in sequence, i.e. ion transfer in aqueous solution, interfacial extraction reaction, ligand complex transfer in organic solution. The mass transfer within each phase is determined by the hydrodynamic characteristics of the droplet, while the interfacial extraction is determined by extraction reaction kinetics. Due to the lack of experimental data for the microfluidic separation of Eu3+/Sm3+ in P507, in order to validate the presented model, both interfacial extraction and droplet hydrodynamic characteristics need to be verified. Since the extraction kinetics of Eu3+ and Sm3+ has been well established by Chen et al., it is crucial to validate the hydrodynamic characteristics within the droplets.21 Because the neutralization reaction is regarded as instantaneous, the overall mass transfer is independent of reaction kinetics and is only related to the mass transfer within each phase.32 As a result, the mass transfer characteristics of the neutralization reaction can be used to validate the hydrodynamic characteristics of droplets.A validation model on the microfluidic extraction process based on the neutralization reaction was built governed by eqn (1)–(7). The geometric dimensions of the droplet and microchannel as well as the neutralization reaction of sodium hydroxide and trichloroacetic acid (TA) in the validation model were kept the same as that of the experiments conducted by Dessimoz et al.32
| CCl3COOHorg + NaOHaqu → CCl3COONaaqu + H2O | (24) |
The reaction kinetics of the neutralization reaction can be expressed by the first-order reaction kinetics as follows.
| r = kcOH− | (25) |
It has been proved that the neutralization reaction can be completed in 0.5 ps, and the corresponding reaction rate constant is evaluated as 1012 s−1 through the following equation.33
 | (26) |
The diffusion coefficients of trichloroacetic acid and sodium hydroxide in eqn (7) were calculated by eqn (16) and (17), respectively, and are shown in Table 1.
The global mass transfer coefficient Kg was chosen as the index of mass transfer performance across the interface, which is defined as follows.32
 | (27) |
The numerical results of the global mass transfer coefficient at different flow rates are compared with experimental data as shown in Fig. 2a. From the figure, the good agreement between modeling and data indicates that the proposed model provides valid mass transfer characteristics within droplets. The following analyses were based on the extraction kinetics of Eu3+ and Sm3+.
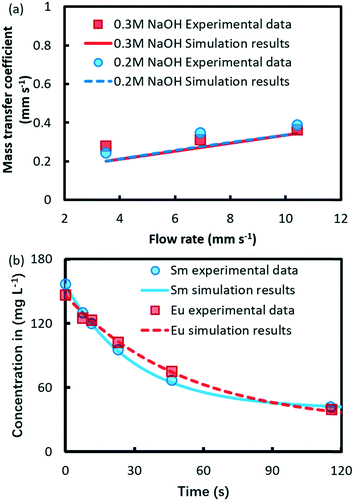 | ||
| Fig. 2 Comparison between experimental and numerical results of (a) mass transfer coefficient in the droplet-based microfluidic extraction and (b) ion concentrations in the aqueous phase. | ||
In order to further validate the present model, the microfluidic extraction process of Eu3+ and Sm3+ in di-(2-ethylhexyl) phosphoric acid (also known as HDEHP or P204) was simulated. The dimensions of the droplet and microchannel as well as the extraction conditions were the same as those of the experiments.17 In this circumstance, first-order reaction kinetics was considered because of the excess extractant.17,18
 | (28) |
The numerical results and experimental concentration of Eu3+ and Sm3+ in the aqueous phase are compared in Fig. 2b, which shows a good agreement.
3.2 Hydrodynamic effect on separation performance
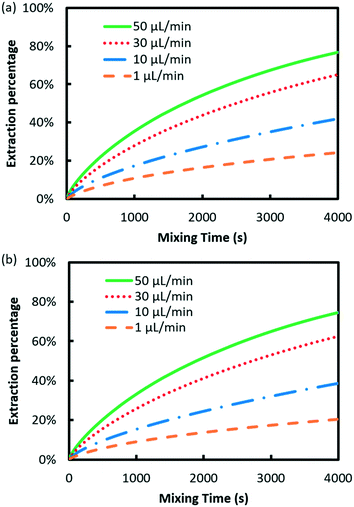
Fig. 3 shows the effect of flow rate on the extraction performance. The results indicate that the extraction process was accelerated for both elements with the flow rate increasing. The velocity and concentration distribution within the droplet are given in Fig. 4. As shown in the figure, convex flow is generated in each phase induced by the shear stress at the wall and interface of phases. The convex intensity is enhanced with flow rate, which promotes the mass transport in both phases. Moreover, extraction can be benefited by the shortening of the mass transport path, since the length of the droplet declines with flow rate.22Herein, the Damköhler number (Da) was used to analyze the mass transfer process, which is defined as the ratio of the extraction reaction rate to the rate of reactant transport to the interface:18
 | (29) |
For Da >1, the reaction rate is faster than that of reactant transport to the interface. Therefore, the overall rate of extraction is limited by the mass transfer rate, which makes the inner-phase mass transport process the rate-determining step. In contrast, Da <1 indicates that the reaction kinetics determine the overall reaction rate. The profiles of Da against flow rate are shown in Fig. 5.
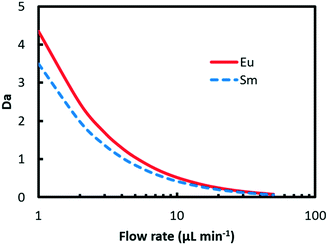 | ||
| Fig. 5 Da values of Eu3+ and Sm3+ against flow rate. The initial concentration of (HA)2 and metal ions is 1.5 M and 20 mM, respectively; the initial pH is 3.0, and the temperature is 298 K. | ||
It is found that two Da curves converge and both Da values decline from larger than 3 to less than 1 with flow rate rising from 1 μL min−1 to 50 μL min−1, which means that the transition of the rate-determining step from the inner-phase mass transport process to reaction kinetics occurs. At a low flow rate, the inner-phase mass transfer rate is low, which corresponds to a large Da value. Therefore, the rate-determining step is the inner-phase mass transfer. With the flow rate increasing, the convection mass transfer is accelerated by vortexing as shown in Fig. 4. The rate of ion transport to the interface gradually increases and exceeds the rate of reaction. In this circumstance, the extraction process is determined by interface mass transfer.
Separation factor was used to evaluate the separation performance of the Eu3+/Sm3+ pair.
 | (30) |
 | (31) |
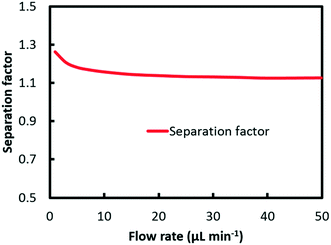
In order to evaluate the separation performance of microfluidic extraction in practice, a fixed length of mixing microchannel is given as 1000 mm under various flow rates.
According to our previous study, intensified separation performance can be achieved through increasing the flow rate for lanthanide pairs (like Eu3+/La3+) with distinguished extraction kinetics.18 In the case of Eu3+/La3+ separation, La3+ exhibits much faster extraction kinetics compared to Eu3+. Therefore, separation enhancement can be achieved under nonequilibrium extraction conditions by manipulating the residence time of ions in the microchannel.
Different from the separation of Eu3+/La3+, the extraction kinetics of Eu3+ and Sm3+ are both sluggish and closely similar. As a result, neither Eu3+ nor Sm3+ can achieve a relatively higher extraction percentage. Fig. 6 shows the effect of flow rate on the separation factor of Eu3+/Sm3+. It is found that the separation performance of Eu3+/Sm3+ drops slightly when the flow rate rises, which is different from our previous study on Eu3+/La3+ separation. The extraction rate of the extraction process can be expressed as follows.
 | (32) |
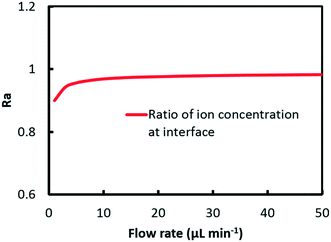
The Ra ratio is defined as the ratio of the concentration of Eu3+ at the interface to that of Sm3+.
 | (33) |
Fig. 7 shows a plot of the curve of Ra against flow rate. It can be found from the results that the ratio climbs from 0.9 at 1 μl min−1 to 0.98 at 50 μl min−1. At low flow rate, convection mass transfer within each phase is hindered corresponding to a high Da value as shown in Fig. 5. Due to the relatively quick extraction kinetics, it is easier for Eu3+ rather than Sm3+ to transfer across the interface into the organic solution, which leads to a smaller value of ratio at the interface, and thus better separation performance. With the flow rate increasing, the convection mass transfer is accelerated to replenish ions at the interface. The rate of ion transport to the interface gradually exceeds the rate of maximum reaction, corresponding to a low Da value. As a result, the ratio at the interface grows close to 1, which means a worse separation factor was achieved with the same initial concentration of Eu3+ and Sm3+.
Furthermore, the divergence of Da values in Fig. 5 represents the difference of extraction reaction rate of the two elements according to eqn (29). The greater the divergence is, the better separation can be achieved. With flow rate rising, the two Da curves converged, which indicates closer reaction rates for Eu3+ and Sm3+. Given the same hydrodynamic condition for both elements, closer reaction rates lead to worse separation performance.
3.3 Kinetic effects on separation performance
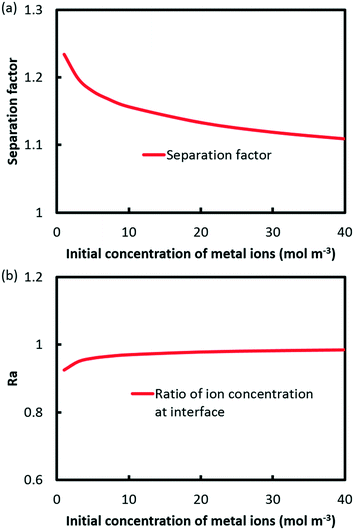
According to eqn (14), the extraction kinetics could be affected by four factors, i.e. the reaction rate constant, the concentration of metal ions, (HA)2 and pH. The operating flow rate is kept as 25 μl min−1, in which circumstance the extraction reactions for Eu3+ and Sm3+ have not attained equilibrium.The relation between the separation factor and the initial concentration of metal ions is shown in Fig. 8a. The results indicate that the separation performance slides from 1.23 to 1.11 with the concentration of metal ions increasing from 1 to 40 mM. It is a fact that extraction reactions shall be accelerated through improving the concentration of ions according to eqn (14). However, the Ra value grows gradually to 0.98 at 40 mM as shown in Fig. 8b, which indicates that separation is hardly achieved.
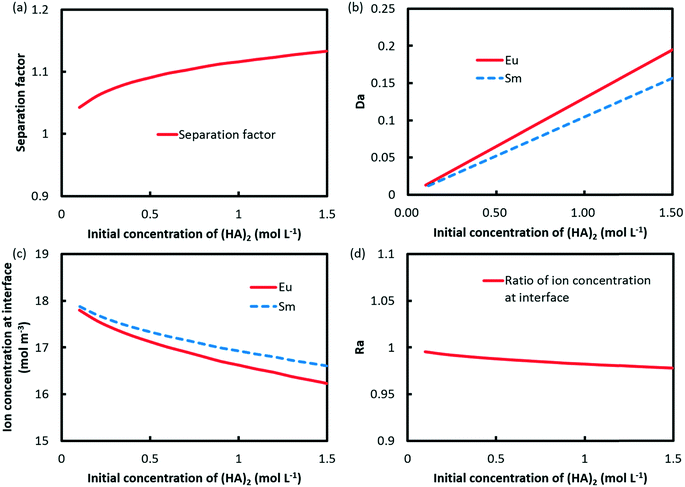
In contrast, separation intensification of Eu3+/Sm3+ can be achieved through increasing the initial concentration of (HA)2, as indicated in Fig. 9a. Da values for both elements were found to be increased as well, as shown in Fig. 9b. However, the difference between the two Da values increases with the initial concentration of (HA)2. The concentrations of Eu3+ and Sm3+ at the interface and Ra are shown in Fig. 9c and d. It is found that Ra reduces with the initial concentration of (HA)2, which leads to a better separation.
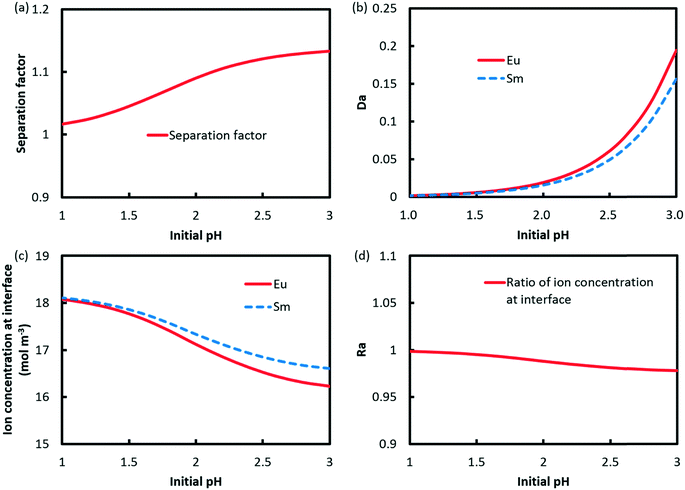
The effect of pH on the separation factor of Eu3+/Sm3+ was investigated, as shown in Fig. 10a. Low acidity is preferred to accomplish the extraction reaction, which results in a sharp increase in Da values for both Eu3+ and Sm3+. It should be noted that the difference between the two Da values rises with pH as illustrated in Fig. 10b. Fig. 10c and d show the profiles of ion concentrations at the interface and Ra against pH. The results indicate that Ra drops when pH increases from 1 to 3.
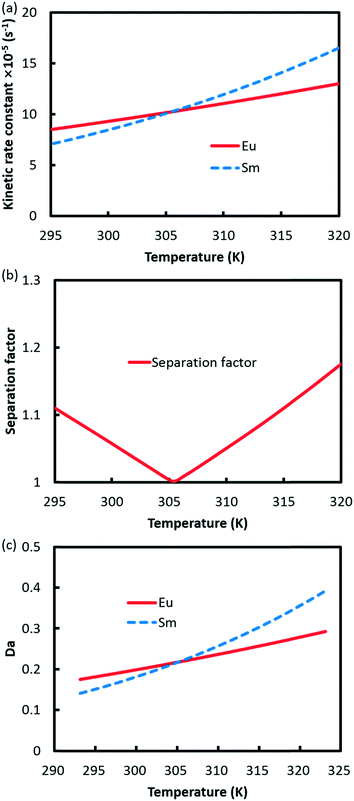
Since the extraction reaction rate constant k is temperature dependent according to eqn (15), both kinetic rate constants are accelerated with temperature, as shown in Fig. 11a. However, the rising slope of Eu3+ is lower than that of Sm3+ because the activation energy of Sm3+ extraction is larger than that of Eu3+. At lower temperature, Eu3+ experiences faster extraction kinetics than Sm3+, and separation of Eu3+ from Sm3+ is achieved, as shown in Fig. 11b. Nevertheless, the reaction rate constant of Sm3+ catches up with Eu3+ at 305.5 K and exceeds it with further rising of temperature, in which occasion Sm3+ is separated from Eu3+. Therefore, the separation factor of Eu3+/Sm3+ drops to 1 at 305.5 K and increases again. The relationship between the Da value and the temperature is shown in Fig. 11c. Da values for both elements are increased through increasing the temperature. However, the Da curves intersect at 305.5 K and then diverge at a higher temperature.
It is notable that besides the reaction kinetics, the thermodynamic equilibrium of extraction reaction will be affected by [(HA)2], [H+] and temperature, as discussed in section 2.2.2. According to eqn (10)–(12), the extraction equilibrium evolves forward by increasing [(HA)2] and [H+], but shifts backward with temperature increasing. However, the separation factor of Eu3+/Sm3+ at equilibrium is only affected by temperature as shown in eqn (13).
The effect of temperature on β depends on the change of enthalpy, which varies in different extraction systems. Due to the lack of data of ΔH and ΔS for the extraction of Eu3+ and Sm3+ in P507, the temperature effect on β is estimated using the data in bis(2-ethylhexyl) phosphoric acid (P204 or HDEHP), another phosphorus reagent with a similar molecular structure to P507.25 The derived expression is as follows.
In this circumstance, the equilibrium separation factor drops with temperature increase.
In fact, there is no need for extraction reactions to establish the equilibrium to perform the separation, especially for elements with sluggish reaction kinetics. On the one hand, it takes too long to attain equilibrium. On the other hand, by taking advantage of the difference of mass transfer rate and reaction kinetics between Eu3+ and Sm3+, separation intensification can be achieved before the attainment of reaction equilibrium, as discussed in sections 3.2 and 3.3.
4. Conclusion
In this study, a numerical model was built to implement the theoretical understanding on the mechanism of separation intensification in droplet-based microfluidics. Two kinds of lanthanide ions with closely similar extraction kinetics, i.e., Eu3+ and Sm3+, were chosen as the objective separation pair. A decrease in flow rate was found to be preferable for separation. The rate-determining step of both extraction processes was found to be converted from inner-phase mass transfer to interface mass transfer as the flow rate increases. Concentrated metal ions would result in a decline of separation. On the contrary, enhanced separation performance was achieved through concentrating the extractant and improving the initial pH. The fall–rise effect of temperature on separation was demonstrated. The Da value was found to be an effective target dimensionless parameter for separation optimization. Enhanced separation performance can be achieved under conditions with a higher divergence between Da values.Nomenclature
| a | Specific interfacial area (m−1) |
| A | Pre-exponential factor (s−1) |
| Ar | Area of the interface (m2) |
| c | Concentration of species (mol L−3) |
| d | Diameter of microchannel (m) |
| D | Distribution ratio |
![[D with combining macron]](https://www.rsc.org/images/entities/i_char_0044_0304.gif)
| Diffusivity (m2 s−1) |
| E | Activation energy (kJ mol−1) |
| F | Faraday's constant (C mol−1) |
| k | Reaction rate constant (s−1) |
| k m | Total mass transfer rate (s−1) |
| K g | Global mass transfer coefficient (m s−1) |
| K eq | Equilibrium constant |
| L s | Length of slug (m) |
| M | Molecular weight of solvent |
| m | Molality of the solute (mol (kg solvent)−1) |
| n | Charge number of ions |
| p | Pressure (Pa) |
| r | Radius of the droplet contact surface (m) |
| R' | Generation or consumption rate of species (mol m−3 s−1) |
| R | Gas constant (J mol−1 K−1) |
| Ra | Ratio of the ion concentration at the interface |
| T | Temperature (K) |
| t | Reaction time (s) |
| t 1/2 | Time constant of reactant (s) |
| u | Velocity (m s−1) |
| V | Volume (m3) |
| V 0 | Molar volume of the solute (cm3 mol−1) |
![[V with combining macron]](https://www.rsc.org/images/entities/i_char_0056_0304.gif) s
s
| Partial molar volume of the solvent (cm3 mol−1) |
Greek characters
| α | Contact angle (degree) |
| β | Separation factor |
| ρ | Density (kg m−3) |
| ρ M | Molar density (mol cm−3) |
| τ | The viscosity stress tensor (Pa) |
| φ | Association factor of solvent |
| η s | Viscosity of the solvent (mPa s) |
| η | Viscosity of the solution (mPa s) |
| γ | Mean ionic activity coefficient of the solute |
| λ | Limiting conductance of ions (m2 s equiv−1) |
Subscripts
| i | Species |
| aqu | Aqueous |
| org | Organic |
| Ln | Lanthanide |
| eq | Equilibrium |
Conflicts of interest
There are no conflicts to declare.Acknowledgement
The research work presented in this paper is supported by the Natural Science Foundation of Jiangxi Province, China (20181BAB216016, 20171BAB216023).References
- K. Binnemans, Chem. Rev., 2009, 109, 4283–4374 CrossRef CAS PubMed.
- F. T. Edelmann, Chem. Soc. Rev., 2012, 41, 7657–7672 RSC.
- S. Sugimoto, J. Phys. D: Appl. Phys., 2011, 44, 064001 CrossRef.
- H.-Q. Wang, M. Batentschuk, A. Osvet, L. Pinna and C. J. Brabec, Adv. Mater., 2011, 23, 2675–2680 CrossRef CAS PubMed.
- Z. Chen, W.-T. Wang, F.-N. Sang, J.-H. Xu, G.-S. Luo and Y.-D. Wang, Sep. Purif. Technol., 2017, 174, 352–361 CrossRef CAS.
- D. Ciceri, J. M. Perera and G. W. Stevens, J. Chem. Technol. Biotechnol., 2014, 89, 771–786 CrossRef CAS.
- U. Novak, M. Lakner, I. Plazl and P. Žnidaršič-Plazl, Microfluid. Nanofluid., 2015, 19, 75–83 CrossRef CAS.
- E. Kolar, R. P. R. Catthoor, F. H. Kriel, R. Sedev, S. Middlemas, E. Klier, G. Hatch and C. Priest, Chem. Eng. Sci., 2016, 148, 212–218 CrossRef CAS.
- Y. He, S. Guo, M. I. Khan, K. Chen, S. Li, L. Zhang and S. Yin, ACS Sustainable Chem. Eng., 2019, 7, 1616–1621 CrossRef CAS.
- C. Yao, Y. Liu, S. Zhao, Z. Dong and G. Chen, AIChE J., 2017, 63, 1727–1739 CrossRef CAS.
- J. H. Xu, J. Tan, S. W. Li and G. S. Luo, Chem. Eng. J., 2008, 141, 242–249 CrossRef CAS.
- A. Sahu, A. B. Vir, L. N. S. Molleti, S. Ramji and S. Pushpavanam, Chem. Eng. Process., 2016, 104, 190–200 CrossRef CAS.
- F. Jiang, S. Yin, C. Srinivasakannan, S. Li and J. Peng, Chem. Eng. J., 2018, 334, 2208–2214 CrossRef CAS.
- L.-H. Zhang, J.-H. Peng, S.-H. Ju, L.-B. Zhang, L.-Q. Dai and N.-S. Liu, RSC Adv., 2014, 4, 16081–16086 RSC.
- S. Yin, K. Chen, C. Srinivasakannan, S. Li, J. Zhou, J. Peng and L. Zhang, Hydrometallurgy, 2018, 175, 266–272 CrossRef CAS.
- Y. He, K. Chen, C. Srinivasakannan, S. Li, S. Yin, J. Peng, S. Guo and L. Zhang, Chem. Eng. J., 2018, 354, 1068–1074 CrossRef CAS.
- K. P. Nichols, R. R. Pompano, L. Li, A. V. Gelis and R. F. Ismagilov, J. Am. Chem. Soc., 2011, 133, 15721–15729 CrossRef CAS PubMed.
- H. Zhang, H. Wang, X. Luo, D. Y. C. Leung, Q. Pang, H. Xu, L. Zhang and J. Xuan, Chem. Eng. J., 2019, 356, 673–679 CrossRef CAS.
- H. Terraschke and C. Wickleder, Chem. Rev., 2015, 115, 11352–11378 CrossRef CAS PubMed.
- M. Duerrschnabel, M. Yi, K. Uestuener, M. Liesegang, M. Katter, H. J. Kleebe, B. Xu, O. Gutfleisch and L. Molina-Luna, Nat. Commun., 2017, 8, 54 CrossRef CAS PubMed.
- Z. Chen and Y. Wang, Chin. J. Chem. Eng., 2018, 26, 317–321 CrossRef.
- S. Yin, J. Pei, J. Peng, L. Zhang and C. Srinivasakannan, Hydrometallurgy, 2018, 175, 64–69 CrossRef CAS.
- M. Lubej, U. Novak, M. Liu, M. Martelanc, M. Franko and I. Plazl, Lab Chip, 2015, 15, 2233–2239 RSC.
- N. Harries, J. R. Burns, D. A. Barrow and C. Ramshaw, Int. J. Heat Mass Transfer, 2003, 46, 3313–3322 CrossRef CAS.
- P. R. Zalupski and K. L. Nash, Solvent Extr. Ion Exch., 2008, 26, 514–533 CrossRef CAS.
- Y. Xiong, X. Wang and D. Li, Sep. Sci. Technol., 2005, 40, 2325–2336 CrossRef CAS.
- O. Exner, in Progress in Physical Organic Chemistry, ed. A. Streitwieser Jr. and R. W. Taft, 1973, pp. 411–482 Search PubMed.
- J. R. Hulett, Q. Rev., Chem. Soc., 1964, 18, 227–242 RSC.
- R. H. Perry, D. W. Green and J. O. Maloney, Perry's chemical engineers' handbook, McGraw-Hill, New York, 7th edn, 1997 Search PubMed.
- C.-L. Wong, A. N. Soriano and M.-H. Li, J. Taiwan Inst. Chem. Eng., 2009, 40, 77–83 CrossRef CAS.
- R. C. Robert , J. M. Prausnitz and B. E. Poling, The properties of gases and liquids, McGraw-Hill, New York, 4th edn, 1987 Search PubMed.
- A.-L. Dessimoz, L. Cavin, A. Renken and L. Kiwi-Minsker, Chem. Eng. Sci., 2008, 63, 4035–4044 CrossRef CAS.
- A. Hassanali, M. K. Prakash, H. Eshet and M. Parrinello, Proc. Natl. Acad. Sci. U. S. A., 2011, 108, 20410 CrossRef CAS PubMed.
| This journal is © The Royal Society of Chemistry 2019 |

