Fluorination of neodymium carbonate monohydrate with anhydrous hydrogen fluoride in a Carberry spinning-basket reactor
Received
26th June 2018
, Accepted 19th December 2018
First published on 9th January 2019
Abstract
Neodymium trifluoride is used in the production of neodymium–iron–boron magnets and can be produced by the direct fluorination of neodymium carbonate monohydrate, Nd2(CO3)3·H2O, using anhydrous hydrogen fluoride, AHF. This reaction was studied in a Carberry spinning-basket reactor in order to minimise the effects of external mass transfer on the reaction kinetics, in the temperature range 100 °C to 250 °C, and at AHF concentrations up to 10 mass%. Since the monohydrate undergoes thermal decomposition, simultaneous competing reactions may take place during fluorination. There is strong evidence for the formation of partially fluorinated intermediate products. The kinetics adheres to a reaction-rate controlled, shrinking-core, heterogeneous reaction model, applicable to the individual particles comprising the pressed Nd2(CO3)3·H2O pellets used for the work. The rate is independent of temperature, and directly proportional to the AHF concentration. At 10 mass% AHF, the reaction time is 26 ± 3 min. The low operational temperature has significant techno-economic implications, lowering operating cost and costs associated with materials of construction.
Introduction
The rare-earths are a group of seventeen chemically similar elements that comprise the lanthanides, scandium and yttrium.1 Neodymium is a rare earth element used in the manufacture of neodymium–iron–boron magnets, widely employed in consumer electronics such as high-end speakers and hard drives, as well as wind turbines and electric motors.2 There is great economic incentive to beneficiate available mineral resources. Neodymium trifluoride (NdF3), in particular, has a significant commercial value due to its use as precursor in the production of neodymium metal.
Development of a dry process, i.e., using either anhydrous hydrogen fluoride (AHF) or fluorine gas, to produce neodymium fluoride from a suitable neodymium substrate is a vital step in the beneficiation of neodymium in an environmentally friendly way. Traditional wet methods are known to produce large quantities of waste, formed when aqueous neodymium chloride reacts with hydrofluoric acid. This acid waste, a hydrochloric/hydrofluoric acid mixture, is extremely hazardous and difficult to treat.2,3
Reaction kinetics is of critical importance for optimisation of commercial production processes, particularly the reaction kinetics where the effects of external mass transfer have been minimised. Neodymium fluoride production is largely conducted in commercial production facilities in China, therefore reliable kinetic data are hard to find.2 Limited kinetic data for the fluorination of Nd2O3 have been published, but none for Nd2(CO3)3·8H2O or Nd2(CO3)3·H2O.4
Due to the rate-limiting mass- and heat-transfer effects associated with standard thermogravimetric (TG) analysis of solid–gas reactions, the fluorination process was studied in a Carberry spinning-basket reactor (CSBR) where the effects of external transfer phenomena can be minimised and intrinsic reaction kinetics may be determined. These reactors were developed in the 1960s by Carberry to facilitate laboratory-scale testing of catalyst particles in continuously stirred reactors.5 They offer excellent isothermal and external mass transfer conditions as long as a sufficient stirrer rotation rate is maintained, and their use is recommended to overcome the thermal/mass transfer limitations of more conventional heterogeneous reactors such as packed beds. Experimental results have consistently demonstrated the elimination of the effects of external mass transfer during gas–solid catalytic reaction experiments.6,7 CSBRs are commonly used to determine/confirm diffusion coefficients for petrochemical reactions8,9 where the elimination of external mass transfer effects is essential. For this reason CSBRs have been extensively used to investigate laboratory-scale catalytic decomposition reactions.10–12
The aim of this research was to generate kinetic data for the gaseous fluorination of Nd2(CO3)3·H2O, the preferred precursor, using anhydrous hydrogen fluoride (AHF) in a CSBR.
Experimental
Materials
Neodymium carbonate octahydrate was obtained from Richest Group Ltd. and AHF from Pelchem SOC Ltd. This octahydrate was dehydrated to neodymium carbonate monohydrate and pelletised for use in the CSBR. Each pellet had an average diameter and thickness of 4.0 mm and 1.8 mm respectively. The pellets were heated to 150 °C for 48 h before experimentation, to ensure a homogeneous starting material.
CSBR laboratory setup
AHF is an extremely dangerous substance. Consequently, extensive safety precautions were taken to prevent damage to equipment and, more importantly, personnel. A custom AHF-safe laboratory was constructed for the purposes of this investigation in a building licensed to work with AHF. The building is equipped with suitable scrubbing systems and fume hoods to house the experimental setup. Specialised severe-service valves and fittings were used along with stainless steel (SS316L) tubing to mitigate corrosion risk. All lines containing gaseous AHF were heated to prevent unanticipated condensation.
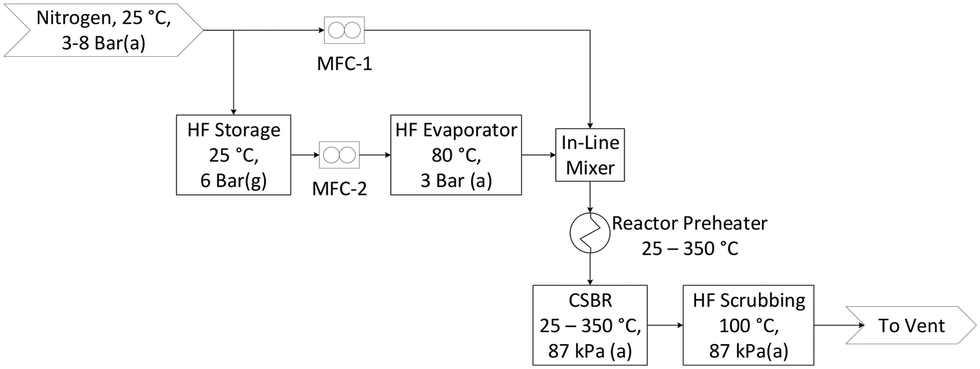
The flow diagram for the laboratory setup is shown in Fig. 1. Pressurised AHF is mixed with nitrogen in specific mass ratios before preheating, and then reacted in the CSBR. Nitrogen and AHF mass flow rates are controlled with thermal- and Coriolis flow controllers respectively. AHF and N2 are mixed with a special in-line mixer to overcome the gas-phase mixing difficulty associated with AHF. The exit gas is vented through an aluminium oxide scrubber to absorb unreacted AHF. Once scrubbed, the gas passes through the fume hood into the building ventilation where it is scrubbed once again before being vented to atmosphere.
 |
| | Fig. 1 Process flow diagram. | |
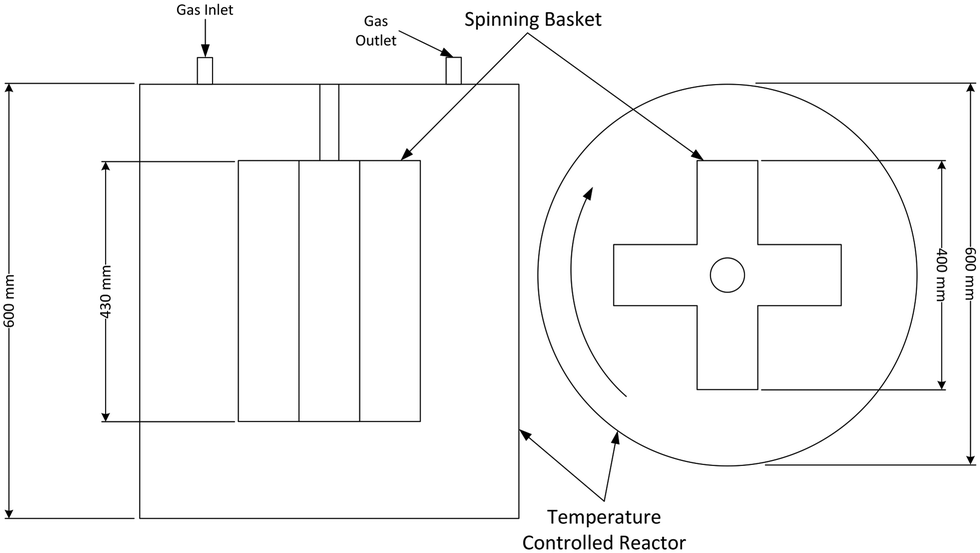
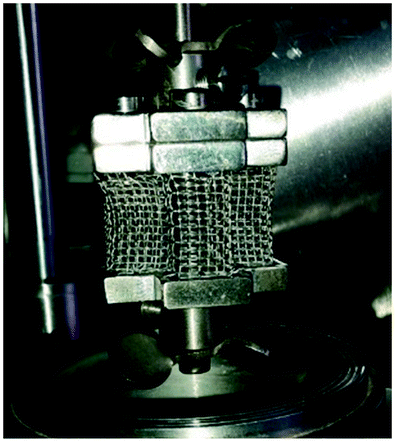
The CSBR used to study the fluorination of neodymium carbonate reaction was acquired from AMAR Autoclaves. The spinning basket used in the reactor chamber is illustrated in Fig. 2. The method by which the use of spinning baskets in reactors reduce the effects of external mass transfer is explained and endorsed in various chemical engineering texts.13–15 A photo of the CSBR used for the experiments is shown in Fig. 3.
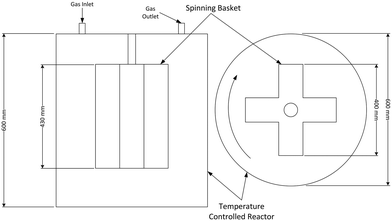 |
| | Fig. 2 Side (left) and top (view) of the CSBR used for experimentation. Drawings are not to scale. | |
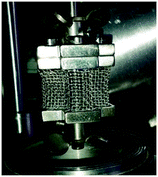 |
| | Fig. 3 Photograph of the Inconel CSBR used for the fluorination experiments. | |
Methods
Fluorination.
The danger associated with working with AHF necessitated strict adherence to a carefully-scrutinised standard operating procedure for all experimental work. The fluorination method is briefly described here. A 3.5 g sample of Nd2(CO3)3·H2O pellets is placed in the spinning basket and loaded into the reactor. The reactor is sealed, heating of the reactor and preheater are initiated, and sufficient time for thermal equilibration is allowed. The spinning basket rotational speed is set to 1200 rpm (a value for which external heat and mass transfer resistances become undetectable) to allow for ideal mixing, and elimination of the effects of external mass transfer. AHF and N2 flows in the desired ratio are initiated, and allowed to bypass the reactor and to reach mass-transfer equilibrium. The reactor inlet valve is opened after equilibration and a timed reaction is allowed to take place. Once the desired time has elapsed, the reaction is stopped and the reactor purged using nitrogen gas at 150 °C to remove adsorbed HF. The sample is then removed, weighed and analysed.
Nd2(CO3)3·H2O was chosen for starting material for fluorination to ensure chemical uniformity of reagents as Nd2(CO3)3·8H2O starts dehydrating/decomposing at 50 °C. All samples used for fluorination were heated to 150 °C to ensure a uniform chemical composition of Nd2(CO3)3·H2O.
Analysis.
The amount of Nd in each sample is measured by dissolving a sample of the crushed, mixed and homogenised reaction product in HClO4. To the dried sample is added HClO4 once more before dilution in demineralised water. The digested sample is then analysed by inductively-coupled plasma-optical emission spectrometer (ICP-OES).
The amount of elemental fluorine in each sample is measured by dissolving a sample of homogenised product in HClO4 at 135 °C in the presence of KMnO4 and pumice stones (SiO2). F− is then distilled off in the form of HF and SiF4 which is captured in a NaOH solution to form Na2SiF6. The F− content in Na2SiF6 is measured with a F-ion selective electrode (ISE) calibrated with an appropriated standard.
The accuracy of the analytical techniques used are both between 2 and 5%.
Analytical instruments.
Thermogravimetric analysis was done on a TA Instruments SDT Q600 for inert measurements and a Perkin Elmer TGS-2 modified for use with corrosive gases when working with AHF. SEM/EDX results were obtained using a Hitachi TM3030Plus/SwiftED3000 table-top microscope. BET and MIP measurements were made using a Micromeritics Tristar 3000 and a Micromeritics AutoPore IV 9500 respectively. The ICP-OES & ISF make & model used were Spectro Arcos and an Orion fluoride selective electrode on an Orion Model 710A meter respectively.
Results and discussion
Preliminary thermogravimetric experiments
Thermal decomposition in an inert atmosphere.
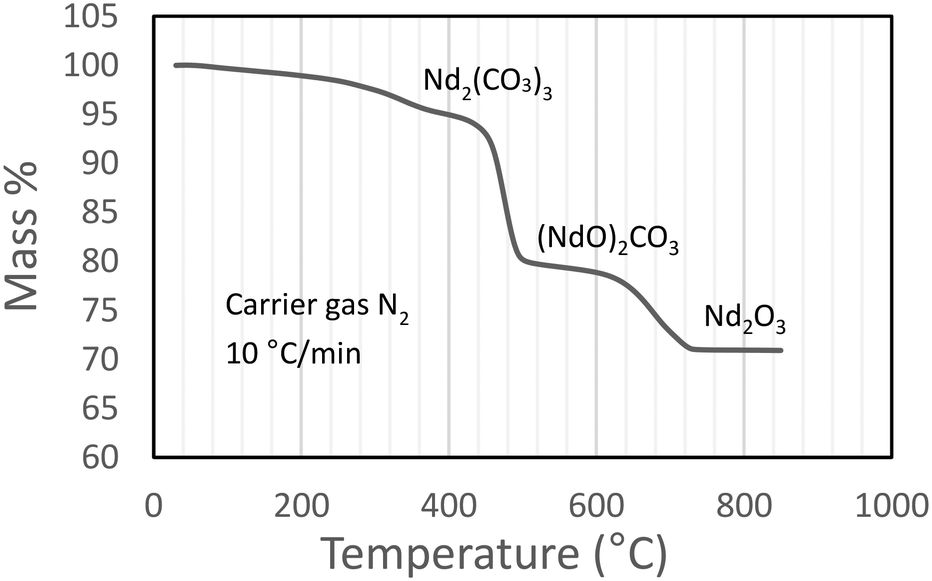
A thermogram for Nd2(CO3)3·H2O heated in an inert N2 atmosphere is shown in Fig. 4. The results correspond adequately to the results of other published work (a reproduction the thermogram published by Hinode and co-workers16 is shown in Fig. 6, for the octahydrate). The plateaus corresponding to the various decomposition products are less pronounced in our case; and the transition temperature higher; this may be attributed to our much faster heating rate. It should be noted that high-heating rates may mask the presence of intermediate phases making the unambiguous identification of phases difficult.17
 |
| | Fig. 4 Dynamic thermogram of Nd2(CO3)3·H2O in an inert atmosphere. | |
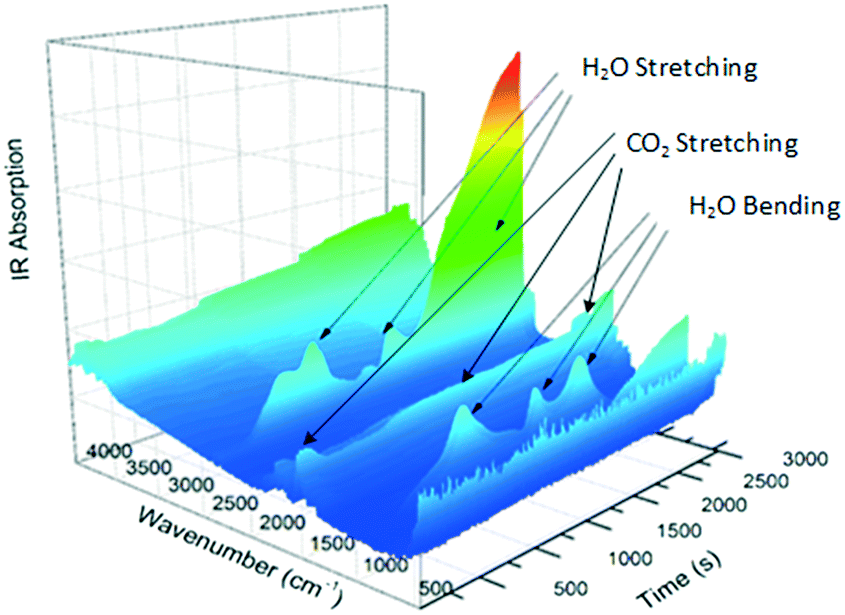
The gas produced during thermal analysis (Fig. 5) was analysed by infrared spectroscopy. The results correspond to the gases expected to be released during decomposition, i.e., H2O first, followed by CO2. Water vapour is evidently released in two events; this may simply be due to adsorption and desorption in the system.
 |
| | Fig. 5 IR absorption spectrum for the decomposition of Nd2(CO3)3·H2O. | |
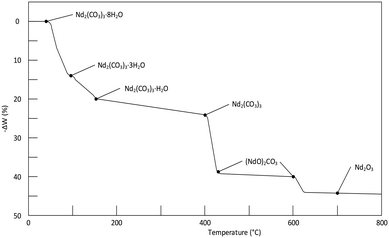 |
| | Fig. 6 Thermogram of the decomposition of Nd2(CO3)3·8H2O at a heating rate of 15 °C h−1. It should be noted that the results in the above figure differs somewhat from table III in Hinode et al.,16 in-case of any contradictions the value in the table was selected instead of on the graph. | |
From Fig. 4 it is seen that Nd2(CO3)3·H2O starts losing mass at ∼50 °C and is fully dehydrated at ∼400 °C:
| | | Nd2(CO3)3·H2O(s) → Nd2(CO3)3(s) + H2O(g) Δm = −3.7% | (1) |
The first decarbonisation step takes place after this, with full conversion to the oxycarbonate observed at just under 500 °C:
| | | Nd2(CO3)3(s) → (NdO)2CO3(s) + 2CO2(g) Δm = −18.1% | (2) |
Conversion of the oxycarbonate to the trioxide takes place between 500 °C and marginally above 800 °C.
| | | (NdO)2CO3(s) → Nd2O3(s) + CO2(g) Δm = −9.0% | (3) |
Above 850 °C only Nd2O3 remains. The net decomposition reaction of Nd2(CO3)3·H2O is shown in eqn (4):
| | | Nd2(CO3)3·H2O(s) → Nd2O3(s) + 3CO2(g) + H2O(g) Δm = −30.8% | (4) |
The compounds present in the relevant temperatures ranges are summarised in Table 1. For structural detail on the decomposition products, and X-ray confirmation of their existence, the reader is referred to the paper by Hinode et al.,16 and references therein.
Table 1 Temperature specific Nd2(CO3)3·H2O decomposition compositions
| Temperature range |
Compound |
|
T < 50 °C |
Nd2(CO3)3·H2O |
| 50 °C < T < 350 °C |
Nd2(CO3)3·H2O + Nd2(CO3)3 |
|
T = 350 °C |
Nd2(CO3)3 |
| 350 °C < T < 500 °C |
Nd2(CO3)3 + (NdO)2CO3 |
|
T = 500 °C |
(NdO)2CO3 |
| 550 °C < T < 700 °C |
(NdO)2CO3 + Nd2O3 |
|
T > 700 °C |
Nd2O3 |
Reaction with AHF.
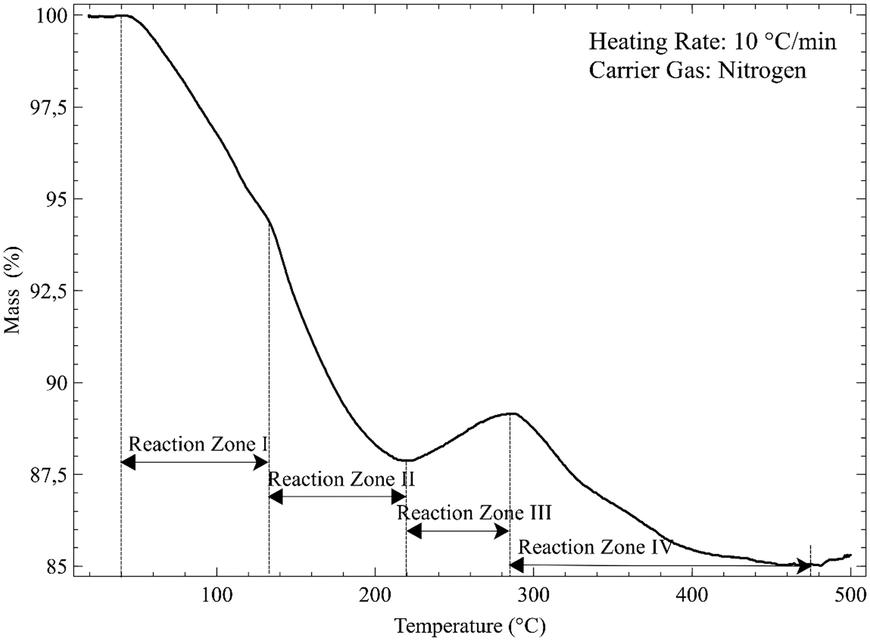
The results of the reaction of Nd2(CO3)3·H2O with 10 wt% anhydrous hydrogen fluoride in a nitrogen carrier gas at a heating rate of 10 °C min−1 are shown in Fig. 7. Unexpected behaviour can be observed between 200 and 300 °C, where an apparent mass increase followed by a further decrease is observed.
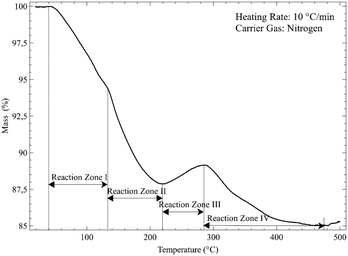 |
| | Fig. 7 Dynamic thermogram of Nd2(CO3)3·H2O in a 10 wt% HF atmosphere. | |
More than one reactant may exist in a given temperature range. For ease of discussion, the thermogram is divided into four reaction zones (I, II, III and IV). These zones correspond to the four dominant reactions taking place. The overall reaction is given by:
| | | Nd2(CO3)3·H2O(s) + 6HF(g) → 2NdF3(s) + 4H2O(g) + 3CO2(g) Δm = −17.3% | (5) |
An overall mass loss of 17.3% is expected. The total observed mass loss is ∼15%, close enough given the fact that fluorination of the crucible may occur. The observed mass losses in zones I and II combine to a total of just more than 12%, followed by a mass increase of 1–2% in zone Iii, and a final mass decrease of 4–5 & in zone IV. Clearly two discrete reactions take place in zones I and II. The products formed here should be expected to undergo fluorination at different temperatures. The most logical hypothesis is that partially fluorinated intermediates form, specifically the non-hydrated oxyfluoride and the fluoride carbonate, in a 1![[thin space (1/6-em)]](https://www.rsc.org/images/entities/char_2009.gif) :3 ratio, according to:
:3 ratio, according to:
| | | 2Nd2(CO3)3·H2O(s) + 4HF(g) → NdOF(s) + 3NdCO3F(s) + NdOF(s) + 3CO2(g) + 4H2O(g) Δm = −12.7% | (6) |
The oxyfluoride shows a mass increase during fluorination, with the fluoride carbonate losing mass:
| | | NdOF(s) + 2HF(g) → NdF3(s) + H2O(g) Δm = + 2.3% | (7) |
| | | NdCO3F(s) + 2HF(g) → NdF3(s) + CO2(g) + H2O(g) Δm = −6.8% | (8) |
The theoretical mass changes are based on the total monohydrate as starting material, and are believably close to observed values.
CSBR experiments
Based on the preliminary results discussed above, an experimental planning matrix for the isothermal CSBR experiments was compiled, shown in Table 2. It allows for a good spread of temperatures and AHF concentrations. One observation from Fig. 8 is that fluorination of Nd2(CO3)3·H2O starts at an unexpectedly low temperature. The possibility of performing the fluorination at low temperature is obviously of significant techno-economic importance, leading to lowered operating costs and lowered capital costs as more cost-efficient construction materials can be used. Experimental temperatures were therefore specifically chosen below 250 °C. This was also done to ensure incomplete conversion and therefore useful isothermal CSBR kinetic data. Incomplete conversion is also preferred to ensure that intrinsic data are measured. At higher conversion values, products may start to inhibit the reaction rate.
Table 2 CSBR experimental planning matrix
|
|
|
Temperature (°C) |
| 100 |
150 |
200 |
250 |
| HF concentration (wt%) |
2, 5 |
|
X |
|
X |
| 5, 0 |
X |
X |
X |
X |
| 7, 5 |
|
X |
|
X |
| 10, 0 |
X |
X |
X |
X |
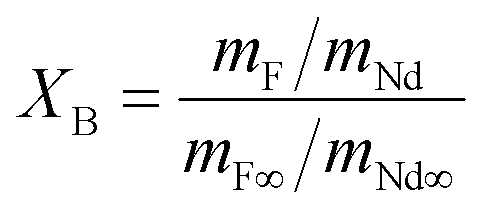
The extent of the fluorination reaction, or conversion (XB), was inferred by comparing the mass ratio Nd:F in the solid product with the Nd:F ratio in pure NdF3, as shown in eqn (9):
| |  | (9) |
Here mNd represents the mass of neodymium in a sample, mNd∞ the mass of neodymium in pure NdF3, mF the mass of fluorine in a sample and mF∞ the mass of fluorine in pure NdF3.
For data interpretation, inferred conversion (XB) is plotted against time, as is common practice in thermal analysis. The time to full conversion (τ) in the selected model for each set of experimental data was optimised by regression analysis to find a coefficient of regression/determination (R2) as close to 1 as possible. The models used are those derived by Levenspiel for spheres and matched to the three ideal shrinking core models, viz., chemical-reaction control, ash-layer diffusion control, and control by diffusion through the stagnant gas film surrounding the solid. Spherical particle models were found to provide the best fit to the experimental data compared to the other possible shape profiles listed by Levenspiel.15
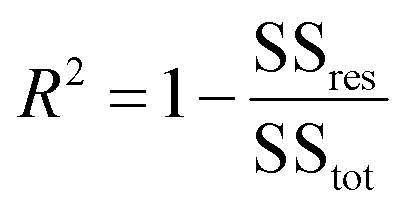
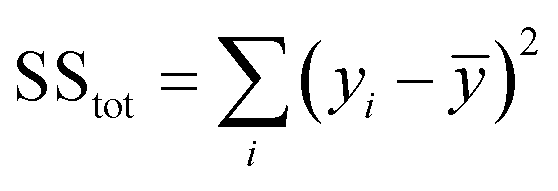
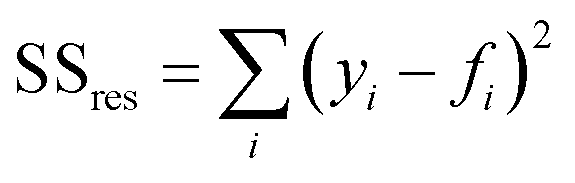
The coefficient of determination, R2, used for linear regression, is defined as follows (eqn (10)):
| |  | (10) |
where SS
tot is the total sum of squares and SS
res is the residual sum of squares,
eqn (11) and
(12):
| |  | (11) |
| |  | (12) |
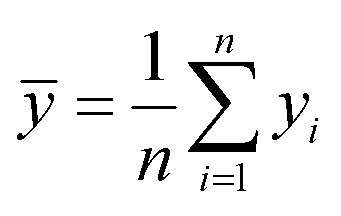
Here fi represents the prediction by the chosen reaction model, and ȳ, the mean of the observed data, is defined by eqn (13):
| |  | (13) |
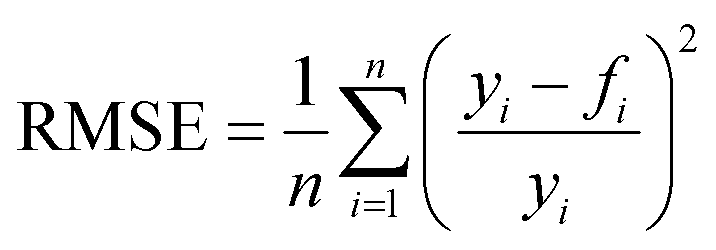
In order to judge the impact of the goodness of fit on the results the RMSE (root mean square functional error) is calculated with eqn (14):
| |  | (14) |
The error on τ is then calculated from eqn (15):
The results of all the CSBR experiments are summarised in Table 3 where the reaction temperature, HF concentration as well as the modelled τ values and corresponding R2 values of these models are shown for each of the experiments. In all cases the model which fits the experimental data best is indicated in bold.
Table 3 Nd2(CO3)3·H2O fluorination CSBR results summary
| Experiment # |
Temp. (°C) |
[HF] (wt%) |
τ
react/R2 (min) |
τ
ash/R2 (min) |
τ
gas/R2 (min) |
| 1 |
100 |
5.0 |
47.1/0.95
|
42.9/0.78 |
26.3/0.89 |
| 2 |
100 |
10.0 |
32.5/0.97
|
31.3/0.88 |
21.9/0.80 |
| 3 |
150 |
2.5 |
106.4/0.90
|
149.1/0.31 |
40.9/0.72 |
| 4 |
150 |
5.0 |
52.8/0.82
|
53.4/0.50 |
27.5/0.78 |
| 5 |
150 |
7.5 |
38.3/0.99
|
34.2/0.90 |
23.8/0.88 |
| 6 |
150 |
10.0 |
29.8/0.93
|
32.1/0.55 |
19.7/0.68 |
| 7 |
200 |
5.0 |
57.0/0.97
|
49.3/0.66 |
29.0/0.96 |
| 8 |
200 |
10.0 |
40.4/0.86
|
23.5/0.76 |
24.6/0.74 |
| 9 |
250 |
2.5 |
104.7/0.68 |
75.2/0.44 |
24.8/0.72
|
| 10 |
250 |
5.0 |
45.7/0.86 |
51.9/0.49 |
25.5/0.91
|
| 11 |
250 |
7.5 |
47.4/0.83 |
29.7/0.63 |
25.5/0.91
|
| 12 |
250 |
10.0 |
26.4/0.94
|
44.0/0.91 |
21.9/0.67 |
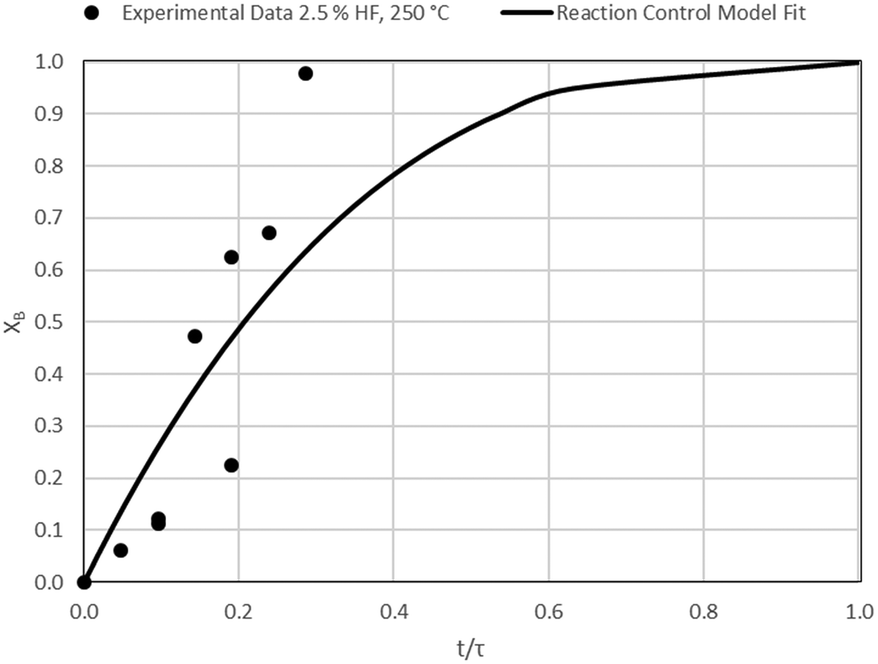
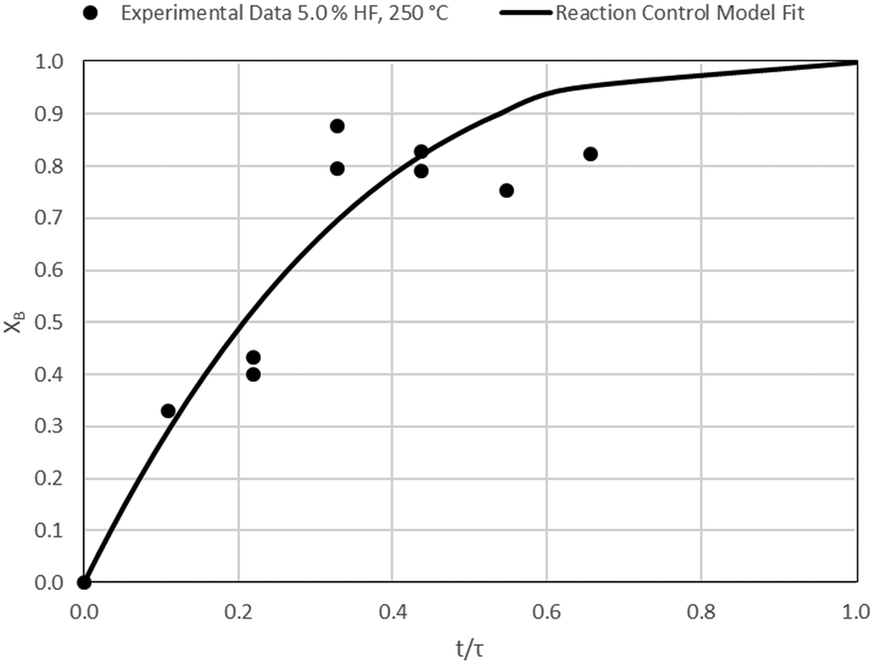
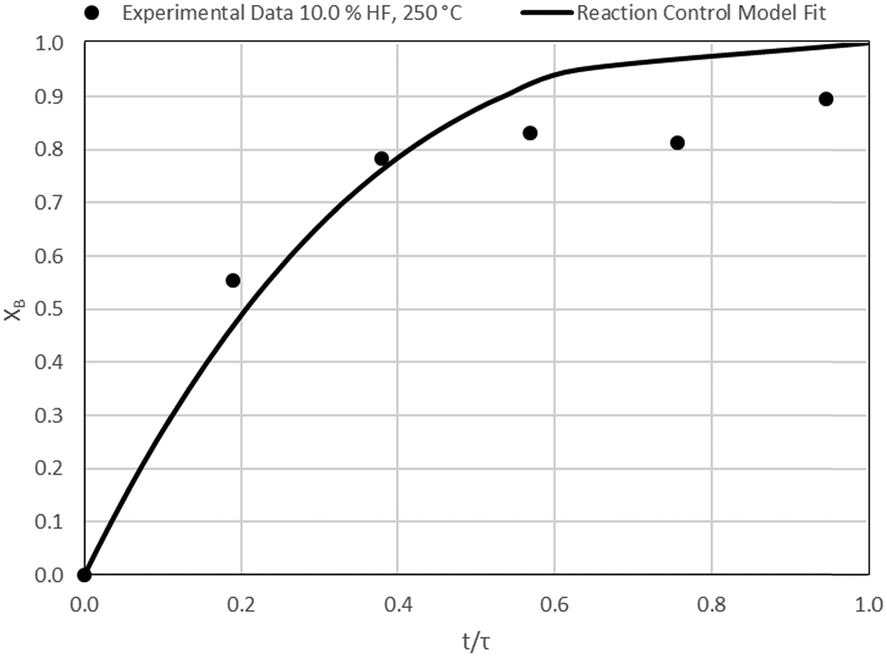
According to Table 3, the reaction-rate control model matches the experimental data best in all cases except for experiments 9, 10 and 11 where the gas-film diffusion rate model fits best. All experiments performed in the CSBR were done under turbulent flow conditions, with a basket spin speed of 1200 rpm. Gas-film diffusion control can thus be regarded as physically improbable, and the near-linear data correlations as false matches. The reaction-control model (eqn (16)) was thus selected as the representative modelling equation for the reaction:
| |  | (16) |
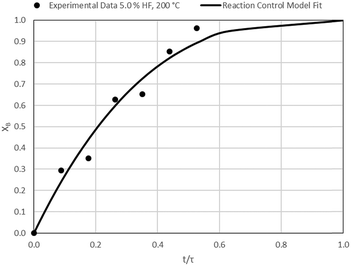
Data plots for the results summarised in Table 3 are shown in Fig. 8–19.
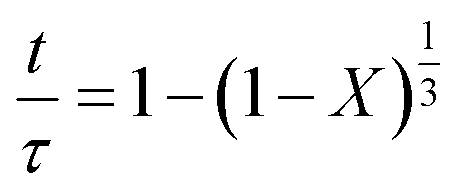
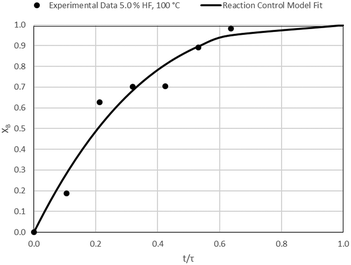 |
| | Fig. 8 Model-to-data fit for 5.0% HF at 100 °C; τ = 47.1 ± 4.6 (Expt # 1). | |
 |
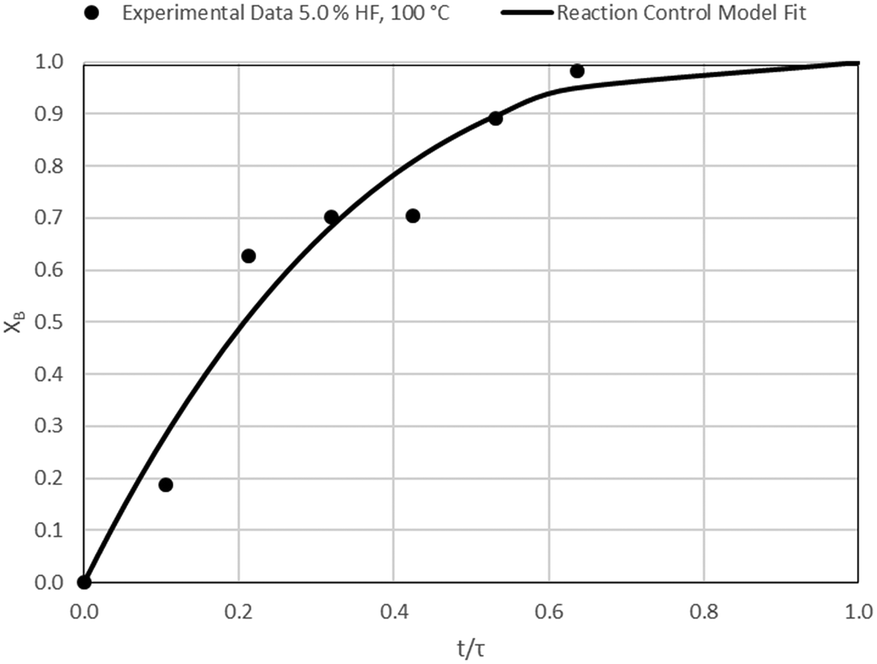
| | Fig. 9 Model-to-data fit for 10.0% HF at 100 °C; τ = 32.5 ± 0.8 min (Expt # 2). | |
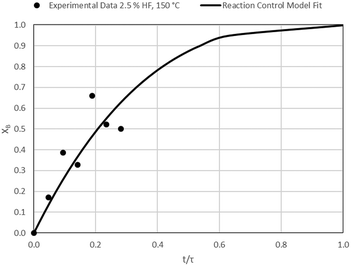 |
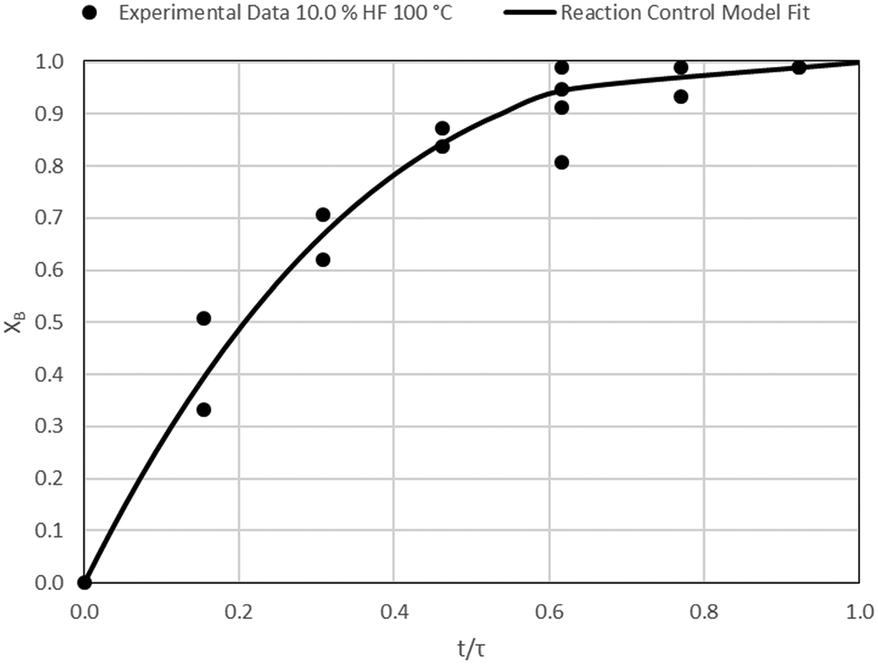
| | Fig. 10 Model-to-data fit for 2.5% HF at 150 °C; τ = 106.4 ± 10.2 min (Expt # 3). | |
 |
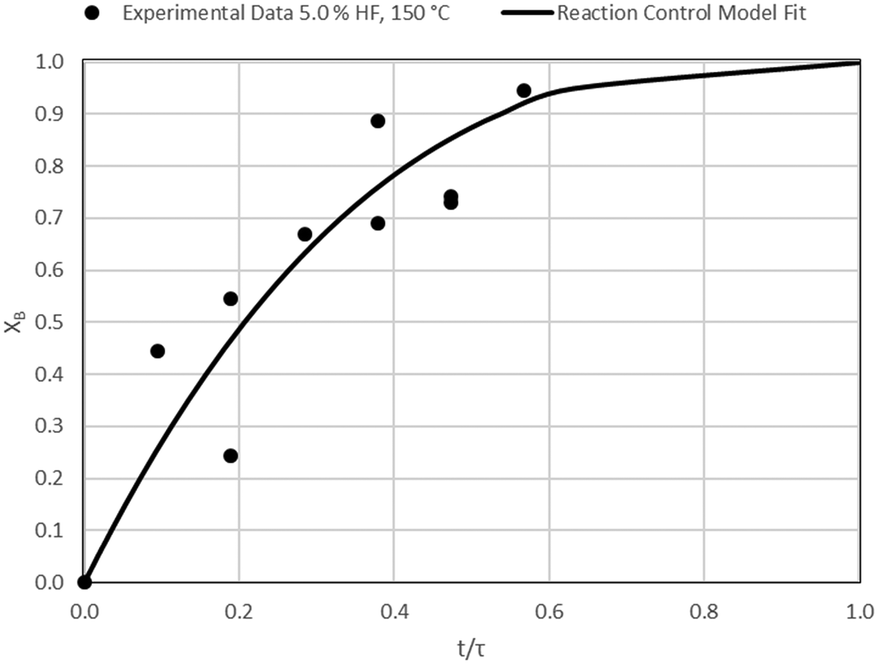
| | Fig. 11 Model-to-data fit for 5.0% HF at 150 °C; τ = 52.8 ± 6.2 min (Expt # 4). | |
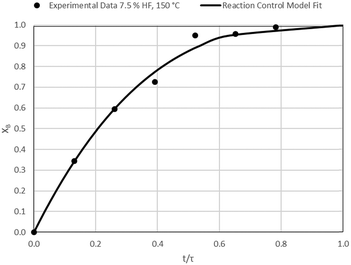 |
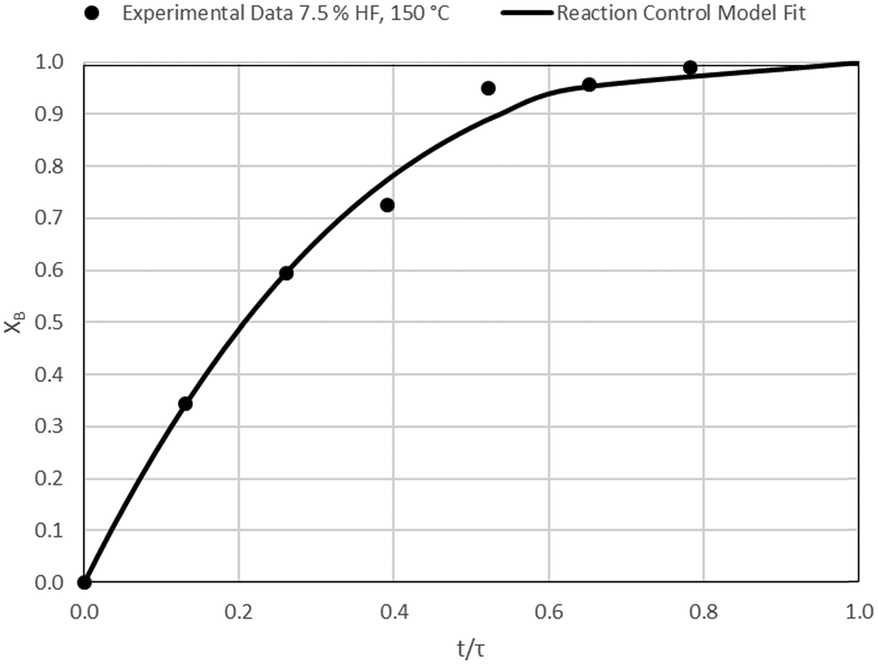
| | Fig. 12 Model-to-data fit for 7.5% HF at 150 °C; τ = 38.3 ± 0.6 min (Expt # 5). | |
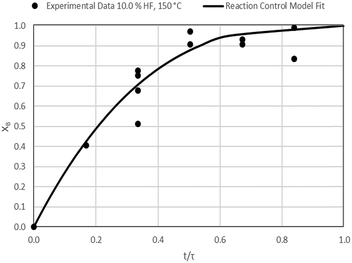 |
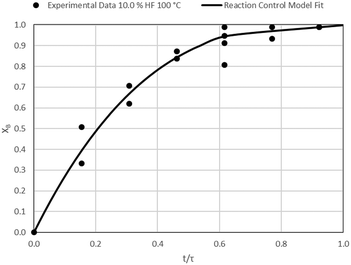
| | Fig. 13 Model-to-data fit for 10.0% HF at 150 °C; τ = 29.8 ± 1.2 min (Expt # 6). | |
 |
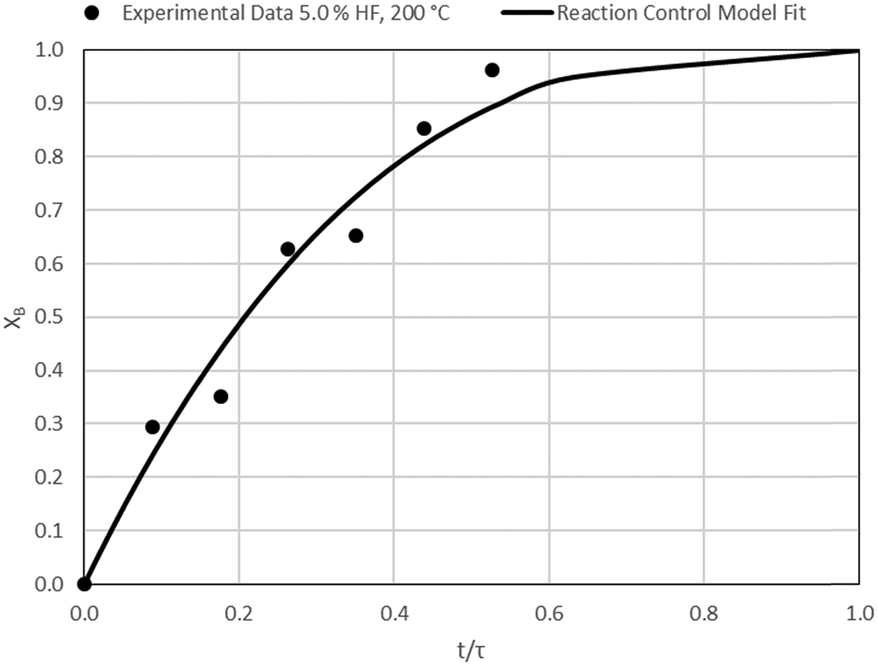
| | Fig. 14 Model-to-data fit for 5.0% HF at 200 °C; τ = 57.0 ± 3.3 min (Expt # 7). | |
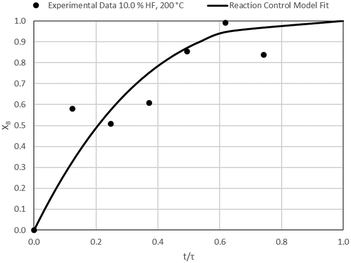 |
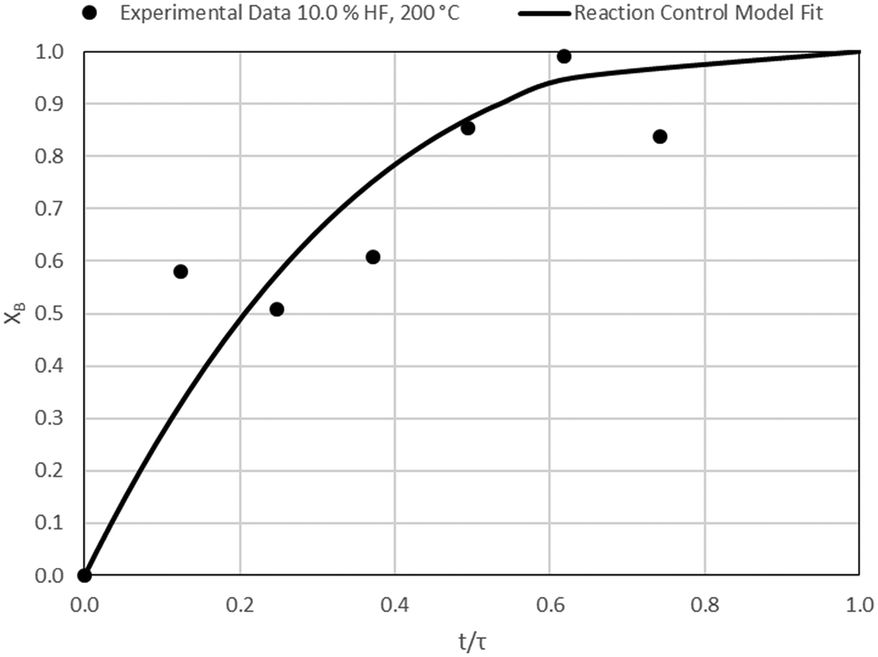
| | Fig. 15 Model-to-data fit for 10.0% HF at 200 °C; τ = 40.4 ± 3.7 min (Expt # 8). | |
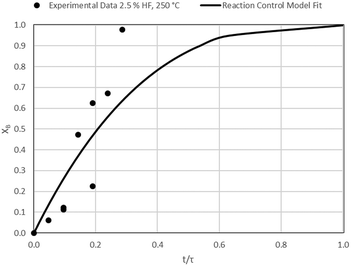 |
| | Fig. 16 Model-to-data fit for 2.5% HF at 250 °C; τ = 104.7 ± 32.2 min (Expt # 9). | |
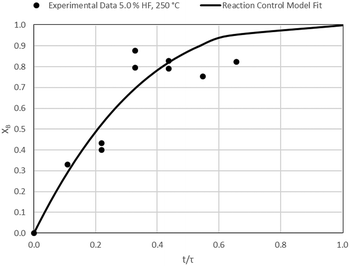 |
| | Fig. 17 Model-to-data fit for 5.0% HF at 250 °C; τ = 45.7 ± 2.7 min (Expt # 10). | |
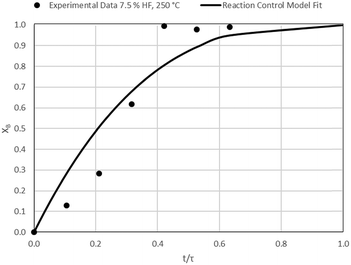 |
| | Fig. 18 Model-to-data fit for 7.5% HF at 250 °C; τ = 47.4 ± 11.5 min (Expt # 11). | |
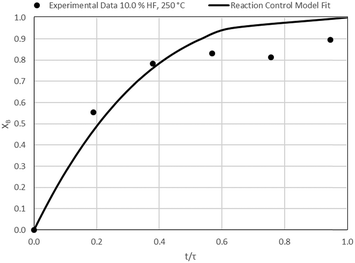 |
| | Fig. 19 Model-to-data fit for 10.0% HF at 250 °C; τ = 26.4 ± 1.4 min (Expt # 12). | |
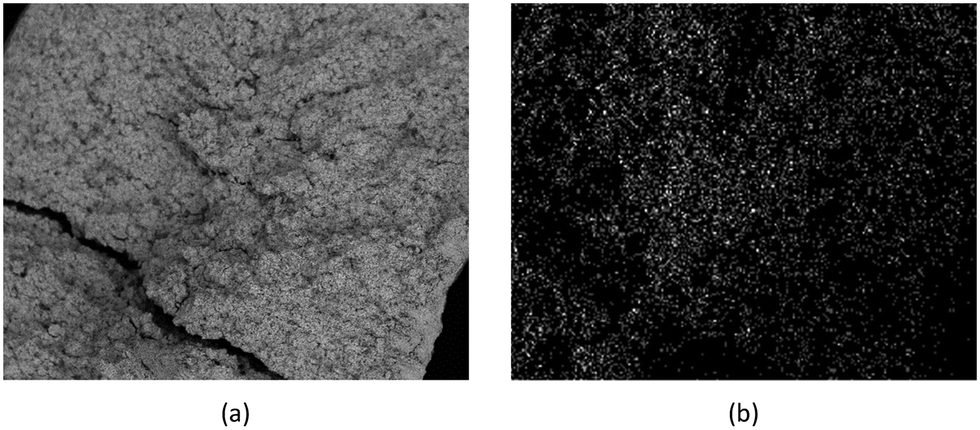
Detailed SEM-EDX examination of the partially fluorinated pellets (Fig. 20) was conducted. No fluorination-reaction front could be detected in any case. This led to the conclusion that the chemical-reaction control model does not apply to macroscopic shrinking pellet core, but rather to the individual particles pressed constituting the larger pellets.
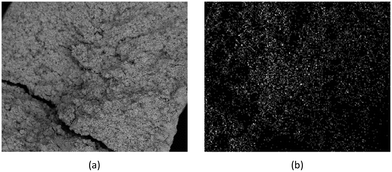 |
| | Fig. 20 (a) SEM image of a typical reacted particle, with a cross-section of approximately 900 μm; (b) EDX fluorine colour map. | |
This conclusion implies that the diffusion rate of the AHF into the pellet to reach the surface of the individual particles has to be faster than the reaction rate. To support this notion, the Thiele modulus/effectiveness factor and the estimated diffusion time may be considered.
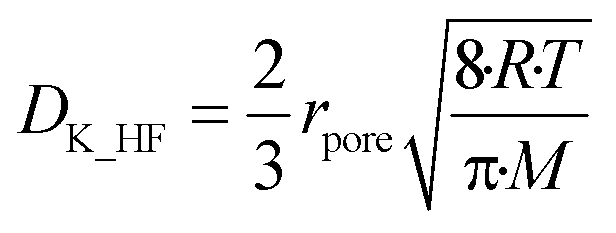
A experimentally determined particle pore diameter of 0.2 μm may be used to determine the Knudsen diffusion coefficient (DK_HF) of HF into the particle for each reaction as shown in eqn (17):18
| | 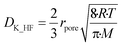 | (17) |
Here rpore represents the characteristic pore radius of the solid particle taking part in the gas–solid reaction, R is the ideal gas constant, T the reaction temperature and M the molar mass of the gas mixture diffusing into the particle in kg mol−1.
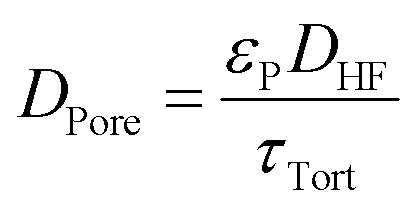
The bulk diffusion in the pores follows from eqn (18) where DHF is the bulk diffusion coefficient of HF in N2 in open space, εP is the porosity of the particles and τTort is the tortuosity of the particles.
| |  | (18) |
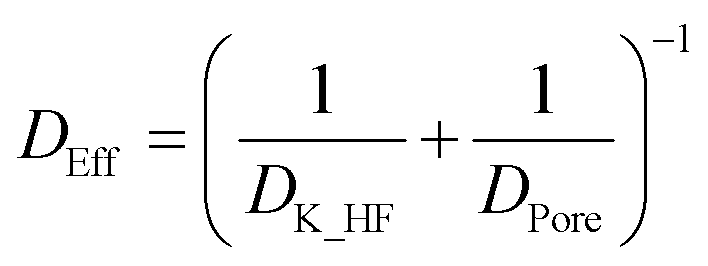
The effective diffusion coefficient of HF into the particles follows from the Knudsen and bulk pore diffusion coefficients:
| |  | (19) |
In order to estimate the effective diffusivity, the Chapman Enskog correlation19 was used to estimate the diffusion coefficient of HF in N2 and it was assumed that the particle porosity is 49% and its tortuosity about 2.0.
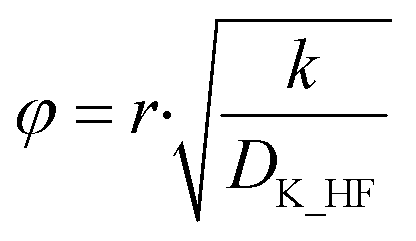
The effective diffusion coefficient was used to determine the Thiele modulus (φ2) for the reaction (eqn (20)) where r represents particle radius.13 A spherical particle approximation was used, which would overestimate the effect of diffusion compared to flat disk particles:
| |  | (20) |
The Thiele modulus is predominantly used in catalytic gas–solid/gas–liquid reactions to compare the relative influences of reaction rate limitations and mass transfer limitations. Based on the derivation of the Thiele modulus,13 it is applicable to reactions in porous particles in general.
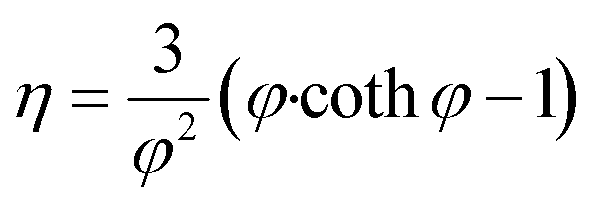
Subsequently the reaction effectiveness factor (eqn (21)) was calculated to determine reaction dependence on internal mass transfer. High effectiveness factors (η) indicate low dependence and vice versa.13
| |  | (21) |
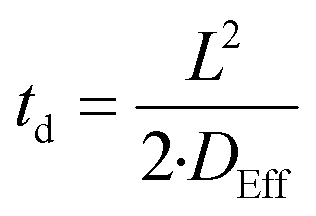
The time required (td) for HF to diffuse into the centre of a particle of Nd2(CO3)·H2O may be estimated using eqn (22):
| |  | (22) |
with
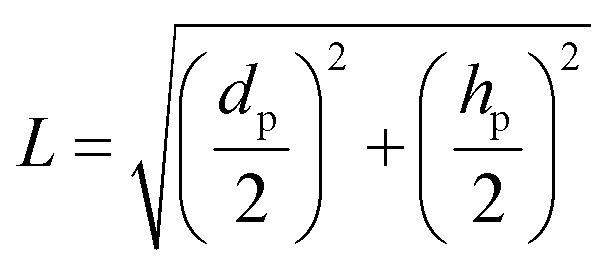
L representing the longest possible diffusion path in a flat cylindrical disk, calculated using
eqn (23):
| |  | (23) |
Here dp is the particle diameter, and hp is the particle height.
Effective diffusion coefficients, Thiele moduli, effectiveness factors and diffusion times for selected temperatures and partial pressures of HF were calculated. The results are given in Table 4. A first order reaction rate constant t (k) of 7.3 s−1 which matches a time to full conversion (τ) of 26 min for an HF concentration of 10 wt% was assumed for these calculations. It is clear that diffusion rate into a particle requires ∼0.3 s, much quicker than the observed reaction times, supporting a chemical-reaction, rather than mass-transfer, control model. The overall effectiveness factor being close to 1 for the observed reaction rate further suggests that the apparent kinetics measured will be close to the true reaction, or reaction rate limited, kinetics of Nd2(CO3)3·H2O fluorination using AHF.
Table 4 Comparative reaction rate and diffusion rate factors for selected reactions
|
T °C |
m
HF wt% |
D
Eff m2 s−1 |
φ (—) |
η (—) |
t
d S |
| 100 |
2.5
|
7.6 × 10⁻⁶ |
1.7 |
0.85 |
0.3 |
| 150 |
5.0
|
9.2 × 10⁻⁶ |
1.5 |
0.87 |
0.3 |
| 200 |
7.5
|
10 × 10−6 |
1.4 |
0.89 |
0.2 |
| 250 |
10.0
|
13 × 10−6 |
1.3 |
0.90 |
0.2 |
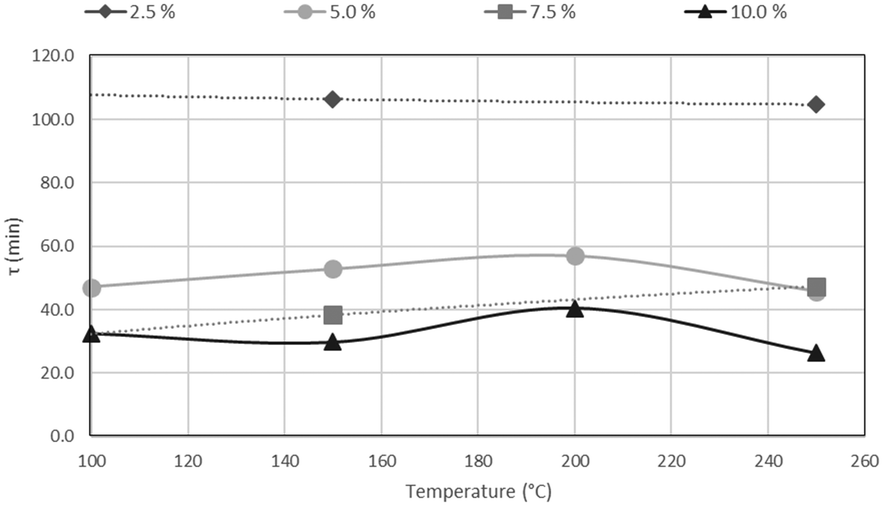
The results of CSBR experiments are summarised in Table 5. The effect of temperature on τ is clearly overshadowed by the effect of HF concentration. This point is further illustrated in Fig. 21, where τ is plotted as a function of temperature for various HF concentrations, and Fig. 22, where τ is plotted as a function HF concentrations for the individual temperatures.
Table 5 Summarised results for the time to reaction completion (τ) as a function of temperature and HF concentration
|
τ (min) |
HF mass fraction (%) |
| 2.5 |
5.0 |
7.5 |
10.0 |
| Temperature (°C) |
100 |
|
47 ± 5 |
|
33 ± 1 |
| 150 |
106 ± 10 |
53 ± 6 |
38 ± 1 |
30 ± 1 |
| 200 |
|
57 ± 3 |
|
40 ± 4 |
| 250 |
105 ± 32 |
46 ± 3 |
47 ± 12 |
26 ± 1 |
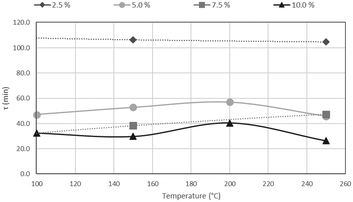 |
| | Fig. 21
τ as a function of temperature, for different AHF concentrations. | |
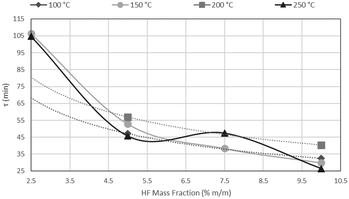 |
| | Fig. 22
τ as a function of AHF concentration, for different temperatures. | |
A clear decrease in τ is seen for higher HF concentrations, in Fig. 21, with a flat response of each curve along the temperature axis. In Fig. 22, τ is plotted as a function of HF concentration for reactions occurring at 100 °C, 150 °C, 200 °C and 250 °C. τ clearly drops along the AHF axis, with little difference between the four isotherms. The low temperatures at which the fluorination occurs, and the minimal effect of temperature on the reaction rate, have far-reaching techno-economic implications as materials of construction such as stainless steel can be used to complete the reaction as opposed to exotic and expensive materials such as Monel or Inconel.
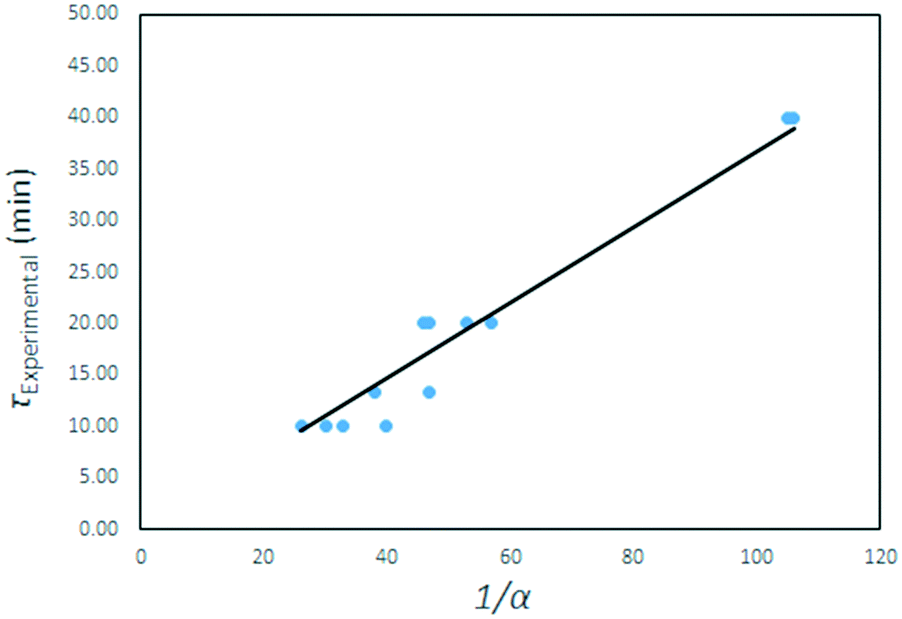
The τ values are plotted as a function of the inverse gas concentration in Fig. 23, for all temperatures under investigation. The resulting graph shows a linear relationship between τ and the inverse of gas reagent concentration. This leads to the conclusion that the fluorination reaction is first order, and again that the effects of temperature on the reaction rate are negligible.
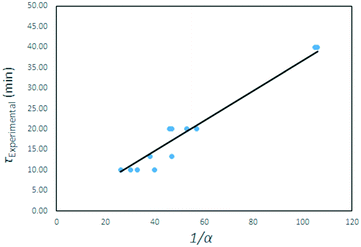 |
| | Fig. 23
τ values for all temperatures plotted as function of the inverse of the AHF mass fraction α. | |
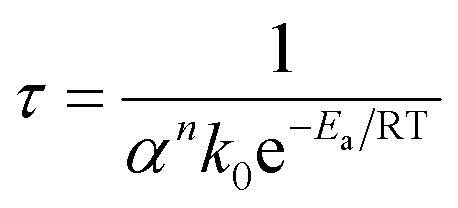
A quasi-Arrhenius fit to all τ values, with the sum of errors between predicted model values for τ and experimental values as the objective function minimised, confirmed the reaction order n to be unity, and the activation energy to approach zero. The model fitted took the form:
| |  | (24) |
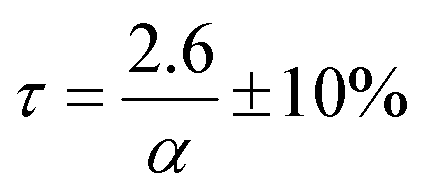
Here α is the mass fraction AHF. The implication is that all parameters are folded into the pre-exponential factor. Since a number of reactants are possible in the temperature range, as discussed above, the exact stoichiometric coefficients are not known, this is a necessity. The final form for τ, the time to reaction completion, in minutes, to be used in eqn (16), is independent of temperature and found to be simply:
| |  | (25) |
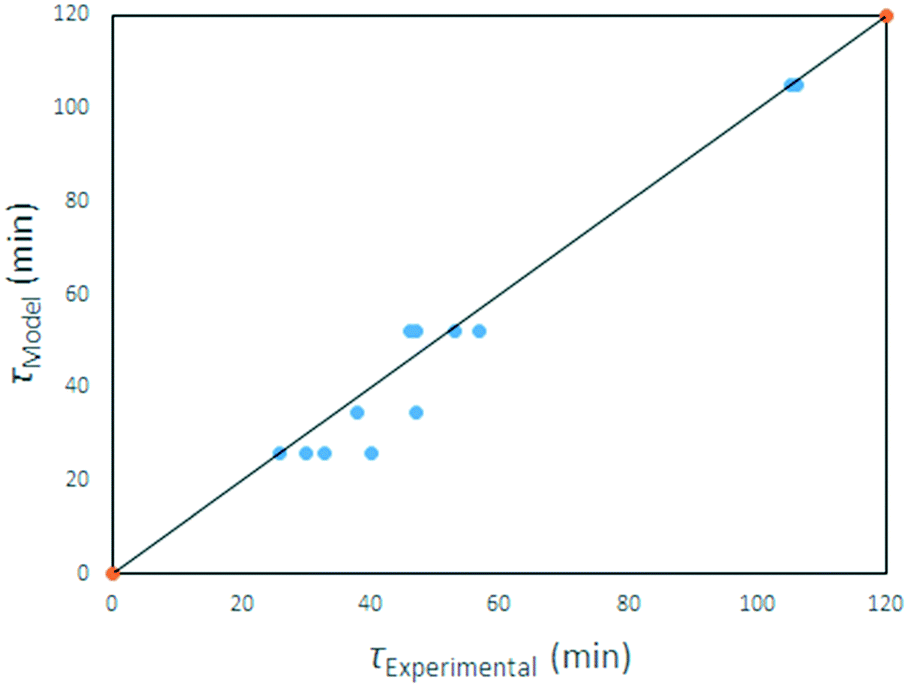
Eqn (25) applies to our solid starting material, its density and particle size distribution, in the temperature range investigated. A parity plot of model-predicted v experimental reaction time is given in Fig. 24.
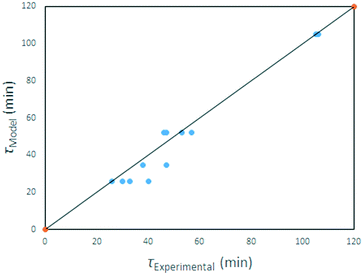 |
| | Fig. 24 Model-predicted times to full reaction. | |
Conclusions
The results confirm that in the temperature range studied, i.e., between 100 °C and 250 °C, the kinetics of the fluorination of Nd2(CO3)3·H2O using AHF is independent of temperature, and directly proportional to the concentration of AHF. The rate-limiting step is the chemical reaction itself, between the individual particles comprising the pressed pellets used for the investigation, and the hydrogen fluoride. Mass transport effects through the stagnant gas film, the product ash layer, and the pores of the reactant pellets were eliminated and the kinetics derived may be assumed to be the inherent kinetics for the reaction. In the temperature range investigated, and an AHF concentration of 10 wt% a reaction time τ of 26 ± 3 min is predicted. The relatively low reaction temperature requires no specialised materials of construction for reactors or other equipment, i.e., passivated mild steel will suffice for sacrificial reactors and SS 316 L for tubing and instrumentation as opposed to high-nickel specialist alloys, significantly lowering capital cost and maintenance costs for the plant. The reaction rate can potentially be increased significantly by increasing the AHF concentration, without adversely affecting maintenance and materials of construction selection
Conflicts of interest
There are no conflicts to declare.
Acknowledgements
The authors would like to thank the South African National Research Foundation (NRF) and the Department of Science and Technology (DST) under the Fluorochemical Expansion Initiative (FEI) for their sponsorship.
Notes and references
- M. V. Bosco, G. G. Fouga and A. E. Bohé, Thermochim. Acta, 2012, 540, 98–106 CrossRef CAS.
-
N. Jepson, SAIIA Occasional Papers, 2012, vol. 113 Search PubMed.
-
C. K. Gupta and N. Krishnamurthy, Extractive Metallurgy of Rare Earths, CRC Press, Florida, 2005 Search PubMed.
- W. K. Sang, H. K. Eung, G. A. Byung, H. Y. Jae and G. A. Ho, J. Ind. Eng. Chem., 2002, 8(5), 477–482 Search PubMed.
- J. J. Carberry, Ind. Eng. Chem., 1964, 56, 39 CrossRef CAS.
- E. L. Fornero, J. L. Giombi, D. L. Chiavassa, A. L. Bonivardi and M. A. Baltanás, Chem. Eng. J., 2015, 264, 664–671 CrossRef CAS.
- D. G. Tajbl, J. B. Simons and J. J. Carberry, Ind. Eng. Chem. Fundam., 1966, 5, 171 CrossRef CAS.
- S. T. Kolaczkowski and U. Ullah, Chem. Eng. Sci., 1989, 44(12), 2843–2852 CrossRef CAS.
- J. R. Perreira and P. H. Calderbank, Chem. Eng. Sci., 1974, 30, 167–175 CrossRef.
- E. Diaz, A. F. Mohedano, J. A. Casas and J. J. Rodriguez, Appl. Catal., B, 2015, 181, 429–435 CrossRef.
- U. Cernigoj, U. L. Stangar and P. Trebse, J. Photochem. Photobiol., A, 2006, 188, 169–176 CrossRef.
- F. Teruk and H. Winter, Ind. Eng. Chem. Res., 1990, 29, 7 Search PubMed.
-
H. S. Fogler, Elements of Chemical Reaction Engineering 4th Edition, Pearson Education Inc., New Jersey, 2006 Search PubMed.
-
R. E. Hayes and J. P. Mmbaga, Introduction to Chemical Reactor Analysis, CRC Press, Florida, 2nd edn, 2012 Search PubMed.
-
O. Levenspiel, Chemical Reaction Engineering, John Wiley and Sons, New York, 3rd edn, 1999 Search PubMed.
- H. Hinode, R. Sharma and L. Eyring, J. Solid State Chem., 1990, 84, 102–117 CrossRef CAS.
- P. Kim, A. Anderk, A. Navrotsky and R. E. Riman, Minerals, 2018, 8(3), 106 CrossRef.
-
D. Murzin and T. SalmiCatalytic Kinetics, Elsevier, Oxford, 1st edn, 2005 Search PubMed.
-
R. H. Perry and D. W. Green, Perry's Chemical Engineers' Handbook, McGraw-Hill, 7th edn, 1997 Search PubMed.
|
| This journal is © The Royal Society of Chemistry 2019 |
Click here to see how this site uses Cookies. View our privacy policy here. 
 a
a