DOI:
10.1039/D4MA01194E
(Paper)
Mater. Adv., 2025,
6, 756-765
Eu-MOF and its composites as turn-off fluorescence sensors for p-nitrophenol with applications in monitoring catalytic reduction reactions†
Received
4th December 2024
, Accepted 5th December 2024
First published on 6th December 2024
Abstract
p-Nitrophenol (p-NP) is one of the toxic nitrophenol pollutants; detection methods for these pollutants are of importance. A new europium metal–organic framework (Eu-MOF) was prepared with 5-(4H-1,2,4-triazol-4-yl)isophthalic acid (H2TIPA) and 2-aminoterephthalic acid (H2NBDC). The XPS and TEM analyses support the distribution of Pd nanoparticles (Pd NPs) on the surface of Eu-MOF with a particle size of 5.7 ± 1.8 nm. MeOH solutions of Na+, K+, Mg2+, Ca2+, Fe3+, Mn2+, Cl−, and SO42− do not greatly affect the fluorescence quenching of Eu-MOF by p-NP. The sensitivity test shows a linear fitting equation of (I0 − I)/I = 2.45 × 10⁵Cp-NP (Cp-NP = p-NP concentration) at Cp-NP = 1–10 with LOD = 80.1 nM. The detection mechanism is the inner filter effect based on a pseudo-first-order physical adsorption and a Freundlich model for the adsorption of p-NP by Eu-MOF and Pd@Eu-MOF@SA. The changes in the absorbance at 400 nm and the emission intensity at 450 nm occur synchronously with Cp-NP in the catalytic process of the reduction p-NP by Pd@Eu-MOF@SA. Pd@Eu-MOF@SA maintains high durability over eight adsorption–desorption cycles. Pd@Eu-MOF@SA acts as a fluorescent indicator for the catalytic reduction reaction of p-NP by NaBH4 with an obvious emission color change. This work provides a new fluorescence sensor for p-NP detection and visualization monitoring for the reduction reaction of NaBH4 and p-NP.
Introduction
p-Nitrophenol (p-NP) is a toxic nitrophenol pollutant that is commonly used in medical production and the chemical industry.1,2 Its accumulation in the environment induces many health problems throughout the food chain, such as dehydration or hypoxia, brain and lung edema, and extensive vascular damage throughout the body.3,4 Therefore, U.S. Environmental Protection Agency stipulates that the p-NP concentration (Cp-NP) must not be higher than 0.14 μmol L−1 (μM) in bodies of water.5 The toxicity and carcinogenicity of p-NP have created interest in methods for its detection, including liquid chromatography-mass spectrometry,6,7 chromatographic separation, electrochemistry,8,9 capillary electrophoresis,10 high-performance liquid chromatography,11,12 gas chromatography-mass spectrometry,13,14 ion mobility spectroscopy,15 and micelle electrokinetic capillary chromatography methods.16 However, the drawbacks of these methods, such as complicated sample treatments, expensive instruments/regents, and long and costly operations, create some difficulties in monitoring p-NP-containing environmental samples.17 A facile p-NP detection method is greatly needed, but remains a challenge.
Metal–organic frameworks (MOFs) represent a source of p-NP luminescence sensors and feature rapidness, low cost, visualization, and non-destruction. MOFs have a huge variety with designable structures and controllable porosities, providing a wide selection for p-NP luminescence sensors.18,19 Among them, the lanthanide MOFs (Ln-MOFs) exhibit large Stokes shifts, narrow emission, high quantum efficiency, long fluorescence lifetimes (FLTs), and wide excitation wavelengths.20,21 A large Stokes shift can avoid the self-absorption of the ligand, reducing the background signal; a long FLT is helpful to eliminate interferent fluorescence with a short lifetime through time-resolved fluorescence; and a narrow emission band shows pure chromaticity and high sensitivity of detection.22 The spectrographic signals of the changes in emission intensities or emission bands of luminescent Ln-MOFs are used to monitor reaction processes involving p-NP.23–25Cp-NP, as the controlling factor, induces a spectrographic signal, which then provides an indication of the p-NP reduction process.26 It is easy to visually monitor the reaction process of p-NP in situ or real-time via the obvious emission color changes.
Herein, we present a new Ln-MOF, [Eu4(OH)2(TIPA)4(NBDC)(H2O)4]·2H2O (Eu-MOF), which is constructed using Eu3+ with the mixed ligands 5-(4H-1,2,4-triazol-4-yl)isophthalic acid (H2TIPA) and 2-aminoterephthalic acid (H2NBDC). The Eu-MOF exhibited a rapid fluorescence quenching response the towards p-NP, and its detection performance was inspected. The sensitivity and selectivity tests support the quantitative analysis of p-NP by Eu-MOF with a linear fitting equation of (I0 − I)/I = 2.45 × 10⁵Cp-NP at Cp-NP = 1–10 μM, and the limit of detection (LOD) was calculated as 80.1 nmol L−1 (nM). Additionally, Pd@Eu-MOF and Pd@Eu-MOF@SA composites (Pd = Pd NPs: Pd nanoparticles, SA = sodium alginate) were prepared. In our design strategy, Eu-MOF is used as a fluorescence indicator, the Pd NPs as a catalyst to reduce p-NP, and SA as a porous supporting matrix, resulting in the preparation of a highly efficient catalyst–fluorescent indicator composite gel material. The adsorption kinetics of Pd on EU-MOF are interpreted using a pseudo-first-order model and the adsorption isotherm follows a Freundlich model. Pd@Eu-MOF@SA was used as a fluorescent indicator to monitor the catalytic reaction of the reduction of p-NP by NaBH4. The change in its visual emission color from bright blue to dark can sensitively indicate the catalytic reduction reaction of p-NP.
Materials and methods
Materials and reagents
Chemicals were purchased from commercial sources and used without purification. Crystal structure data was collected using a Rigaku XtaLAB Synergy R single crystal X-ray diffractometer using Cu-Kα X-rays (λ = 1.54184 Å) at 293 K under a working current of 1200 mA and a voltage of 40 kV. After data reduction, the SHELXL-2014/7 program package was used to solve the crystal structure by direct method. The data was refined with the full-matrix least-square technique on F2. Anisotropic refinement was performed on the non-hydrogen atoms, and the hydrogen atoms were positioned by their carrier atoms with isotropic thermal parameters in the final refinement. Powder X-ray diffraction (PXRD) measurements were performed using a MiniFlex 600 fully automatic X-ray diffractometer with a scanning speed of 10° min−1 and a scanning step of 0.02° under an operating voltage of 40 kV and an operating current of 15 mA. A Tensor 27 infrared spectrometer was used to determine the infrared spectrum (FI-IR) of Eu-MOF with a KBr pellet in the wavenumber range of 4000–400 cm−1. The emission and excitation spectra were obtained using a Hitachi FL-4600 fluorescence spectrometer with Xe as the light source. The fluorescence decay curve of Eu3+ in the blank Eu-MOF was recorded using an Edinburgh FLS 920 fluorescence spectrophotometer with a 150-W microsecond pulsed lamp. Ultraviolet-visible (UV-Vis) spectroscopy was conducted using a Lambda 1050 UV Visible Near Infrared Spectrometer. The elemental analyses of C, H, N were carried out using a CSNH Vario EL cube elemental analyzer with the decomposition temperature set within 950–1200 °C. The surface morphologies and energy spectrum analyses of the samples involving Eu-MOF and the particle size distribution and lattice fringes of the Pd NPs were characterized using a Titan Cubed Themis G2 300 Spherical Aberration Correction Transmission Electron Microscope with a carbon supported copper mesh of 300 mesh and a diameter of 3 mm. The chemical shifts of the inner shell electron energy levels were measured using an Axis Ultra X-ray photoelectron spectrometer (Kratos Analytical Ltd) to analyze the atomic binding states and electron distribution states. The full X-ray photoelectron spectroscopy (XPS) data was corrected, divided, and fitted using Casa XPS software with the C 1s peak at 284.8 eV as the reference; the photoelectron peaks and binding energies were used to determine the elemental valence state distribution of the samples.
Synthetic procedures
Synthesis of Eu-MOF.
Eu(NO3)3·6H2O (0.04 mmol, 0.0178 g) mixed with H2TIPA (0.05 mmol, 0.0119 g), H2NBDC (0.03 mmol, 0.0054 g), and 2-fluorobenzoic acid (3.50 mmol, 0.4871 g) and dissolved in a 2.2-mL N,N-dimethylformamide (DMF), 0.5 mL H2O and 0.3 mL, 3.5 M nitric acid DMF solution. After 5 min of ultrasonic vibration, the transparent mixture was transferred to a 25-mL Teflon-lined stainless-steel autoclave and heated at 120 °C for 2 d. The pale-yellow platelet crystals of Eu-MOF were collected and washed with DMF and ethanol (EtOH) three times and dried under vacuum overnight. Yield based on Eu: 0.0026 g, 27.86%. Elemental analysis (%), found (calcd): C, 31.14 (30.87); H, 3.27 (2.05); N, 9.94 (10.51). FT-IR data (in KBr, cm−1) for Eu-MOF: 3436(m), 3117(w), 3079(w), 1624(s), 1551(s), 1385(s), 1164(w), 1098(w), 1048(w), 780(w), 711(w), 553(w).
Synthesis of Pd nanoparticles.
16.6 mg of polyvinyl pyrrolidone (PVP) was dissolved in 40 mL EtOH, and 10.0 mL of 6 μM H2PdCl6 aqueous solution was dropped into the PVP solution with vigorous stirring. The mixed solution was transferred into a 100 mL round bottom flask and refluxed for 3 h to obtain stable Pd NPs in PVP, which was sealed and stored at 4 °C.
Synthesis of Pd@Eu-MOF.
5 mL of Pd NPs was dropped into 5 mL of Eu-MOF suspension containing 200 mg Eu-MOF with vigorous stirring for 2 h. Pd@Eu-MOF was separated through 10 min of centrifugation at 5000 rpm and washed with EtOH three times. Pd@Eu-MOF was dried under vacuum overnight and stored at room temperature.
Synthesis of Pd@Eu-MOF@SA.
A 5 wt% SA solution was prepared by adding 0.05 g SA into 1 mL deionized water with stirring for 6 h. 0.02 g of Pd@Eu-MOF was added to 1 mL deionized water with stirring for 2 h to obtain a uniform 2 wt% Pd@Eu-MOF suspension. 1 mL of 2 wt% Pd@Eu-MOF and 1 mL of 5 wt% SA solution were mixed together with vigorous stirring and transferred to a 1-mL elliptical mold after stirring for 6 h. The mold was frozen at −20 °C for 2 h and thawed at room temperature for 2 h. This process was repeated three times. The mold was soaked in 1 M CaCl2 solution and removed after half an hour. The obtained Pd@Eu-MOF@SA was soaked in 1 M CaCl2 solution for a further 12 h, washed three times using deionized water, and freeze-dried for 6 h to obtain the Pd@Eu-MOF@SA gel, which was stored in a dry place.
Characterization of Eu-MOF
Fluorescence.
A 0.5 mg mL−1 Eu-MOF methanol (MeOH) suspension was prepared by dispersing 1 mg Eu-MOF into 2 mL MeOH with ultrasonic vibration for 1 h. A 1 × 10⁻² M p-NP solution was prepared by dissolving 1.4 mg p-NP in 1 mL MeOH and diluted 100 times to 1 × 10⁻⁴ M. 1 mL of 0.5 mg mL−1 Eu-MOF was added to a cuvette and 10 μL of 1 × 10⁻⁴ M p-NP was dropped into the cuvette 20 times to give a Cp-NP range of 0–2 × 10⁻⁵ M with a step of 1 × 10⁻⁶ M. The emission spectra of Eu-MOF in the sensing of p-NP were characterized after each addition of p-NP through the excitation at 300 nm.
Adsorption kinetics test.
20 mg p-NP was dissolved in 500 mL deionized water to prepare 500 mL of 40 mg L−1p-NP solution. 1 mg Eu-MOF was dispersed into 4 mL of 40 mg L−1p-NP, and the supernatant was separated by 3 min of centrifugation at 8000 rpm after being allowed to stand for 4, 6, 8, 10, 12, 20, 40, or 60 min. The Cp-NP values of the supernatants were determined using UV-vis spectra.
Adsorption isotherm test.
1 mg Eu-MOF was dispersed into seven 30–60 mg L−1p-NP solutions with concentration steps of 5 mg L−1. The supernatants were separated by 3 min of centrifugation at 8000 rpm after being allowed to stand for 60 min; the Cp-NP values of the supernatants were determined using UV-vis spectroscopy.
Tests of Pd@Eu-MOF in the sensing of p-NP
Optimization of Pd@Eu-MOF dosage.
1.5 mg Pd@Eu-MOF was dispersed into 1 mL deionized water to prepare a 1.5 mg mL−1 Pd@Eu-MOF suspension using 60 min of ultrasonic vibration. 3 mL of 1 × 10⁻⁴ M p-NP and 9 mg NaBH4 were mixed in a cuvette, and 50–200 μL of 1.5 mg mL−1 of Pd@Eu-MOF was then added in steps of 50 μL. The time-resolved UV-vis spectra of the samples were characterized.
Contrast test.
Three groups consisting of 3 mL of 1 × 10⁻⁴ M p-NP and 9 mg NaBH4 were mixed with 150 μL of 1.5 mg mL−1 Pd@Eu-MOF, Eu-MOF, or Pd NPs stabilized by 1.2 × 10⁻⁶ M PVP in cuvettes. Their time-resolved UV-vis spectra were characterized.
Fluorescence recovery test.
3 mL of 1 × 10⁻⁴ M p-NP and 9 mg NaBH4 were mixed with 150 μL of 1.5 mg mL−1 Pd@Eu-MOF in a cuvette. The emission of the mixture was characterized every 15 s from 0 to 6 min under excitation at 300 nm.
Test of Pd@Eu-MOF@SA in the sensing of p-NP
Adsorption kinetics test.
4 mg Pd@Eu-MOF@SA was dispersed into 10 mL of a 100 mg L−1p-NP solution. After being allowed to stand for 8, 10, 14, 18, 22, 30, 40, 50, or 60 min, the supernatants were separated by 3 min of centrifugation at 8000 rpm. The Cp-NP values of the supernatants were determined using UV-vis spectroscopy.
Adsorption–desorption cycles.
4 mg Pd@Eu-MOF@SA was dispersed into 10 mL of a 100 mg L−1p-NP solution. The supernatant was separated by 3 min of centrifugation at 8000 rpm after being allowed to stand for 120 min. The Cp-NP values of the supernatants were determined using UV-vis spectroscopy. The separated Pd@Eu-MOF@SA was immersed in 20 mL MeOH for 12 h to desorb p-NP. The renewed Pd@Eu-MOF@SA was used to repeat the adsorption–desorption process to test the durability of Pd@Eu-MOF@SA in sensing p-NP.
Fluorescence recovery test.
Two groups consisting of 3 mL of 1 × 10⁻⁴ M p-NP and 9 mg NaBH4 were mixed with 0.1 g Pd@Eu-MOF@SA. One group was used for the time-resolved UV-vis spectroscopy. The other group was used to obtain the emission spectrum, which was measured every 3 min from 0 to 20 min under excitation with 300-nm UV light.
Results and discussion
Structure analysis
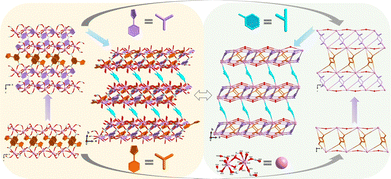
The crystal structure analysis reveals that Eu-MOF ([Eu4(OH)2(TIPA)4(NBDC)(H2O)4]·2H2O) features a 3D framework whose asymmetric unit contains two different Eu(III) centres, two TIPA2− and half an NBDC2− ligand, one OH− anion, two coordinated water molecules and one lattice water. The structural determination and refinement details of Eu-MOF, and the selected bond distances and angles are listed in the ESI† (Tables S1 and S2). Both TIPA2− ligands adopt the same coordination mode of μ4-bis-bidentate bridging, and the NBDC2− ligand adopts a μ4-bis-monodentate bridging/chelating mode (Fig. S1, ESI†). The seven-coordinated Eu1 forms a single cap octahedron surrounded by four carboxylate oxygen atoms from four different TIPA2− ligands and three oxygens from NBDC2−, OH−, and O1W, respectively. The eight-coordinated Eu2 forms a dodecahedron constructed by four carboxylate oxygen atoms from four different TIPA2− ligands and four oxygens from two NBDC2−, OH−, and O2W respectively (Fig. S2, ESI†). With two pairs of μ2-bidentate COO− and one μ2-monodentate bridging/chelating COO− (Fig. S2, ESI†), Eu1 and Eu2 are connected into a [Eu2(COO)7(H2O)2] SBU, which further grows into a 1D chain through O1 bridges along the a-direction. The neighbouring 1D chains are woven into a 1D double chain by the phenyl part of TIPA2−, and are further interconnected into a 2D layer by the phenyl part of TIPA2−. The 2D layers finally are constructed into a 3D framework by the linking of NBDC2− (Fig. 1).
 |
| | Fig. 1 Structural construction of Eu-MOF. | |
Characterizations
Water- and organic-solvent-resistance.
Eu-MOF was immersed in water and nine kinds of organic solvents for 5 h, including DMF, dimethyl sulfoxide (DMSO), MeOH, EtOH, tetrahydrofuran (THF), acetone, acetidin, trichloromethane (CHCl3), and acetonitrile (CH3CN). After being dried at 60 °C overnight, Eu-MOF was characterized using PXRD and emission spectroscopy. The experimental PXRD pattern of Eu-MOF is the same as the simulated one from the single crystal data (Fig. S3a, ESI†), demonstrating the Eu-MOF bulk sample has a high phase purity and that the structure analysis is correct. Eu-MOF having the same PXRD patterns in water and organic solvents suggests that it has high water- and organic solvent-resistances (Fig. S3b, ESI†). Furthermore, the PXRD patterns of Pd@Eu-MOF and Pd@Eu-MOF@SA both contain PXRD peaks from Eu-MOF, indicating the loading of Pd NPs and the encapsulation of Pd@Eu-MOF in SA do not destroy the structure of Eu-MOF (Fig. S4, ESI†).
XPS of Pd@Eu-MOF.
XPS revealed the binding energies of Pd@Eu-MOF, including Eu3d (1160.6, 1132.7 eV), O1s (526.7 eV), N1s (396.2 eV), Pd3d (368.3 and 312.7 eV), C1s (280.2 eV), Eu4p (257.2 eV), and Eu4d (134.9 eV), consistent with the components of Pd@Eu-MOF (Fig. S5a, ESI†). The binding energies of Pd0 are observed at 335.77 and 341.11 eV respectively (Fig. S5b, ESI†), which are attributed to the orbitals of Pd0 3d5/2 and Pd0 3d3/2. These results agree well with the oxidation state of zero in the Pd NPs, and also support the successful loading of Pd NPs on Eu-MOF.
Transmission electron microscope.
The transmission electron microscope (TEM) image reveals that the Pd NPs are distributed unevenly over the Eu-MOF sheets (Fig. 2a), and their particle size was determined to be 5.7 ± 1.8 nm using a laser particle size analyzer. These results suggest that Eu-MOF plays a crucial role in avoiding the aggregation of Pd NPs through their encapsulation in Eu-MOF. High-resolution TEM shows that the [111] crystal plane of the Pd NPs in Pd@Eu-MOF has an interplanar spacing of 0.235 nm (Fig. 2b).
 |
| | Fig. 2 (a) TEM image of Pd@Eu-MOF and (b) high-resolution TEM image of Pd NPs in Pd@Eu-MOF. | |
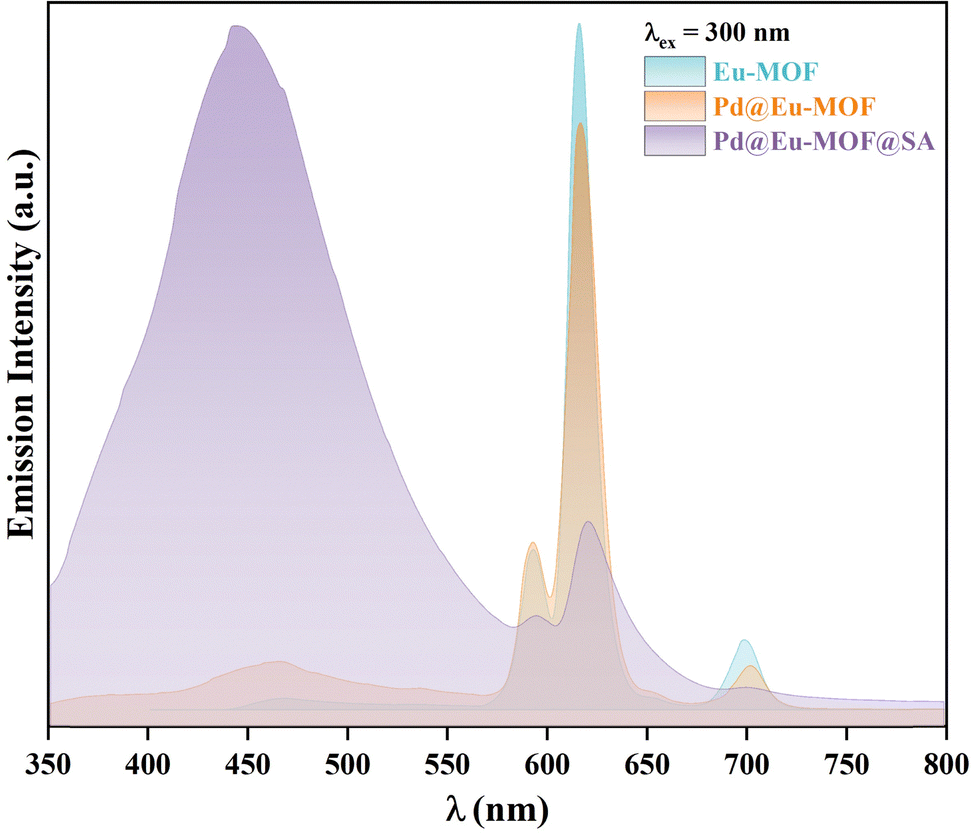
Emission spectra of Eu-MOF, Pd@Eu-MOF, and Pd@Eu-MOF@SA.
Solid H2NBDC shows a blue emission at 473 nm when excited at 368 nm, and solid H2TIPA also emits a blue emission at 445 nm under the 368-nm excitation at room temperature (Fig. S6a, ESI†). Under excitation at 300 nm (Fig. S6b, ESI†), solid Eu-MOF emits red emissions at 594, 618, 652 and 703 nm contributed by the characteristic 5D0 → 7Fj (j = 1–4) transfers of Eu(III),27–29 and emission at 450 nm assigned to intraligand charge transfer (ILCT) of the TIPA2− ligand. Pd@Eu-MOF emits the same emissions as Eu-MOF, showing that the loading of Pd NPs has no influence on the luminescence properties of Eu-MOF. However, Pd@Eu-MOF@SA shows different emissions at 450 and 618 nm; the emission at 618 nm is greatly quenched, but the emission at 450 nm is obviously enhanced. This suggests that the interactions between the SA gel and Eu-MOF are responsible for this difference (Fig. 3). Because the difference possibly arises from the H2O component in the SA gel, the influence of H2O on the emission of Eu-MOF was investigated. For this, Eu-MOF, Pd@Eu-MOF, and Pd@Eu-MOF@SA were dispersed in H2O, and their emission spectra were characterized (Fig. S7, ESI†). Compared to solid Eu-MOF, the suspensions of Eu-MOF and Pd@Eu-MOF show similar emissions to that of solid Pd@Eu-MOF@SA: the 5D0 → 7Fj emissions are quenched; H2O quenches 99.5% of the emission intensity at 618 nm (I618), but sensitizes the strong blue emission at 450 nm. In the Pd@Eu-MOF@SA suspension, the weak emission at 618 nm is nearly completely quenched. Based on comparison to the emission of the SA gel at 450 nm under an excitation wavelength of 370 nm (Fig. S8, ESI†), the strong emission at 450 nm in Pd@Eu-MOF@SA possibly comes from SA due to its role as the matrix. Therefore, comparison of the emissions of Pd@Eu-MOF@SA with those of the Eu-MOF and Pd@Eu-MOF suspensions (Fig. 3 and Fig. S8, ESI†) suggests that the common component of H2O in them is responsible for the quenching at 618 nm. The quenching mechanism by H2O was attributed to electron transfer between the excited TIPA2− ligand and H2O. It is proposed that the hydrogen bonding between the chromophore of the TIPA2− ligand and the solvent H2O blocks the energy transfer path from the TIPA2− ligand to Eu(III), thus resulting in a breaking in the excited state.30
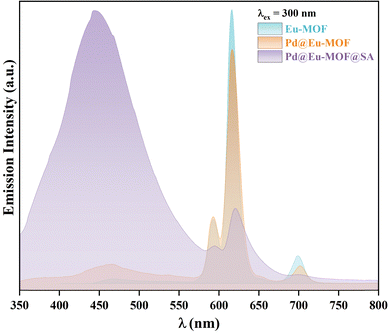 |
| | Fig. 3 Solid emission spectra of solid Eu-MOF, Pd@Eu-MOF, and Pd@Eu-MOF@SA recorded at room temperature. | |
The influence of organic solvents on the emission of Eu-MOF was investigated (Fig. S9, ESI†). The characteristic emission at 618 nm is quenched by all the organic solvents to some degree, except for MeOH. Only MeOH does not quench the emission at 618 nm, instead increasing I618 about 1.4 times. Therefore, MeOH was selected as the solvent for sensing p-NP using Eu-MOF.
Evaluation of Eu-MOF in sensing p-NP
The detection performance of Eu-MOF for sensing p-NP was estimated using sensitivity and selectivity tests. The obtained parameters of LOD, the Stern–Volmer (SV) quenching rate constant KSV and the quenching rate constant Kq were calculated and compared to those of reported MOF-based p-NP sensors.
Selectivity.
10 μL of 0.1 M p-NP and the control compounds of hydroquinone, m-dihydroxybenzene, pyrocatechol, m-dinitrobenzene, and p-nitrobenzoic acid were dropped into 1 mL of 0.5 mg mL−1 Eu-MOF, respectively. The emission spectra of Eu-MOF/p-NP or Eu-MOF/control compound were characterized under excitation at 300 nm (Fig. S10, ESI†). Only p-NP quenches 98.5% of I618 in Eu-MOF; others retain an I618 of more than 72%. Therefore, p-NP exhibits a much better fluorescence quenching effect on Eu-MOF than the other control compounds.
To 1 mL of 0.5 mg mL−1 Eu-MOF was added 10 μL of 0.1 M p-NP or interferents, including MeOH solutions of Na+, K+, Mg2+, Ca2+, Fe3+, Mn2+, Cl−, and SO42−. Blank Eu-MOF and the interferent groups showed the same fluorescence features of the 5D0 → 7Fj transfers of Eu(III) (Fig. S11a, ESI†). Na+, K+, Cl−, and Mg2+ show I618 retention of beyond 98% compared to blank Eu-MOF; Ca2+, Fe3+, and Mn2+ show I618 retention beyond 80%; SO42− retains 62.86% of I618; notably, p-NP quenches 94.87% of I618 (Fig. S11b, ESI†). In general, the interferents cannot exhibit the same degree of fluorescence quenching as p-NP, indicating that Eu-MOF shows high anti-interference.
Sensitivity.
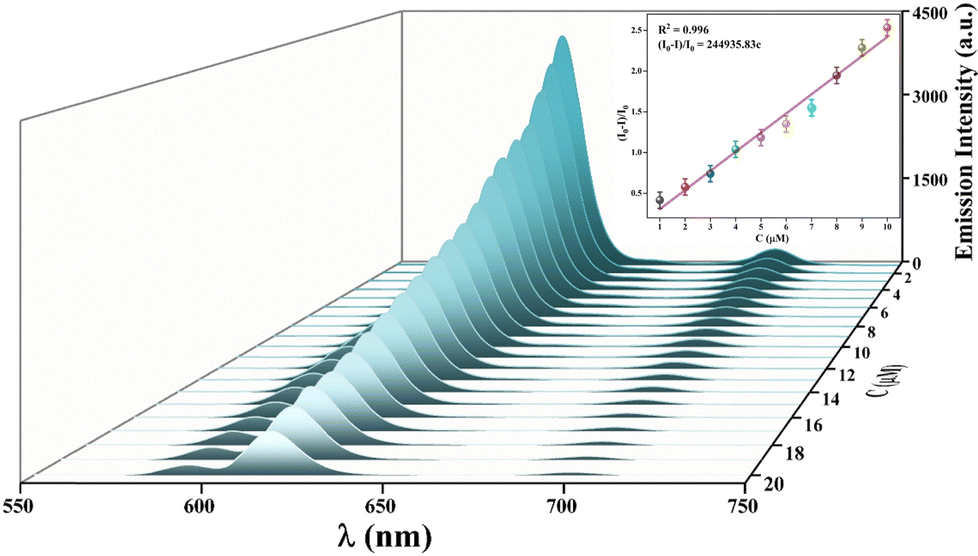
To 1 mL of 0.5 mg mL−1 Eu-MOF MeOH suspension, 10 μL of 0.1 mM p-NP was added 20 times to give Cp-NP values of 0–20 μM with a step of 1 μM. The emission spectra of Eu-MOF with each addition of p-NP were characterized. A trend was found in their emission spectra, with I618 decreasing with increasing Cp-NP. The plot of I0/I vs. Cp-NP shows a climbing line of I0/I with Cp-NP (Fig. S12, ESI†). At Cp-NP = 20 μM, the fluorescence quenching rate (It/I0) reaches 90.5%. The linear fitting of (I0 − I)/I vs. Cp-NP gives a SV equation of (I0 − I)/I = 2.45 × 10⁵Cp-NP at Cp-NP = 1–10 μM with a correlation coefficient R2 = 0.996 (the inset in Fig. 4). With the obtained slope KSV = 2.45 × 10⁵ M−1, LOD is calculated to be 80.1 nM using the formula of LOD = 3σ/k, where 3 is the signal-to-noise ratio, the standard deviation (σ = 0.00654) is obtained from ten measurements for blank Eu-MOF, and k is KSV (2.45 × 10⁵ M−1). Based on the SV equation (I0 − I)/I = KSV·Cp-NP = Kqτ0·Cp-NP, Kq is calculated to be 5.9 × 10⁸ M−1 S−1 with FLT τ0 = 415 μs of Eu3+ in blank Eu-MOF (Fig. S13, ESI†). The fluorescence quenching of Eu-MOF by p-NP is a dynamic process supported by a Kq of less than 2 × 10¹⁰. Eu-MOF, with LOD = 80.1 nM, is more sensitive than most of the reported MOF-based sensors in Table 1, but its LOD is higher than those of {[Eu(HL)]·3DMF·3H2O}n (0.011 μM) and [Cd3(TDPAT)(H2O)6(μ-H2O)3]·4H2O·2DMF (0.0156 μM). The KSV of 2.45 × 10⁵ M−1 is also larger than those of most of the reported sensors, supporting the rapid fluorescence quenching of Eu-MOF by p-NP (Fig. 5).
 |
| | Fig. 4 Emission spectra of Eu-MOF after sequential dropping of 10 μL of 0.1 mM p-NP, with the plot of I0/I vs. Cp-NP in the inset. | |
Table 1
K
SV and LODs of Eu-MOF and other reported MOF-based sensors
| Sensor |
K
SV (M−1) |
LOD (μM) |
Ref. |
| Note: Cu-SM MOF = Cu(5-SMIPA)·(Me2NH2) [SMIPA: 5-(sulfomethyl) isophthalic acid]; [Zn2(H4L)·DMF·H2O]n: H4L = 2,1′,5,5′-diphenyl ether tetracarboxylic acid; {[Eu(HL)]·3DMF·3H2O}n: HL = 1,4-bis(2′,2′′,6′,6′′-tetracarboxy-1,4′:4,4′′-pyridyl)benzene; {(CH3)2NH2)2[Cd(μ4-PPTA)]·DMF·7H2O}n: H4PPTA = 4,4′,4′′,4′′′-(1,4-phenylenbis (pyridine-4,2,6-triyl))tetrabenzoic acid; [Tb2(PIA)3(DMF)3(CH)]: H2PIA = 5-(1H-pyrazol-3-yl)isophthalic acid; {[NH2(CH3)2]2[Cd(μ4-TDBAT)]·3H2O·DMF}n: TDBAT = 5,5′-((thiophene-2,5-dicarbonyl)-bis(azanediyl))diisophthalate; [Cd(L)(phen)2]·5H2O: H2L = 1,4-bis(1-carboxymethylene-4-imidazolyl)benzene; [Cd3(TDPAT)(H2O)6 (μ-H2O)3]·4H2O·2DMF: H6TDPAT = 5,5′,5′′-(1,3,5-triazine-2,4,6-triyltriimino)tris(azanediyl) trisophthalate; [Tb(TATAB)(H2O)]·2H2O: H3TATAB = 4,4′,4′-s-triazine-1,3,5-triyltri-m-aminobenzoic acid; {[Eu2(L)2(H2O)2]·5H2O·6DMAC}n: H3L = 4,4′-(((5-carboxy-1,3-phenylene) bis(azanediyl))bis(carbonyl))dibenzoic acid, DMAC = N,N′-dimethylacetamide. |
| Eu-MOF |
2.45 × 10⁵ |
0.081 |
This work |
| Cu-SM MOF |
— |
1.62 |
31
|
| [Zn2(H4L)·DMF·H2O]n |
7.993 × 10³ |
0.28 |
32
|
| {[Eu(HL)]·3DMF·3H2O}n |
5.91 × 10⁵ |
0.011 |
33
|
| {(CH3)2NH2)2[Cd(μ4-PPTA)]·DMF·7H2O}n |
3.4 × 10⁴ |
6.84 |
34
|
| [Tb2(PIA)3(DMF)3(CH3OH)] |
1.89 × 10⁴ |
1.01 |
35
|
| {[NH2(CH3)2]2[Cd(μ4-TDBAT)]·3H2O·DMF}n |
1.20 × 10⁴ |
58.5 |
36
|
| [Cd(L)(phen)2]·5H2O |
6.2 × 10⁵ |
0.115 |
37
|
| [Cd3(TDPAT)(H2O)6(μ-H2O)3]·4H2O·2DMF |
8.30 × 10⁵ |
0.0156 |
38
|
| [Tb(TATAB)(H2O)]·2H2O |
5.58 × 10⁴ |
0.0496 |
39
|
| {[Eu2(L)2(H2O)2]·5H2O·6DMAC}n |
5.35 × 10³ |
76 |
40
|
 |
| | Fig. 5 Plot of KSVvs. LOD values of Eu-MOF compared to those of other reported MOF-based sensors. | |
The fluorescence quenching pathways include photoinduced electron transfer, Förster resonance energy transfer, excited-state reactions, IFE, static quenching, and dynamic quenching.41 Among them, if the excitation band and/or the emission band of a fluorescent sensor overlap with the absorption band of the analyst, it suggests an inner filter effect (IFE) process.42 Herein, the UV-vis spectrum was used to reveal the detection mechanism (Fig. S14, ESI†). The UV-vis absorption band of p-NP covers 250–430 nm, which basically coincides with the 250–440 nm band of Eu-MOF. p-NP also fully overlaps the 266–322 nm band of free H2TIPA and partly overlaps the 290–487 nm band of free H2NBDC. Also, Eu-MOF is excited at 300 nm and exhibits strong blue emission at 450 nm. The absorption band of p-NP overlaps very well with the excitation of Eu-MOF, but basically avoids the emission band of Eu-MOF. This supports that the fluorescence quenching of Eu-MOF sensing p-NP occurs through an IFE mechanism.43
Adsorption kinetics of Eu-MOF and Pd@Eu-MOF@SA
The kinetics behaviors of Eu-MOF and Pd@Eu-MOF@SA in the adsorption of p-NP were explored to reveal the adsorption mechanism. The absorption peak at 400 nm of p-NP was used as the reference point. The Cp-NP in the filtrate is calculated according to the Beer–Lambert law (eqn 1); the adsorption capacity qt (mg g−1) and the removal efficiency P(%) are calculated using eqn (2) and (3), respectively.| | | P (%) = (C0 − Ct)/C0 × 100% | (3) |
where Ct (mg L−1) is Cp-NP of the filtrate at t min, C0 (mg L−1) is the initial Cp-NP (100 mg L−1), At is the absorbance of the filtrate at t min, A0 is the absorbance of the initial p-NP solution, V (L) is the total volume of p-NP, and M (mg) is the amount of adsorbent.
The adsorption kinetics of p-NP by Eu-MOF or Pd@Eu-MOF@SA were analyzed according to the pseudo-first-order and pseudo-second-order kinetic models using eqn (4) and (5), respectively.
| | ln(qe − qt) = ln![[thin space (1/6-em)]](https://www.rsc.org/images/entities/char_2009.gif) qe − k1t qe − k1t | (4) |
where
qt and
qe (mg g
−1) represent the adsorption capacities of Eu-MOF toward
p-NP at
t min and equilibrium status, respectively.
k1 and
k2 (min
−1) are the equilibrium rate constants of the pseudo-first-order and the pseudo-second-order kinetic models, respectively.
Eqn (6) and (7) were used to investigate the adsorption isotherm behaviors according to the Langmuir and Freundlich adsorption models.
| | | Ce/qe = 1/qmaxKL + Ce/qmax | (6) |
where
Ce (mg L
−1) is the equilibrium
Cp-NP,
qe (mg g
−1) is the equilibrium adsorption capacity of Eu-MOF or Pd@Eu-MOF@SA,
qmax (mg g
−1) is the theoretical maximum adsorption capacity,
KL (L mg
−1) is the constant of the Langmuir model, and
KF and
n represent the Freundlich constants.
The UV-vis spectra of the filtrates after Eu-MOF or Pd@Eu-MOF@SA had adsorbed p-NP for 0–60 min are depicted in Fig. S15a and b (ESI†). The absorbances of Eu-MOF and Pd@Eu-MOF@SA both decrease with time until around 20 min, after which the absorbances float with small changes from 20 to 60 min. The absorbances at 400 nm were used to calculate the qt values of Eu-MOF and Pd@Eu-MOF@SA. The fittings of qt–t using the pseudo-first-order (Fig. 6) and the pseudo-second-order kinetic models (Fig. S16, ESI†) were conducted to investigate their adsorption behaviors of Eu-MOF and Pd@Eu-MOF@SA in the adsorption of p-NP. Herein, their qt values increase very rapidly from 4 to 20 min, reach a maximum qt at 30 min, then float at 30–60 min, reaching equilibrium at 40 min. Commonly, first-order-adsorption kinetics refers to a process in which the adsorption rate of a adsorbate on the solid surface of a adsorbent is proportional to the adsorbate concentration; a weak interaction, such as physical adsorption, is usually formed between the adsorbate and the solid surface of the adsorbent. Second-order-adsorption kinetics means that the adsorption rate of an adsorbate on the solid surface of an adsorbent is proportional to the square of the adsorbate concentration. A strong interaction, such as chemical adsorption, is usually formed between the adsorbate and the solid surface of the adsorbent.44 The fitting of qt–t for Eu-MOF using the pseudo-first-order model gives a fitting equation of qt = 87.83(1 − exp−0.10t). The high consistency with R2 = 0.996 proves that the adsorption of Eu-MOF by p-NP is a physical adsorption. The large deviation with R2 = 0.984 for the pseudo-second-order model excludes chemical adsorption between Eu-MOF and p-NP. Similarly, the pseudo-first-order model gives a fitting equation of qt = 224.51(1 − exp−0.15t) with R2 = 0.991 for the adsorption of p-NP using Pd@Eu-MOF@SA. The experimental maximum Qe,exp = 86.50 mg g−1 is close to the calculated value of Qe,cal = 87.83 mg g−1 for the pseudo-first-order model, but deviates significantly from the Qe,cal of 105.45 mg g−1 for the pseudo-second-order model. This also happens for Pd@Eu-MOF@SA: the experimental Qe,exp = 224.89 mg g−1 is close to the theoretical Qe,cal = 224.51 mg g−1 for the pseudo-first-order model (Table S3, ESI†). Comparing the rate constant (k1) and qt values of Eu-MOF with those of Pd@Eu-MOF@SA, the experimental maximum Qe,exp increases from 87.83 to 224.51 mg g−1, and k1 increases from 0.10 to 0.15 min−1. This supports that Eu-MOF and Pd@Eu-MOF@SA both adsorb p-NP via pseudo-first-order physical adsorption with weak interactions between the adsorbents and p-NP.45 Also, Pd@Eu-MOF@SA has a better adsorption capacity than Eu-MOF due to the porous structure of the SA gel.46,47
 |
| | Fig. 6 Adsorption kinetics curves of qt (mg g−1) vs. adsorption time for Eu-MOF and Pd@Eu-MOF@SA for pseudo-first-order p-NP adsorption. | |
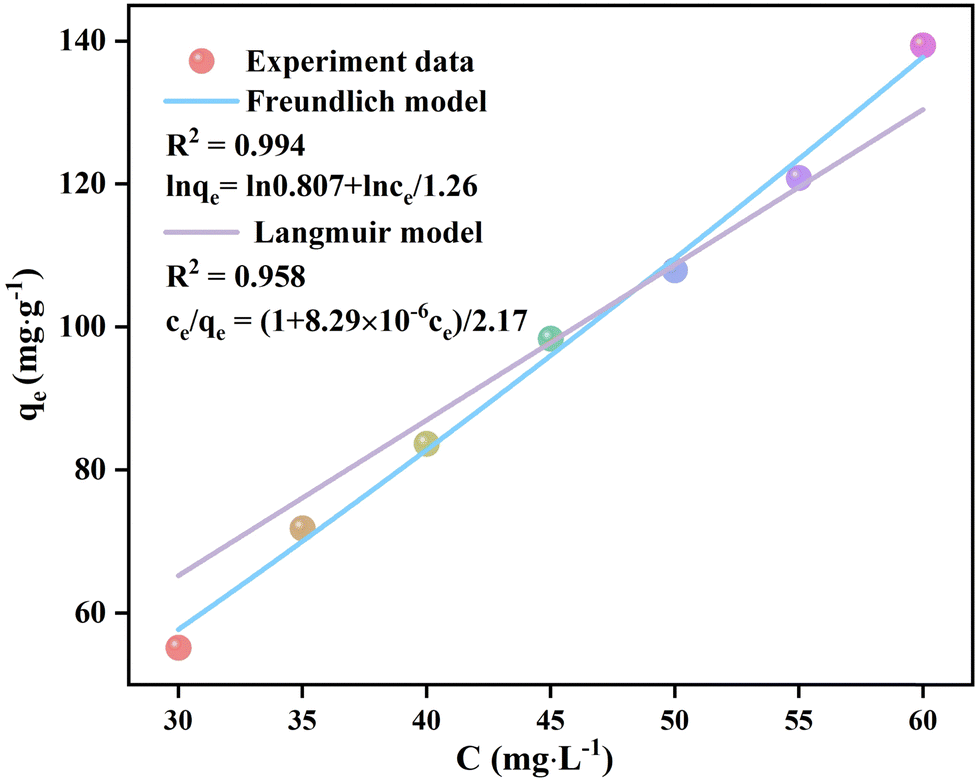
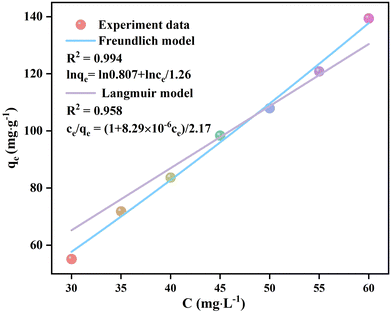
Adsorption isotherms
The UV-vis spectra of the filtrates after the adsorption of p-NP by Eu-MOF with Cp-NP values ranging from 30 to 60 mg L−1 with a step of 5 mg L−1 were obtained (Fig. S17, ESI†). The qe values of Eu-MOF were calculated based on the absorbances at 400 nm as the reference point. The adsorption isotherm curves (qe–Cp-NP) of the Eu-MOF adsorption of p-NP were fitted using the Langmuir and Freundlich models to reveal the adsorption properties of Eu-MOF toward p-NP (Fig. 7). The Langmuir and Freundlich models are two models commonly used to explain adsorption behaviors.48 The Langmuir model describes the adsorption of gas or liquid molecules on a solid surface with the assumption that the adsorption is monolayer adsorption without interactions between adsorption sites, while the Freundlich model describes multi-layer or heterogeneous adsorptions, assuming the existence of strong interactions between adsorption sites. When the adsorption behaviors of Eu-MOF were fitted using the Langmuir model, the linear fitting gave a fitting equation of ce/qe = (1 + 8.29 × 10⁻⁶ce)/2.17 with R2 = 0.958. This large deviation indicates that the adsorption of p-NP by Eu-MOF is not in agreement with the Langmuir model. The linear fitting of the adsorption isotherm using the Freundlich model gives an equation of lnqe = ln0.807 + lnce/1.26 with R2 = 0.994 and 1/n = 0.8. This indicates that the adsorption of p-NP by Eu-MOF occurs on the uneven surface of Eu-MOF, and that the adsorption is multi-layered adsorption. The qmax parameters and constants K of the Langmuir (KL) and Freundlich (KF) models for the adsorption of p-NP by Eu-MOF are listed in Table S4 (ESI†), supporting the assignment of the Freundlich model.49
 |
| | Fig. 7 Adsorption isotherm qe–Cp-NP curves of the adsorption of p-NP by Eu-MOF fitted by the Freundlich and Langmuir models. | |
Catalytic reduction of p-NP by Pd@Eu-MOF
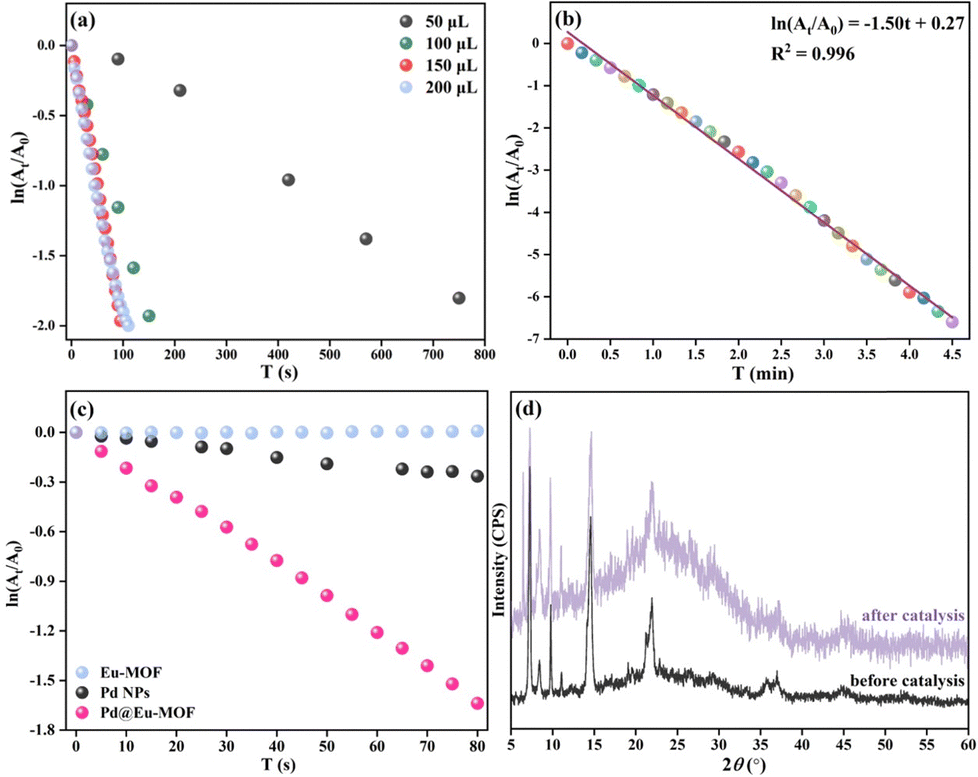
The process of the catalytic reduction of p-NP by Pd@Eu-MOF was monitored via UV-vis spectroscopy (Fig. 8). The influence of the Pd@Eu-MOF dosage (mMOF) on the catalytic reduction reaction rate was explored. The relationship of ln(At/A0) vs. t reveals that the reaction rate of 1.5 mg mL−1 Pd@Eu-MOF increases with mMOF from 50 μL to 150 μL (corresponding to 0.225 mg Pd@Eu-MOF), then remains stable at 200 μL (Fig. 8a). From the plot of ln(At/A0)–t, mMOF was optimized as 0.225 mg. The percentage reduction of p-NP by Pd@Eu-MOF reaches 99.72% in 4 min. The linear fitting of ln(At/A0) vs. t gives a fitting equation of ln(At/A0) = –1.50 T + 0.27 with R2 = 0.996, whose apparent rate constant K is 1.50 min−1 (Fig. 8b). The time-resolved UV-vis spectrum of Pd@Eu-MOF was measured and compared with those of equal amounts of Eu-MOF and Pd NPs (Fig. 8c). Three groups of 3 mL of 100 mM p-NP solution and 9 mg NaBH4 were mixed with 150 μL of 1.5 mg mL−1 Pd@Eu-MOF, Eu-MOF and Pd NPs suspensions, respectively. As time proceeded, the ln(At/A0)–t curve of Eu-MOF was almost horizontal, showing that Eu-MOF does not show any catalytic reduction activity toward p-NP, as expected. Meanwhile, the slightly decreased ln(At/A0)–t curve of Pd NPs alone indicates their poor catalytic reduction activity toward p-NP. Comparatively, the catalytic reduction capacity of Pd@Eu-MOF is much better than that of the Pd NPs. The ordered arrangement of the Pd NPs adsorbed on the surface of Eu-MOF can greatly improve the catalytic activity of the Pd NPs on Eu-MOF. Many more active sites of Pd NPs are exposed in Pd@Eu-MOF, thus increasing the specific surface area of Pd NPs exposed to p-NP.50
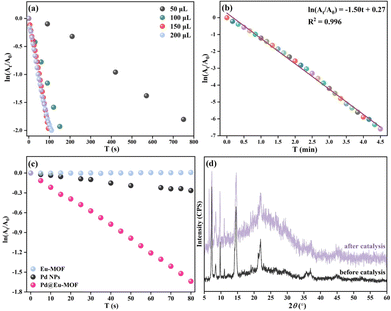 |
| | Fig. 8 (a) Relationship of ln(At/A0) vs. t for 1.5 mg mL−1 Pd@Eu-MOF dosages ranging from 50 to 200 μL; (b) plot and linear fitting of ln(At/A0) vs. t for 150 μL of 1.5 mg mL−1 Pd@Eu-MOF over t = 0–4.5 min; (c) plot of ln(At/A0) vs. t for 150 μL of 1.5 mg mL−1 Pd@Eu-MOF, Eu-MOF, and Pd NPs; (d) PXRD patterns of Pd@Eu-MOF before and after the catalytic reduction reaction. | |
The structural stability of Pd@Eu-MOF was checked after the catalytic reduction reaction. Pd@Eu-MOF shows a new diffraction at 2θ = 6.45°. The newly emerged PXRD peak means the structure of Pd@Eu-MOF starts to transform (Fig. 8d). However, the other diffraction peaks are as the same as those of Pd@Eu-MOF before the catalytic reduction reaction. The structural stability of Pd@Eu-MOF is consistent with the role of the catalyst. Also, the PXRD change suggests that the skeleton of Eu-MOF basically retains stable, and the crystallinity of Pd@Eu-MOF is decreased with higher background noise.
Synchronicity between absorbance and emission
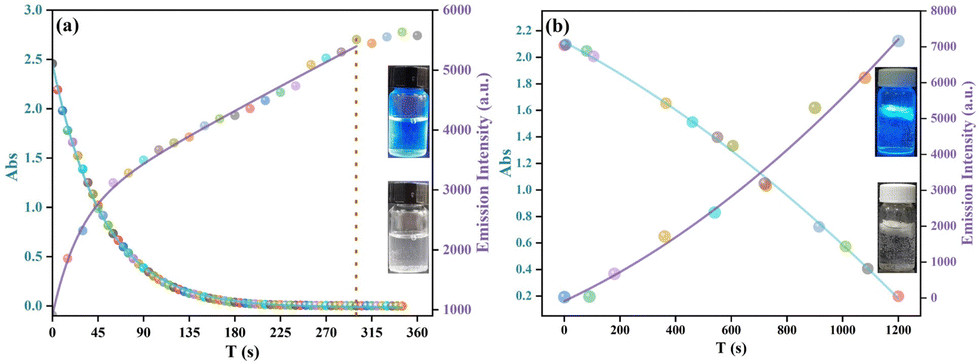
The emission changes in the processes of the reduction of p-NP by Pd@Eu-MOF and Pd@Eu-MOF@SA were investigated using time-dependent emission spectroscopy. The emission at 450 nm of the Pd@Eu-MOF and Pd@Eu-MOF@SA suspensions was gradually recovered during the catalytic reduction process within 0–345 s or 0–1200 s respectively, showing that the fluorescence quenching was weakened (Fig. S18a and b, ESI†). Small shifts toward lower wavelength are observed as time proceeds, appearing as Pd@Eu-MOF or Pd@Eu-MOF@SA reduce p-NP. The absorbance of the mixture of p-NP and NaBH4 and the emission intensity at 450 nm (I450) both correlate with Cp-NP. As the reduction reaction proceeds, Cp-NP decreases with time. Therefore, the absorbances of the mixture of p-NP and NaBH4 decrease accordingly, and thereby I450 increases as the fluorescence quenching wears off. The changes in the absorbances and I450 occur synchronously in the catalytic processes of the reduction of p-NP by Pd@Eu-MOF or Pd@Eu-MOF@SA, exhibiting synchronicity with the decreasing Cp-NP (Fig. 9a and b). With the different dispersion ways, the Pd@Eu-MOF suspension shows a much quicker reduction rate because of the direct contact with p-NP; while Pd@Eu-MOF@SA has a slower but very stable reduction rate due to the floating gel state leading to slow adsorption toward p-NP (the inset in Fig. 9b).
 |
| | Fig. 9 Plot of the absorbance and I450 of Pd@Eu-MOF (a) and Pd@Eu-MOF@SA (b) depending on time. | |
Durability of Pd@Eu-MOF@SA
The synchronicity between the absorbance and I450 of Pd@Eu-MOF@SA was tested over three cycles (Fig. S19, ESI†). At the beginning of each cycle, the absorbance of the filtrate is around 2.2 and I450 is close to 0. As time proceeds, p-NP is reduced by NaBH4, and the decreased Cp-NP results in the decreased absorbance in each cycle. At the end of each cycle, I450 is fully recovered to around 7200 a.u. The absorbances and I450 values in the three cycles are similar. The stable absorbances and emission intensities indicate that Pd@Eu-MOF@SA is sensitive to p-NP and exhibits high durability during the three cycles.
0.01 g Pd@Eu-MOF@SA was dispersed into 10 mL of 0.4 g L−1p-NP for 1 h, and the absorbance was then measured via UV-vis spectroscopy (Fig. S20a, ESI†). The desorption was carried out by immersing Pd@Eu-MOF@SA in MeOH for 12 h. The adsorption–desorption process was repeated eight times. Pd@Eu-MOF@SA retained basically the same adsorption capabilities over the eight cycles, with the adsorption capability in the 8th cycle being 90% of that in the 1st one (Fig. S20b, ESI†). This suggests Pd@Eu-MOF@SA can retain high durability over eight adsorption–desorption cycles.
Application to monitoring the reduction process of p-NP
Pd@Eu-MOF@SA was made into a stopper and placed in the lower opening of a separatory funnel (Fig. 10). 10 mL of 0.2 g L−1p-NP was passed through the Pd@Eu-MOF@SA stopper and the adsorption was completed in 1 min. The color of the separation solution changes from yellow to colorless, showing fast and thorough adsorption of p-NP by Pd@Eu-MOF@SA. 0.01 g of Pd@Eu-MOF@SA was floated in 2 mL of 0.2 M p-NP solution for 120 min to adsorb p-NP (Fig. 11). The emission color of Pd@Eu-MOF@SA changed from bright blue to dark after adsorbing p-NP to quench the emission. The quenched Pd@Eu-MOF@SA was immersed in MeOH for 12 h. The blue emission color was recovered, indicating the desorption p-NP from Pd@Eu-MOF@SA. Additionally, when 2 mL of 0.1 M NaBH4 was added to the quenched Pd@Eu-MOF@SA, the bright blue emission was recovered after 4 h. This suggests that NaBH4 can reduce p-NP on the surface of Pd@Eu-MOF@SA and recover the blue emission. The recovered blue emission indicates the end of the catalytic reduction reaction between NaBH4 and p-NP.
 |
| | Fig. 10 Pictures of p-NP filtrated through a Pd@Eu-MOF@SA stopper in a separatory funnel. | |
 |
| | Fig. 11 Catalytic reduction process monitored by Pd@Eu-MOF@SA. | |
Conclusions
In summary, we synthesized Eu-MOF and its composites Pd@Eu-MOF and Pd@Eu-MOF@SA. The presented Eu-MOF can act as a fluorescence “turn-off” sensor for facile and sensitive p-NP detection. Eu-MOF exhibits outstanding detection performance, with a linear fitting equation of (I0 − I)/I = 2.45 × 10⁵Cp-NP at Cp-NP = 1–10 μM with LOD = 80.1 nM. The low LOD of 80.1 nM is better than or comparable to those of most MOF-based p-NP sensors. Analysis using the SV equation shows the fluorescence quenching of Eu-MOF by p-NP is a dynamic process with Kq = 5.9 × 10⁸ M−1 S−1. The absorption band of p-NP at 250–430 nm overlaps with the excitation band of Eu-MOF at 300 nm, supporting that the fluorescence quenching of Eu-MOF sensing p-NP is an IFE mechanism. The kinetic behaviours of the absorption of p-NP by Eu-MOF and Pd@Eu-MOF@SA both follow the pseudo-first-order model, and their adsorption isotherms abide by the Freundlich model. The catalytic reduction of p-NP by Pd@Eu-MOF gives a fitting equation of ln(At/A0) = −1.50 T + 0.27. Correlating with Cp-NP, synchronicity in the decrease in absorbance and increase in I450 occurs in the catalytic processes of the reduction of p-NP by NaBH4 monitored by Pd@Eu-MOF and Pd@Eu-MOF@SA. This synchronicity is retained well over eight adsorption–desorption cycles. Pd@Eu-MOF@SA was applied as an indicator to monitor the catalytic reduction of p-NP by NaBH4 and showed obvious emission change. Our work provides a valuable method for visual p-NP detection, which is relevant for environmental detection.
Author contributions
The manuscript was written through contributions of all authors. All authors have given approval to the final version of the manuscript.
Data availability
All relevant data are within the manuscript and its ESI.†
Conflicts of interest
There are no conflicts to declare.
Acknowledgements
The project was sponsored by the National Key Research and Development Program of China (2022YFA1205501), the National Natural Science Foundation of China (22271180), and the Youth Innovation Team of Shaanxi Universities (2023).
Notes and references
- P. Venugopalan and N. Vidya, J. Photochem. Photobiol., A, 2023, 439, 114625 CrossRef CAS.
- Y. Y. Li, H. Y. Li, X. M. Wang, Z. C. Zhang, H. T. Li, J. X. Xie, H. Y. Ma, Y. Y. Han and L. Y. Wang, Phys. Lett. A, 2023, 490, 129175 CrossRef CAS.
- Q. Zhang, R. J. Somerville, L. Chen, Y. Yu, Z. Fei, S. Wang, P. J. Dyson and D. Min, J. Hazard. Mater., 2023, 443, 130270 CrossRef CAS PubMed.
- T. M. Nguyen, S. Jeong, S. K. Kang, S. W. Han, T. M. T. Nguyen, S. Lee, Y. J. Jung, Y. H. Kim, S. Park, G. H. Bak, E. J. Ko, H. Y. Kim and J. W. Oh, ACS Sens., 2024, 9, 699–707 CrossRef CAS PubMed.
- Y. Li, X. Tian, J. Zhang, L. P. Qiu, X. Wang, S. Y. Wu, Y. Zhang, M. C. Zhu and E. J. Cao, Appl. Organomet. Chem., 2021, 35, e6414 CrossRef CAS.
- L. Han, J. Kaesler, C. Peng, T. Reemtsma and O. J. Lechtenfeld, Anal. Chem., 2021, 93, 1740–1748 CrossRef CAS PubMed.
- P. B. Marta, J. S. L. María, C. Natalia, V. Pilar and H. C. Manuel, Talanta, 2018, 189, 543–549 CrossRef PubMed.
- C. Hu, P. Pan, H. P. Huang and H. T. Liu, Biosensors, 2022, 12, 813 CrossRef CAS PubMed.
- J. Gupta and D. S. S. KandkuriRattan, J. Mater. Sci., 2024, 59, 3689–3710 CrossRef CAS.
- P. Z. Crocomo, J. P. Winiarski, M. R. Barros, E. Latocheski, G. R. Nagurniak, R. L. T. Parreira, D. A. Siebert, G. A. Micke, H. A. Magosso and C. L. Jost, Electroanalysis, 2019, 31, 2319–2329 CrossRef CAS.
- T. Fujiwara, A. Hattori, T. Ito, T. Funatsu and M. Tsunoda, Anal. Methods, 2020, 12, 2555–2559 RSC.
- Y. Zuy, S. O. Sweck, C. R. Dockery and G. E. Potts, Anal. Methods, 2020, 12, 85–90 RSC.
- L. Duffin, X. Wang and J. Stoesz, Energy Fuels, 2017, 31, 11925–11931 CrossRef CAS.
- A. Caligiani, M. Nocetti, V. Lolli, A. Marseglia and G. Palla, J. Agric. Food Chem., 2016, 64, 4158–4164 CrossRef CAS PubMed.
- Q. Shuai, L. Zhang, P. Li, Q. Zhang, X. Wang, X. Ding and W. Zhang, Anal. Methods, 2014, 6, 9575–9580 RSC.
- D. Moreno-González, L. Gámiz-Gracia, A. M. García-Campaña and J. M. Bosque-Sendra, Anal. Bioanal. Chem., 2011, 400, 1329–1338 CrossRef PubMed.
- H. L. Sun, Y. T. Lv, J. B. Zhang, C. Y. Zhou and X. G. Su, Anal. Chim. Acta, 2023, 1252, 341010 CrossRef CAS PubMed.
- L. Z. Cai, Z. Z. Yao, S. J. Lin, M. S. Wang and G. C. Guo, Angew. Chem., Int. Ed., 2021, 60, 18223–18230 CrossRef CAS PubMed.
- L. Liu, Q. Liu, R. Li, M. S. Wang and G. C. Guo, J. Am. Chem. Soc., 2021, 143, 2232–2238 CrossRef CAS PubMed.
- S. S. Shafqat, M. Rizwan, M. Batool, S. R. Shafqat, G. Mustafa, T. Rasheed and M. N. Zafar, Chemosphere, 2023, 318, 137920 CrossRef CAS PubMed.
- S. Sahoo, S. Mondal and D. Sarma, Coord. Chem. Rev., 2022, 470, 214707 CrossRef CAS.
- J. Zhou, H. Li, H. Zhang, W. Li and P. Cheng, Adv. Mater., 2015, 27, 7072–7077 CrossRef CAS PubMed.
- F. Gabriel, A. Roussey, S. S. Nobre and A. Carella, J. Mater. Chem. C, 2024, 12, 11378–11385 RSC.
- S. Yang, X. Y. Li, Y. F. Liao, Y. B. Ji and R. J. Li, Chemosphere, 2024, 359, 142297 CrossRef CAS PubMed.
- J. W. Jiang, Y. T. Huang, Y. S. Jiang, Y. Fan, J. N. Xu and L. Wang, Inorg. Chim. Acta, 2024, 569, 122103 CrossRef CAS.
- S. Y. Li, X. Z. Gao, L. C. Nie, L. T. Bu, G. Y. Dong, D. H. Song, W. J. Liu, D. J. Meng, X. D. Geng and Q. X. Zhou, Talanta, 2024, 272, 125749 CrossRef CAS PubMed.
- W. N. Miao, B. Liu, H. Li, S. J. Zheng, H. Jiao and L. Xu, Inorg. Chem., 2022, 61, 14322–14332 CrossRef CAS PubMed.
- X. L. Yu, A. A. Ryadun, D. I. Pavlov, T. Y. Guselnikova, A. S. Potapov and V. P. Fedin, Angew. Chem., Int. Ed., 2023, 62, e202306680 CrossRef CAS PubMed.
- X. B. Chen, C. X. Qi, Y. B. Xu, H. Li, L. Xu and B. Liu, J. Mater. Chem. C, 2020, 8, 17325–17335 RSC.
- G. E. Dobretsov, T. I. Syrejschikova and N. V. Smolina, Biophysics, 2014, 59, 183–188 CrossRef CAS.
- B. Wang, P. Liu, Y. Hu, H. Zhao, L. Zheng and Q. Cao, Dalton Trans., 2023, 52, 2309–2316 RSC.
- J. Li, Y. Liang, S. Wu, Y. Zhang, M. Zhu and E. Gao, Inorg. Chem. Commun., 2022, 143, 109724 CrossRef CAS.
- Z. G. Lin, F. Q. Song, H. Wang, X. Q. Song, X. X. Yu and W. S. Liu, Dalton Trans., 2021, 50, 1874–1886 RSC.
- E. Kavak, M. Şevik and M. Arici, J. Photochem. Photobiol., A, 2023, 445, 115032 CrossRef CAS.
- Q. Hu, T. Xu, J. Gu, L. Zhang and Y. Liu, CrystEngComm, 2022, 24, 2759–2766 RSC.
- M. Şevik, S. M. Sezdi, E. Kavak, T. A. Arici and M. Arici, Cryst. Growth Des., 2023, 23, 5163–5172 CrossRef.
- S. S. Chen, Z. Y. Zhang, R. B. Liao, Y. Zhao, C. Wang, R. Qiao and Z. D. Liu, Inorg. Chem., 2021, 60, 4945–4956 CrossRef CAS PubMed.
- Y. Xiao, Y. Wang, Z. X. You, Q. L. Guan, Y. H. Xing, F. Y. Bai and L. X. Sun, Cryst. Growth Des., 2022, 22, 6967–6976 CrossRef CAS.
- J. H. Wei, J. W. Yi, M. L. Han, B. Li, S. Liu, Y. P. Wu, L. F. Ma and D. S. Li, Chem. - Asian J., 2019, 14, 3694–3701 CrossRef CAS PubMed.
- J. J. Ma and W. S. Liu, Dalton Trans., 2019, 48, 12287–12295 RSC.
- F. Zu, F. Yan, Z. Bai, J. Xu, Y. Wang, Y. Huang and X. Zhou, Microchim. Acta, 2017, 184, 1899–1914 CrossRef CAS.
- K. Sasikumar, R. Rajamanikandan and H. Ju, Carbon Lett., 2024, 34, 851–863 CrossRef CAS.
- S. Yang, X. Y. Li, Y. F. Liao, Y. B. Ji and R. J. Li, Chemosphere, 2024, 359, 142297 CrossRef CAS PubMed.
- J. P. Simonin, Chem. Eng. J., 2016, 300, 254–263 CrossRef CAS.
- J. L. Wang and X. Guo, J. Hazard. Mater., 2020, 390, 122156 CrossRef CAS PubMed.
- N. Zhuo, Y. Q. Lan, W. B. Yang, Z. Yang, X. M. Li, X. Zhou, Y. Liu, J. C. Shen and X. T. Zhang, Sep. Purif. Technol., 2017, 177, 272–280 CrossRef CAS.
- X. P. Gao, C. Guo, J. J. Hao, Z. Zhao, H. M. Long and M. Y. Li, Int. J. Biol. Macromol., 2020, 164, 4423–4434 CrossRef CAS PubMed.
- M. Vigdorowitsch, A. Pchelintsev, L. Tsygankova and E. Tanygina, Appl. Sci., 2012, 111, 8087 Search PubMed.
- S. Kalam, S. A. Abu-Khamsin, M. S. Kamal and S. Patil, ACS Omega, 2021, 6, 32342–32348 CrossRef CAS PubMed.
- Y. C. Chai, W. X. Shang, W. J. Li, G. J. Wu, W. L. Dai, N. J. Guan and L. D. Li, Adv. Sci., 2019, 6, 1900299 CrossRef PubMed.
Footnotes |
| † Electronic supplementary information (ESI) available: The coordination modes of the ligands, the coordination spheres of Eu(III) centres, PXRD patterns of Eu-MOF and those in water and organic solvents, PXRD patterns of Eu-MOF, Pd@Eu-MOF, and Pd@Eu-MOF@SA, XPS spectra of Pd@Eu-MOF, liquid-emission spectra of Eu-MOF, Pd@Eu-MOF, and Pd@Eu-MOF@SA, and Eu-MOF sensing control compounds, the plot of I0/I vs. Cp-NP, fluorescence lifetime, the emission of Eu-MOF with p-NP and the interferents, UV-vis spectra of Eu-MOF/p-NP/ligands, and the filtrates of Eu-MOF and Pd@Eu-MOF@SA adsorbing p-NP depending on time and Cp-NP, the adsorption kinetics curves and the time-dependent emission spectra of Eu-MOF and Pd@Eu-MOF@SA adsorbing p-NP, synchronic plot of absorbance and emission; tables of q and the rate constants. CCDC 2373704. For ESI and crystallographic data in CIF or other electronic format see DOI: https://doi.org/10.1039/d4ma01194e |
| ‡ Equal contribution. |
|
| This journal is © The Royal Society of Chemistry 2025 |
Click here to see how this site uses Cookies. View our privacy policy here. 
 Open Access Article
 This Open Access Article is licensed under a Creative Commons Attribution-Non Commercial 3.0 Unported Licence
 and
Ling
Xu
and
Ling
Xu