
 Open Access Article
 This Open Access Article is licensed under a Creative Commons Attribution-Non Commercial 3.0 Unported Licence
A portable microcontroller-enabled spectroscopy sensor module for the fluorometric detection of Cr(VI) and ascorbic acid, utilizing banana peel-derived carbon quantum dots as versatile nanoprobes†
Aayushi
Kundu
 *ab,
Jobanpreet
Brar
c,
Amit
Mishra
c,
Banibrata
Maity
*b and
Soumen
Basu
*b
*ab,
Jobanpreet
Brar
c,
Amit
Mishra
c,
Banibrata
Maity
*b and
Soumen
Basu
*b
aLaboratory for Multifunctional Materials, Virginia Tech India Research and Education Forum, 7th Floor, Block B, Indian Institute of Technology Madras Research Park, Chennai, TN 600095, India. E-mail: kunduaayushi@gmail.com
bDepartment of Chemistry and Biochemistry, Thapar Institute of Engineering and Technology, Patiala, 147004, India. E-mail: banibrata.maity@thapar.edu; soumen.basu@thapar.edu
cDepartment of Electronics and Communication Engineering, Thapar Institute of Engineering and Technology, Patiala, 147004, India. E-mail: amit_mishra@thapar.edu
First published on 20th December 2024
Abstract
Highly luminescent carbon quantum dots were produced from banana peels (BP-CQDs) using a facile one-step method without the incorporation of chemicals. BP-CQDs were comprehensively characterized using techniques like TEM, FT-IR, XRD, and XPS analyses. The synthesized BP-CQDs exhibited outstanding optical characteristics, displaying a vibrant green color under UV light and a quantum yield of 41%. These properties enabled them to function as effective on–off fluorescent nanoprobes for the precise and sensitive detection of hazardous Cr(VI) concentrations below regulatory limits, leveraging the inner filter effect (IFE) and a static quenching mechanism. The detection limit is calculated to be in the nanomolar range i.e., 60.5 nM. Consequently, the BP-CQDs + Cr(VI) system also acted as a selective off–on sensor for the reductant ascorbic acid (AA) with 86 nM limit of detection. This effect was due to AA's reduction of Cr(VI) to Cr(III) species, which eliminated the IFE and restored the fluorescence of the BP-CQDs. Moreover, efforts have been undertaken to create a low-cost, portable electronic device utilizing spectroscopy sensors to detect heavy metal pollutant concentrations in the test samples. The experimental results affirm the effectiveness of the portable electronic device as a detector for Cr(VI) in test samples. This study sets the groundwork for creating carbon quantum dots (CQDs) with enhanced properties by using banana peels as a biowaste precursor to detect the concentrations of Cr(VI) and AA.
Introduction
Carbon quantum dots (CQDs), distinctive zero-dimensional nanomaterials, have garnered significant attention due to their exceptional fluorescent properties. With an average diameter of less than 10 nm and a spherical shape, CQDs comprise carbon networks arranged by sp2- and sp3-hybridized carbon atoms.1 CQDs find applications across various domains, including sensors, biomedicine, drug delivery, optoelectronics, catalysis, biological imaging, and photocatalysis, attributed to their remarkable photostability, low toxicity, eco-friendly nature, tunable photoluminescence (PL), high water solubility, and excellent biocompatibility.2 Consequently, significant emphasis has been placed on the favourable synthesis of CQDs. A wide range of methods including both top-down approaches (laser ablation, electrochemical oxidation, and arc-discharge), and bottom-up approaches (ultrasonic, microwave, hydrothermal, and solvothermal treatments) can be utilised for the synthesis of CQDs.3 Nonetheless, many of the top-down techniques encounter challenges such as manufacturing complexities, high production costs due to expensive equipment usage, and time-consuming processes.4 In contrast, bottom-up approaches are notable for their simplicity and environmentally friendly attributes. CQDs are typically synthesized using organic compounds or readily available precursors like biomass. Yet, the toxicity and high cost associated with aromatic organic precursors have constrained their extensive utilization.5 This has driven a preference for cost-effective, straightforward, and eco-friendly methods leveraging biomass waste as a precursor. Biomass-derived CQDs often possess diverse heteroatoms, leading to surface groups that confer unique properties without additional passivation or modification.6Banana peels are recognized as one of the most prevalent agricultural wastes, constituting about 40% of the total weight of fresh bananas. The texture of banana peel is rich in porous structures, which are formed by various biopolymers present in plant cell walls, including celluloses, hemicelluloses, pectins, lignins, and proteins.7 The surface of these pores contains hydroxyl and carboxyl groups, which readily bind with metal ions, facilitating the removal of metal ions from solutions.8,9
The inherent N and S functionalities and surface-bound functional groups, such as phenolic, hydroxyl, and carboxyl groups, in the prepared CQDs play a crucial role in the detection of various analytes.
Chromium (Cr) is a heavy metal pollutant that poses significant risks to both human health and the environment. Among its various forms, Cr(VI) has drawn particular attention due to its links to cancer, hereditary gene defects, nasal mucosal irritation, and allergic reactions.10 Consequently, accurate and rapid detection of Cr(VI) at low concentrations in environmental samples, such as drinking water, industrial waste, and chromium-contaminated areas, is critically important. Ascorbic acid (AA), a water-soluble vitamin with antioxidant properties holds significant importance in promoting body growth, supporting metabolism, contributing to anticancer properties, and enhancing immunity.11 A deficiency in ascorbic acid can lead to diseases including cardiovascular disease, cancer, and Parkinson's disease.12 The widespread occurrence of ascorbic acid in food, cosmetics products, and pharmaceutical compounds has led to increased interest in its routine analysis.
Various analytical techniques, such as electrochemical studies,13,14 chromatography, atomic absorption spectroscopy, colorimetry,15,16 and high-performance liquid chromatography (HPLC),17etc., have been devised for identifying Cr(VI) and AA. However, these methods involve time-consuming sample preparation, expensive equipment, and the need for skilled operators, posing significant challenges for real-time detection.18 The fluorescence based method is superior to other techniques due to its rapid response, affordability, operational convenience, and high selectivity.19,20 John et al. synthesized N-CQDs from Ruta graveolens leaves with 18% quantum yield and used it as fluorescent sensor for the detection of Cr(VI) with a detection limit of 300 nM. Guo et al. utilised a hydrothermal method for the synthesis of NB-CQDs using 2-hydroxyphenylboronic acid and ethylenediamine as precursors for the sensing of Cr(VI). The developed system showed a detection limit of 0.5 μM in the linear range of 0–250 μM.21Yang et al. fabricated N,S CDs by simple microwave-assisted pyrolysis using cysteamine hydrochloride and ammonium citrate. They used the developed system for the detection of Cr(VI) and ascorbic acid. The developed CDs served as an effective fluorescent “turn-off” probe for Cr(VI) detection and “turn-on” sensor for AA with a detection limit of 0.11 μM and 0.17 μM, respectively.22
Spectroscopy techniques, classified as optical sensors, represent the most promising substitute for photoluminescence (PL) emission spectrum-based systems, which tend to be intricate, expensive, and bulky solutions. A solitary spectroscopy sensor can effectively work for the various spectral bands such as visible, ultraviolet (UV), and infrared (IR).23,24 Recent research in spectrophotometry has showcased advancements in the creation of a straightforward homemade spectrophotometer.25–27 These sensor systems incorporate a housing made from 3D printing or cardboard, featuring a designated area for sample placement and light passage through a cuvette for spectral reading measurement. The progression of commodity IoT optical sensors is streamlining the integration of spectroscopy sensor systems, making them accessible for uncomplicated, practical, and easily deployable spectroscopy applications.28,29
The imperative to develop low-cost portable spectroscopy sensor-based electronic devices for detecting heavy metal pollutants in drinking water, industrial waste, and chromium-polluted areas arises from the urgent necessity to ensure water safety and environmental sustainability. In regions worldwide, contamination of water sources by chromium poses severe threats to public health and ecosystems. Current detection methods often involve complex laboratory setups and are both time-consuming and expensive, limiting their accessibility, particularly in resource-constrained areas. By creating affordable portable spectroscopy sensor-based electronic devices, we can revolutionize water quality monitoring, enabling swift and accurate on-site detection of heavy metal pollutants such as Cr(VI). These affordable tools would empower communities, regulatory bodies, and environmental organizations to conduct real-time assessments, identify contaminated areas, and implement timely interventions to mitigate the adverse effects of heavy metal pollution, safeguarding both human health and the environment.
In this work, CQDs were synthesized using a facile green approach from dried banana peels abbreviated as BP-CQDs by a microwave-assisted method. The as-prepared BP-CQDs were sustainable, simple and cost-effective. The formation of BP-CQDs was stable and displayed excellent selectivity towards Cr(VI) and AA. Therefore, it is utilised as an efficacious probe for quantitative detection of Cr(VI) and AA. The results of this study hold distinctive attributes and present numerous advantages in comparison to prior literature investigations: (i) the synthesis of BP-CQDs utilizes a most prevalent agricultural waste, (ii) the synthesis is devoid of any harmful chemical and complex technique, (iii) the presence of intrinsic N and S in the prepared BP-CQDs, and (iv) selective detection of Cr(VI) and AA up to nanomolar. This study also includes creating a microcontroller-based system integrated with a spectroscopy sensor capable of detecting the presence of heavy metals like Cr(VI) in test samples using BP-CQDs, conducting experimental activities to determine the optimal wavelength for detecting Cr(VI) through the spectroscopy sensor-based system and validating the performance of the developed system by measuring the change in fluorescence intensity of BP-CQDs with varying concentrations of Cr(VI).
Materials and methods
Materials
Banana was procured from the local fruit market of Patiala, Punjab. All the essential chemicals required for preparing stock solutions of metal ions and analytes were obtained from Loba Chemie, India. Deionized (DI) water was employed throughout the experimental procedures.Synthesis of banana peel-derived CQDs
Firstly, banana peels were thoroughly washed with DI water and oven dried at 50 °C. After drying, the colour of the peels turned dark brown and they were further ground. The powder underwent carbonization in a muffle furnace at a temperature of 200 °C for 2 hours. The gathered black powder was dispersed in 30 mL DI water, subjected to sonication for 2 hours, and subsequently transferred to a vial. This vial was then subjected to heating at 130 °C (300 W) under microwave irradiation for 5 minutes. The resultant solution was filtered using a 0.22 μm syringe filter and was subsequently placed within a dialysis bag for 2 days. This process yielded light brown-colored BP-CQDs, as illustrated in Scheme 1.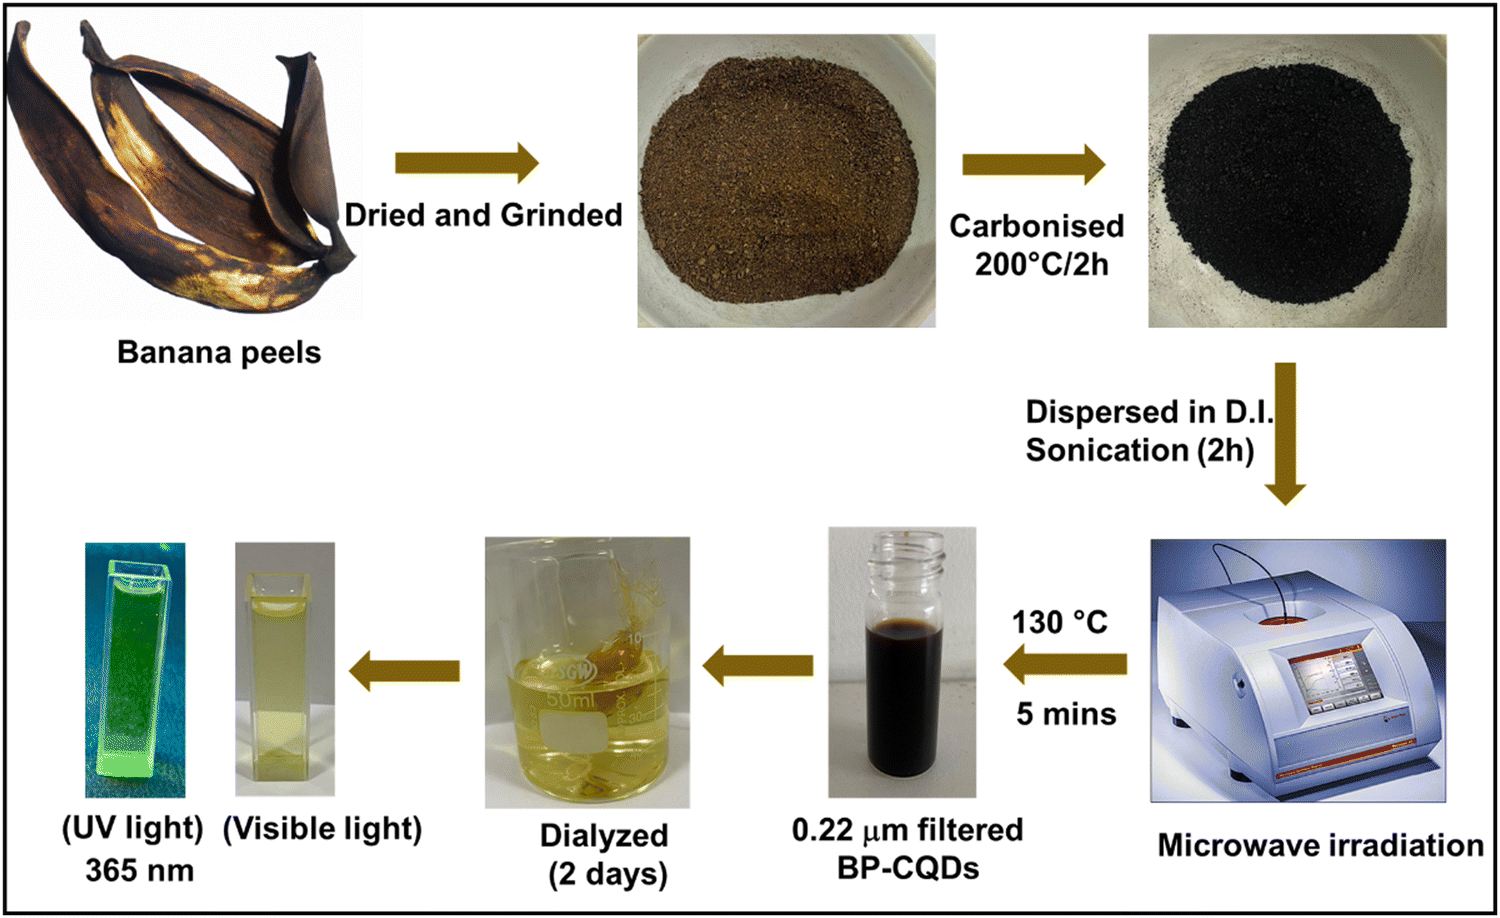 | ||
| Scheme 1 Synthesis of BP-CQDs from Citrus limon peels. | ||
Formulation of sample solutions
The stock solutions (1 mM) of different metal cations (Zn2+, Co2+, Fe3+, Al3+, Cr3+, Ni2+, Cu2+, Hg2+, Cr6+, Cd2+, Fe2+, Pb2+, Mn2+) and analytes (cysteine (Cys)), glutathione (GSH), tyrosine (Tyr), leucine (Leu), glucose, alanine (Ala), methionine (Met), lysine (Lys), tryptophan (Trp), uric acid (UA), valine (Val), dopamine (DM), and ascorbic acid (AA) were prepared in D.I. water for the selectivity studies of BP-CQDs. 10 μL of BP-CQDs in 2000 μL of DI water along with 0.1 mM of the analyte solution was pipetted in a cuvette, and emission spectra were measured. Sensitivity analysis was conducted using a stock solution containing 1 μM of Cr(VI) and AA.Quantum yield measurements
The fluorescence quantum yields of BP-CQDs in the presence of Cr(VI) and AA were determined using quinine sulfate solution (with a reference quantum yield ϕR = 0.546) as a reference, as per eqn 1: | (1) |
“ϕs” pertains to the quantum yield of BP-CQDs and “ϕR” designates the quantum yield of the reference solution. “Abs”, “A” and “η”, correspond to absorbance, emission area, and refractive index, respectively.
Results and discussion
Characterizations
Transmission electron microscopy (TEM) was employed to analyze the size and morphology of the synthesized BP-CQDs. Fig. 1a–c depicts particles of nearly spherical shape having monodispersity. The inset of Fig. 1b illustrates the particle size histogram ranging from 1–7 nm, having a particle size of 3.47 nm. To analyze the phase structure and crystallinity of the synthesized carbon quantum dots (BP-CQDs), X-ray diffraction (XRD) was employed. The XRD pattern of the CQDs exhibited a broad peak at 2θ ≈ 23.2°, indicative of their amorphous nature and the presence of disordered carbon.30 This broad peak differentiates carbon quantum dots from graphene and graphite, which typically exhibit sharper XRD peaks due to their well-ordered crystalline structures. Additionally, the absence of any additional peaks in the XRD pattern suggests the high purity of the CQDs synthesized from banana peels (Fig. 1d). | ||
| Fig. 1 (a) TEM image of BP-CQDs, (b) TEM micrograph with the inset showing the size distribution histogram, (c) TEM image showing spherical particles, and (d) XRD spectra of BP-CQDs. | ||
An XPS analysis was conducted to gain insights into the surface chemical composition of the fabricated BP-CQDs. The survey spectra (Fig. 2a) reveal distinct peaks at 167.4, 284.9, 402.2, and 532.0 eV, corresponding to S 2p (1.27%), C 1s (78.67%), N 1s (4.77%), and O 1s (15.29%), respectively, as depicted in the inset of Fig. 2a. The deconvoluted C 1s spectrum (Fig. 2b) reveals the presence of three prominent peaks at 284.7, 286.5, and 288.2 eV, corresponding to C![[double bond, length as m-dash]](https://www.rsc.org/images/entities/char_e001.gif) C/C–C, C–O/C–N/C–S, and OC/CN, respectively.31 The high resolution XPS spectrum of S 2p (Fig. 2c) showed three peaks at 163.7, 166.1, and 169.1 eV attributed to S 2p3/2 and S 2p1/2 of –C–S covalent bonds owing to spin–orbit coupling, and –C–SOx (x = 2,3,4) species.31,32 The O 1s spectrum (Fig. 2d) showed peaks at 530.7 eV and 532.4 eV assigned to CO and C–O–C/C–OH.33 The N 1s spectra (Fig. 2e) showed peaks at 398.3 eV and 399.2 eV corresponding to pyridinic and pyrrolic N.32 The confirmation of functional groups on the surface of BP-CQDs was achieved using FT-IR spectroscopy (Fig. 2f). The FT-IR absorption band centered at 3306 cm−1 was ascribed to the stretching vibration of the O–H/N–H group. The peak at 2924 cm−1 resembles the C–H stretching vibration of methylene or a methyl group because of the presence of aliphatic hydrocarbon.34 The peaks at 1718 cm−1, 1630 cm−1, 1427 cm−1, and 1242 cm−1 correspond to CO, CC, C–N–C, and C–O–C, respectively. Additionally, the peaks at 1013 cm−1 confirm the C–O/SO stretching.31 A small band at 827 cm−1 corresponds to methylene bending vibrations.9 All of these functional groups collectively enhance the remarkable water solubility of BP-CQDs, implying that the synthesized BP-CQDs hold potential for subsequent modifications and applications in sensing.
C/C–C, C–O/C–N/C–S, and OC/CN, respectively.31 The high resolution XPS spectrum of S 2p (Fig. 2c) showed three peaks at 163.7, 166.1, and 169.1 eV attributed to S 2p3/2 and S 2p1/2 of –C–S covalent bonds owing to spin–orbit coupling, and –C–SOx (x = 2,3,4) species.31,32 The O 1s spectrum (Fig. 2d) showed peaks at 530.7 eV and 532.4 eV assigned to CO and C–O–C/C–OH.33 The N 1s spectra (Fig. 2e) showed peaks at 398.3 eV and 399.2 eV corresponding to pyridinic and pyrrolic N.32 The confirmation of functional groups on the surface of BP-CQDs was achieved using FT-IR spectroscopy (Fig. 2f). The FT-IR absorption band centered at 3306 cm−1 was ascribed to the stretching vibration of the O–H/N–H group. The peak at 2924 cm−1 resembles the C–H stretching vibration of methylene or a methyl group because of the presence of aliphatic hydrocarbon.34 The peaks at 1718 cm−1, 1630 cm−1, 1427 cm−1, and 1242 cm−1 correspond to CO, CC, C–N–C, and C–O–C, respectively. Additionally, the peaks at 1013 cm−1 confirm the C–O/SO stretching.31 A small band at 827 cm−1 corresponds to methylene bending vibrations.9 All of these functional groups collectively enhance the remarkable water solubility of BP-CQDs, implying that the synthesized BP-CQDs hold potential for subsequent modifications and applications in sensing.
 | ||
| Fig. 2 (a) Survey spectra of BP-CQDs, high resolution spectrum of (b) C 1s, (c) S 2p, (d) O 1s and (e) N 1s, and (f) FT-IR spectra of BP-CQDs. | ||
Optical studies of BP-CQDs
The optical characteristics were assessed by examining the UV-visible absorption spectra and fluorescence spectra of the fabricated BP-CQDs. In Fig. S1a (ESI†), there is a distinctive shoulder band observed around 268 nm and 328 nm, which can be attributed to π–π* transitions of sp2 CC bonds and n–π* transitions of CO in BP-CQDs.35 Furthermore, upon exposure to UV light (365 nm), the BP-CQDs exhibit intense green fluorescence emission, while they appear light brown under visible light, as illustrated in the inset of Fig. S1a (ESI†). The fluorescence emission observed from BP-CQDs is thought to originate from the radiative recombination between electron–hole pairs. This phenomenon is attributed to photoinduced charge separation and trapping at surface sites.36 The fluorescence quantum yield of the BP-CQDs was found to be 41% using eqn (1). To investigate the fluorescence characteristics, excitation and emission spectra were studied, as depicted in Fig. S1b (ESI†). Upon being excited at 330 nm, the BP-CQDs exhibited their highest photoluminescence emission intensity at 428 nm.
The fluorescence emission spectra were examined at various excitation wavelengths, as depicted in Fig. S1c (ESI†). A redshift in the emission wavelengths, ranging from 397 to 497 nm, was observed with changes in λex. The excitation-dependent emission behaviour seen in the BP-CQDs can be ascribed to several factors such as the quantum confinement effect, surface edge defects, sp2 aromatic domains, and size variations.37
Stability assessment of BP-CQDs
Prior to any further applications, the stability of the luminescent properties in BP-CQDs holds significant importance. The influence of pH, irradiation time and storage days on the PL intensity of BP-CQDs was investigated. As depicted in Fig. S2a (ESI†), a marginal enhancement in PL intensity was observed within the pH range of 2 to 7. Conversely, a minor decline in PL intensity was noted as the pH value approached 13. The change in the PL intensity of BP-CQDs was attributed to the process of protonation and deprotonation of emissive sites present on the surface of the BP-CQDs.38 To assess photostability, BP-CQDs underwent irradiation using a Xe-arc lamp for up to 90 minutes, revealing no substantial change in intensity (Fig. S2b, ESI†). Furthermore, BP-CQDs were exposed to a 60-day storage period, and PL spectra were measured at regular intervals. These measurements indicated minimal fluctuations in intensity over the entire duration (Fig. S2c, ESI†). These investigations firmly establish the exceptional stability of BP-CQDs.Sensing of Cr(VI) ions
The fluorescence intensity of the prepared BP-CQDs was effectually quenched by adding the different concentrations (0 nM–420 nM) of Cr(VI), as shown in Fig. 3a. To comprehend the quenching efficiency of Cr(VI) the graph between F0/F vs. the quencher [Q] concentration was plotted based on the Stern–Volmer equation: | (2) |
![[thin space (1/6-em)]](https://www.rsc.org/images/entities/char_2009.gif) :1 linear Benesi–Hildebrand equation:39
:1 linear Benesi–Hildebrand equation:39 | (3) |
 | ||
| Fig. 3 (a) Change in fluorescence intensity of BP-CQDs with the change in concentration of Cr(VI), (b) Stern–Volmer plot of BP-CQDs, (c) linear relation between PL response (F0 − F/F0) and concentration of Cr(VI) (0–390 nM) with the inset image of F0 − F/F0vs. conc. of Cr(VI) (0–75 nM), and (d) B–H plot of Cr(VI) with BP-CQDs. | ||
| Sr. no. | Sensor system | Linear range (μM) | Detection limit | Ref. |
|---|---|---|---|---|
| 1 | B, N-CDs | 0.3–500 | 0.24 μM | 40 |
| 2 | CQDs | 0.01 to 50 | 0.52 μM | 41 |
| 3 | CDs | 0.5–263 | 0.26 μM | 42 |
| 4 | Dual emissive CDs | 2–300 | 0.4 μM | 43 |
| 5 | Co-doped CDs | 5–125 | 1.17 μM | 44 |
| 6 | SQDs@UiO-66-NH2 | 0.2–200 | 0.16 μM | 45 |
| 7 | CQDs | 0.5–200 | 0.73 μM | 46 |
| 8 | BP-CQDs | 0–390 | 60.5 nM | Present work |
| 9 | BP-CQDs | 0–75 | 13. nM | Present work |
“F0” and “F” signify PL intensities in the absence and presence of quencher, i.e., Cr(VI). “Q” signifies the quencher concentration. F1 is the intensity of 1:1 stoichiometric BP-CQDs-Cr(VI). “K” represents the binding constant of BP-CQDs with Cr(VI). The graph of (1/F0 − F) versus 1/[Q] shows a linear line with K = 2107 nM−1 and R2 = 0.997 (Fig. 3d).
Selectivity studies of Cr(VI)
The photoluminescence intensity of BP-CQDs was studied with various metal ions (Zn2+, Co2+, Fe3+, Al3+, Cr3+, Ni2+, Cu2+, Hg2+, Cr6+, Cd2+, Fe2+, Pb2+, Mn2+) at a specific concentration (Fig. S3a, ESI†). The findings demonstrated a substantial PL response following the introduction of Fe3+, Cr3+, and Cr6+ ions, whereas all other cations exhibited minimal response (Fig. S3a, ESI†). Remarkably, the PL intensity of the fabricated fluorescent probe experienced significant quenching in the presence of Cr6+ ions, which confirmed that the BP-CQDs are selective for Cr6+ ions. Sensitivity tests were carried out using 1 μM stock solution of Cr6+ ions. However, as shown by the interference studies, none of these metal ions significantly interfere with the detection of Cr(VI) (Fig. S3b, ESI†).Plausible sensing mechanism of Cr(VI)
To explore the potential interaction mechanism between Cr(VI) ions and BP-CQDs, the optical properties of their spectra were analysed to understand the quenching process. Fig. 4a displays the excitation and emission spectra of BP-CQDs alongside the UV-vis spectra of Cr(VI). The peak absorption of the quencher (Cr(VI)) coincided with the excitation spectra of BP-CQDs due to the Inner filter effect (IFE). This alignment represents a notable overlap between the absorber's absorption band and the fluorophore's excitation or emission band. As depicted in Fig. 4a, Cr(VI) exhibited broad absorption peaks at 257, 348, and 440 nm, while BP-CQDs displayed an excitation band at 330 nm and an emission peak at 428 nm, indicating significant overlap among the excitation, emission, and absorption bands within the sensing system. Consequently, the photoluminescence (PL) quenching can be attributed to the IFE.40 Additionally, the photoluminescence (PL) decay spectrum of the BP-CQDs was analyzed both in the absence and presence of Cr(VI) to confirm the quenching process. As illustrated in Fig. 4b, the average lifetimes of BP-CQDs alone and with Cr(VI) were found to be 3.369 ns and 3.382 ns, respectively. The marginal difference in the fluorescence lifetimes following the introduction of Cr(VI) indicates that there was no significant electron transfer occurring between the BP-CQDs and Cr(VI). Therefore, the mechanism was attributed to IFE. Fig. 4c illustrates the enhancement of the absorption peak when Cr(VI) is present, without any shift in peak position. This indicates that no new substance was formed. | ||
| Fig. 4 (a) The absorption spectra of Cr(VI) ions overlap with the excitation spectrum of BP-CQDs confirming IFE, (b) fluorescence lifetime decay of BP-CQDs with Cr(VI) and AA, and (c) UV-Vis absorption spectrum of BP-CQDs, Cr (VI), BP-CQDs+ Cr(VI), and BP-CQDs+ Cr(VI)+ AA. | ||
Experimental design and implementation
This section of the paper is focussed to the customized design of an optical signal-based sensor for detecting heavy metals, specifically chromium (Cr), using light sources and detectors in the ultraviolet (UV), visible (VIS), and near-infrared (NIR) spectral ranges. We investigate the optimal wavelengths of light to precisely determine the concentration of Cr(VI) in a sample solution. The signal's intensity, as it passes through the sample, is contingent on how light is absorbed and scattered within the sample, which, in turn, is influenced by the Cr(VI) concentration in the solution. We favour the use of UV light sources over VIS-NIR sources because UV light is less absorbed by samples containing mixed Cr(VI). The high absorption of mid-infrared (MIR) and VIS-NIR light by samples mixed with heavy metals diminishes the intensity of the reflected light detected.Sensor selection
Fig. S4 (ESI†) shows the SparkFun Triad Spectroscopy Sensor, which functions as a durable optical examination tool often recognized as a spectrophotometer. This device is equipped with three AS7265x spectral sensors and utilizes visible, ultraviolet (UV), and infrared (IR) LEDs to illuminate and analyze a wide variety of sample surfaces using light spectroscopy. The Triad features three unique sensors, namely the AS72651, AS72652, and AS72653, enabling it to capture light across a spectrum that spans from 410 nm (UV) to 940 nm (IR).This system comprises three compact sensor chips, each equipped with a built-in aperture, on-chip optical filters, and a precisely aligned photodiode array. Within this chipset, there are 18 specific wavebands situated at 410, 435, 460, 485, 510, 535, 560, 585, 610, 645, 680, 705, 730, 760, 810, 860, 900, and 940 nm, each having a consistent full width at half maximum (FWHM) of 20 nm. These 18 distinct light frequencies can be measured with great precision, achieving accuracy as fine as 28.6 nanowatts per square centimeter (nW cm−2) with a margin of error of approximately ±12%. The optical features are tailored for diffused light, offering a wide aperture, and the spectral sensitivity has been pre-calibrated.41 The output generated by this sensor array is used to assess and characterize how different materials interact with, absorb, or reflect the 18 diverse light frequencies.
Experimental setup
The experimental configuration employed in this research was crafted as a prototype for a portable system, emphasizing ease of manufacturing and reproducibility, to swiftly estimate the internal attributes of the sample within a field setting. Typically, three distinct measurement modes—namely, transmittance, reflectance, and interactance—are employed to assess the quantity of heavy metals such as Cr(VI). Among these modes, the study opted for the interactance mode. In this mode, both the light source and detector are situated on a single side of the sample, and they are separated by a light shield to eliminate any potential specular reflection.42This method is advantageous for the portable system as it allows for measurements by placing the sample-filled cuvette in front of the light source-sensor arrangement. Among the available measurement modes, interactance is considered the most efficient for predicting the internal characteristics of samples based on their spectral properties.43Fig. 5 depicts the schematic flow representation of the methodology.
 | ||
| Fig. 5 Schematic representation of the methodology flow. | ||
3D design of the device
A 3D-printable structure is designed for the housing of the AS7265x sensor on Tinkercad. This design process centers around an enclosure that effectively cradles the sensor while granting access to essential components like the cuvette, light sources, and detectors. The external dimensions of this structure have been determined by aligning with the sensor's width, length, and height, measuring 40 mm × 42.5 mm × 62 mm. The designated dimensions for the cuvette placement are 17.5 mm × 17.5 mm × 7 mm. Fig. S5 (ESI†) illustrates the few steps in the design processes for creating a 3D structure model using Tinkercad prior to the actual printing stage.Sample preparation
In this study, we employed an environmentally friendly method to synthesize carbon quantum dots (CQDs) from dried banana peels, denoted as BP-CQDs, using a microwave-assisted approach. To investigate the selectivity of BP-CQDs, we prepared a 1 mM stock solution of various metal cations and analytes in deionized water. For the selectivity studies, we pipetted 10 μL of BP-CQDs into 2000 μL of DI water, along with 0.1 mM of the analyte solution, and measured the emission spectra in a cuvette. Sensitivity analysis was carried out using a stock solution containing 1 μM of Cr(VI).Experimental setup
Fig. 6 depicts the setup used in the experiment for a portable device designed to detect heavy metals in a BP-CQD sample. The prototype module is built around a spectroscopy sensor capable of efficiently measuring the concentration of Cr(VI) at a low cost. This prototype comprises a 3D-printed housing with an integrated sensor and cuvette assembly. During the experimental procedure, the BP-CQD sample with varying Cr(VI) concentrations is exposed to a UV light source, which absorbs some of the source light. However, a portion of the light intensity is reflected back to the detector and serves as an indicator of the Cr(VI) concentration in the sample. As the concentration of Cr(VI) increases in each step, the corresponding detector values are recorded. With each increment in Cr(VI) concentration, a quenching effect occurs, leading to a decrease in the intensity measured by the detector. | ||
| Fig. 6 Experimental setup (a) 3D structure, (b) sensor and cuvette placement, (c) complete device assembly, and (d) experimental setup. | ||
Identifying the optimal wavelength for detection of Cr(VI)
The optimal wavelengths for detecting Cr(VI) are determined by analysing the intensity data obtained from the Triad Sensor across 18 different wavelengths. These intensity measurements are first converted from analog to digital format using an integrated analog-to-digital converter within the AS7265x. Subsequently, the Arduino IDE software processes the intensity data for each of the experiments, and the results are recorded for further signal processing.It is already established in our experiment that the use of light sources in the ultraviolet (UV) range is preferred because of the lower absorption of UV light by a BP-CQDs sample mixed with Cr(VI). In this experiment, we initially expose distilled water to a UV light source and record the detector data at three wavelengths, such as 410 nm, 435 nm, and 460 nm. The intensity of light detected at these wavelengths is subject to two influential factors: (1) light scattering and (2) light absorption by the BP-CQD sample mixed with chromium Cr(VI) concentration. Both of these characteristics are wavelength-dependent. Table S1 (ESI†) presents data measured from the UV detector, which indicates that at the wavelengths of 410 nm, 435 nm, and 460 nm, an increase in chromium concentration results in higher light absorption, consequently leading to a decrease in the measured light intensity.
To enhance clarity, the data measured by the UV detector is displayed on the vertical axis at different wavelengths in Fig. 7a, illustrating the measurement of light intensity received by the detector, reflecting from the BP-CQD sample with different concentrations of chromium (Cr(VI)). Fig. 7b illustrates that the intensity graph at a wavelength of 460 nm offers the most favourable option for the experiment, primarily because of its superior linearity when compared to the other two wavelengths (410 nm and 435 nm) across various concentrations of Cr(VI). The limit of detection was calculated to be 69 nM computed using 3σ/K. This portable sensor shows accuracy with the detection limit calculated previously (Fig. 3c), where experiments were performed using photoluminescence spectrophotometer. The experimental results and validation procedures have confirmed the spectroscopy sensor-based system's proficiency in accurately detecting and quantifying Cr(VI) concentrations in the test samples.
 | ||
| Fig. 7 (a) Normalised intensity at the UV detector for three wavelengths (410 nm, 435 nm, and 460 nm) reflected from the sample at different chromium concentrations and (b) intensity at the detector. | ||
Detection of ascorbic acid
Selectivity and sensitivity studies
To assess the selectivity of AA detection, interference amid various analytes such as cysteine (Cys), glutathione (GSH), tyrosine (Tyr), leucine (Leu), glucose, alanine (Ala), methionine (Met), lysine (Lys), tryptophan (Trp), uric acid (UA), sodium borohyride (NaBH4), hydrazine (N2H4), thiourea (TU), valine (Val), dopamine (DM), and ascorbic acid (AA) was studied. The results (Fig. 8a) confirmed that the AA exhibited a significant response in comparison to the other analytes. Interestingly, the presence of other species did not significantly enhance the fluorescence of the BP-CQDs + Cr(VI) system, whereas AA led to a rapid recovery of fluorescence in this system. Considering the redox reaction between Cr(VI) and AA, the BP-CQDs + Cr(VI) system demonstrated its potential as a “turn-on” fluorescent sensor for AA detection. In this system, AA reduced Cr(VI) to Cr(III), which eliminated the inner filter effect (IFE) and restored BP-CQDs fluorescence.22 Initially, the fluorescence of BP-CQDs was quenched by Cr(VI) due to the IFE, but upon adding AA, the fluorescence of the BP-CQDs + Cr(VI) system switched from “off” to “on”. Fig. 8b shows that with the gradual addition of AA (0–800 nM) in the sensor system, gradual increase in fluorescence intensity was observed. The graphs of (F − F0/F0) vs. AA concentration showed a reliable linear range for the developed sensor system, i.e., BP-CQDs + Cr(VI). Here, F represents the fluorescence intensity with AA present, while F0 indicates the fluorescence intensity without AA. The limit of detection (LOD) value for the system upon AA addition was found to be 86 nM (Fig. 8(c)). Furthermore, the binding constant values of BP-CQDs + Cr(VI) by adding AA were calculated using the Benesi–Hildebrand equation (Fig. 8d). | ||
| Fig. 8 (a) Selectivity studies of BP-CQDs + Cr(VI) with different analytes, (b) fluorescence restoration of the system upon addition of AA, (c) plot of the fluorescence response of the BP-CQDs + Cr(VI) [(F − F0)/F0] vs. AA concentration, and (d) B–H plot indicating binding constant values. | ||
Restoration mechanism
The “off–on” detection mechanism is specific to AA, likely due to the following reasons. Firstly, the restored fluorescence in the presence of AA can be attributed to the high-efficiency chelation effect of AA's functional groups, which effectively remove Cr(VI) from the surface of the BP-CQDs/Cr(VI) fluorescent probe. Secondly, AA may potentially reduce Cr(VI) to Cr(III)/Cr(0), resulting in the elimination of the inner filter effect (IFE) and consequently restoring the fluorescence of BP-CQDs (Scheme 2).44 Therefore, this BP-CQDs/Cr(VI) system could be utilized as a “turn-on” fluorescence probe for AA detection.45 Furthermore, the fluorescence recovery was corroborated by fluorescence lifetime decay data, which revealed a negligible change in the average lifetime after the addition of ascorbic acid to the BP-CQDs + Cr(VI) system (Fig. 4b).46 These findings demonstrate that the developed sensing platform is simple, environmentally friendly, and cost-effective when compared to alternative techniques. | ||
| Scheme 2 Fluorescence restoration mechanism of BP-CQDs. | ||
Conclusions
The current study utilized a cost-effective and eco-friendly method to produce highly water-soluble fluorescent carbon quantum dots (CQDs) from banana peels. Microwave irradiation was employed without adding any chemical agents during the synthesis. This process resulted in intrinsically nitrogen and sulphur-functionalized BP-CQDs omitting the need for any additional dopants. Interestingly, BP-CQDs demonstrated remarkable optical properties with a fluorescent quantum yield of 41% and emitted a bright green color when exposed to UV light. However, BP-CQDs, function as an “on–off” fluorescent nanoprobe for the selective and sensitive detection of highly toxic Cr(VI) in pure aqueous medium with the detection limit of 60.5 nM. The mechanistic study indicated that the sensing behaviour of BP-CQDs is based on the synergistic effects of the inner filter effect and static quenching mechanism. This occurs because the absorption band of Cr(VI) precisely overlaps with the excitation and emission bands of the fluorophore BP-CQDs, and there is no change in lifetime before and after the addition of Cr(VI) and AA to the BP-CQDs. Strategically, the BP-CQDs + Cr(VI) system also functioned as a turn-on sensor for AA with the detection limit of 86 nM. This is likely due to the reduction of Cr(VI) to the lower valent Cr(III), which eliminates the inner filter effect and restores the fluorescence of the BP-CQDs. The experimentation results and validation procedures have established the spectroscopy sensor-based system's adeptness in precisely identifying and measuring Cr(VI) concentrations in test samples. Additionally, it exhibits a commendable selectivity in detecting Cr(VI) amidst diverse interference analytes. Its sensitivity and selectivity make it a promising low-cost, portable tool for environmental monitoring and industrial applications where the presence of heavy metals poses risks to health and ecosystems.Data availability
The data supporting this article have been included as part of the Supplementary Information.Conflicts of interest
The authors have no conflicts of interest.Acknowledgements
Aayushi Kundu is grateful to TIET for financial support. The authors are grateful to IIT Roorkee for XPS analysis. The authors are thankful to CIL, PU, Chandigarh for HR-TEM analysis. The authors are truly grateful to SPMS, TIET, Patiala for XRD analysis.References
- A. Kundu, B. Maity and S. Basu, Orange Pomace-Derived Fluorescent Carbon Quantum Dots: Detection of Dual Analytes in the Nanomolar Range, ACS Omega, 2023, 8(24), 22178–22189, DOI:10.1021/acsomega.3c02474.
- N. Sohal, B. Maity and S. Basu, Morphology-Dependent Performance of MnO2Nanostructure-Carbon Dot-Based Biosensors for the Detection of Glutathione, ACS Appl. Bio Mater, 2021, 4(6), 5158–5168, DOI:10.1021/acsabm.1c00353.
- S. Chernyak, A. Podgornova, S. Dorofeev, S. Maksimov, K. Maslakov, S. Savilov and V. Lunin, Synthesis and Modification of Pristine and Nitrogen-Doped Carbon Dots by Combining Template Pyrolysis and Oxidation, Appl. Surf. Sci., 2020, 507, 145027, DOI:10.1016/j.apsusc.2019.145027.
- K. Hagiwara, S. Horikoshi and N. Serpone, Photoluminescent Carbon Quantum Dots: Synthetic Approaches and Photophysical Properties, Chem. – Eur. J., 2021, 27(37), 9466–9481 CrossRef CAS PubMed.
- Z. M. Khan, R. S. Rahman, S. Islam and M. Zulfequar, Hydrothermal Treatment of Red Lentils for the Synthesis of Fluorescent Carbon Quantum Dots and Its Application for Sensing Fe3+, Opt. Mater., 2019, 91, 386–395, DOI:10.1016/j.optmat.2019.03.054.
- A. M. Alex, M. D. Kiran, G. Hari, A. Krishnan, J. S. Jayan and A. Saritha, Carbon Dots: A Green Synthesis from Lawsonia Inermis Leaves, Mater. Today Proc., 2019, 26, 716–719, DOI:10.1016/j.matpr.2019.12.409.
- Y. Lv, L. Gan, M. Liu, W. Xiong, Z. Xu, D. Zhu and D. S. Wright, A Self-Template Synthesis of Hierarchical Porous Carbon Foams Based on Banana Peel for Supercapacitor Electrodes, J. Power Sources, 2012, 209, 152–157, DOI:10.1016/j.jpowsour.2012.02.089.
- R. S. D. Castro, L. Caetano, G. Ferreira, P. M. Padilha, M. J. Saeki, L. F. Zara, M. A. U. Martines and G. R. Castro, Banana Peel Applied to the Solid Phase Extraction of Copper and Lead from River Water: Preconcentration of Metal Ions with a Fruit Waste, Ind. Eng. Chem. Res., 2011, 50(6), 3446–3451 CrossRef CAS.
- R. Atchudan, T. N. J. I. Edison, M. Shanmugam, S. Perumal, T. Somanathan and Y. R. Lee, Sustainable Synthesis of Carbon Quantum Dots from Banana Peel Waste Using Hydrothermal Process for in Vivo Bioimaging, Phys. E, 2021, 126, 114417 CrossRef CAS.
- R. Lv, J. Wang, Y. Zhang, H. Li, L. Yang, S. Liao, W. Gu and X. Liu, An Amino-Decorated Dual-Functional Metal–Organic Framework for Highly Selective Sensing of Cr (III) and Cr (VI) Ions and Detection of Nitroaromatic Explosives, J. Mater. Chem. A, 2016, 4(40), 15494–15500 RSC.
- X. Luo, W. Zhang, Y. Han, X. Chen, L. Zhu, W. Tang, J. Wang, T. Yue and Z. Li, N,S Co-Doped Carbon Dots Based Fluorescent “on-off-on” Sensor for Determination of Ascorbic Acid in Common Fruits, Food Chem., 2018, 258, 214–221, DOI:10.1016/j.foodchem.2018.03.032.
- H. Meng, D. Yang, Y. Tu and J. Yan, Turn-on Fluorescence Detection of Ascorbic Acid with Gold Nanolcusters, Talanta, 2017, 165, 346–350, DOI:10.1016/j.talanta.2016.12.047.
- L. Wang, C. Gong, Y. Shen, W. Ye, M. Xu and Y. Song, A Novel Ratiometric Electrochemical Biosensor for Sensitive Detection of Ascorbic Acid, Sens. Actuators, B, 2017, 242, 625–631 CrossRef CAS.
- S. A. Miscoria, C. Jacq, T. Maeder and R. M. Negri, Screen-Printed Electrodes for Electroanalytical Sensing, of Chromium VI in Strong Acid Media, Sens. Actuators, B, 2014, 195, 294–302 CrossRef CAS.
- A. Ravindran, M. Elavarasi, T. C. Prathna, A. M. Raichur, N. Chandrasekaran and A. Mukherjee, Selective Colorimetric Detection of Nanomolar Cr (VI) in Aqueous Solutions Using Unmodified Silver Nanoparticles, Sens. Actuators, B, 2012, 166, 365–371 CrossRef.
- G. Wang, Z. Chen and L. Chen, Mesoporous Silica-Coated Gold Nanorods: Towards Sensitive Colorimetric Sensing of Ascorbic Acid via Target-Induced Silver Overcoating, Nanoscale, 2011, 3(4), 1756–1759 RSC.
- A. Khan, M. I. Khan, Z. Iqbal, Y. Shah, L. Ahmad, S. Nazir, D. G. Watson, J. A. Khan, F. Nasir and A. Khan, A New HPLC Method for the Simultaneous Determination of Ascorbic Acid and Aminothiols in Human Plasma and Erythrocytes Using Electrochemical Detection, Talanta, 2011, 84(3), 789–801 CrossRef CAS PubMed.
- Y. Zhang, X. Fang, H. Zhao and Z. Li, A Highly Sensitive and Selective Detection of Cr (VI) and Ascorbic Acid Based on Nitrogen-Doped Carbon Dots, Talanta, 2018, 181, 318–325 CrossRef CAS PubMed.
- A. Kundu, B. Maity and S. Basu, Coal-Derived Graphene Quantum Dots with a Mn2+/Mn7+ Nanosensor for Selective Detection of Glutathione by a Fluorescence Switch-off-on Assay, New J. Chem., 2022, 46(16), 7545–7556, 10.1039/d2nj00220e.
- A. Kundu, B. Maity and S. Basu, Rice Husk-Derived Carbon Quantum Dots-Based Dual-Mode Nanoprobe for Selective and Sensitive Detection of Fe3+ and Fluoroquinolones, ACS Biomater. Sci. Eng., 2022, 8(11), 4764–4776, DOI:10.1021/acsbiomaterials.2c00798.
- Y. Guo, Y. Chen, F. Cao, L. Wang, Z. Wang and Y. Leng, Hydrothermal Synthesis of Nitrogen and Boron Doped Carbon Quantum Dots with Yellow-Green Emission for Sensing Cr (VI), Anti-Counterfeiting and Cell Imaging, RSC Adv., 2017, 7(76), 48386–48393 RSC.
- H. Yang, L. He, Y. Long, H. Li, S. Pan, H. Liu and X. Hu, Fluorescent Carbon Dots Synthesized by Microwave-Assisted Pyrolysis for Chromium(VI) and Ascorbic Acid Sensing and Logic Gate Operation, Spectrochim. Acta, Part A, 2018, 205, 12–20, DOI:10.1016/j.saa.2018.07.015.
- A. Thakur and P. Devi, A Comprehensive Review on Water Quality Monitoring Devices: Materials Advances, Current Status, and Future Perspective, Crit. Rev. Anal. Chem., 2024, 54(2), 193–218 CrossRef CAS PubMed.
- A. F. Silva, K. Löfkvist, M. Gilbertsson, E. V. Os, G. Franken, J. Balendonck, T. M. Pinho, J. Boaventura-Cunha, L. Coelho, P. Jorge and R. C. Martins, Hydroponics Monitoring through UV-VIS Spectroscopy and Artificial Intelligence: Quantification of Nitrogen, Phosphorous and Potassium, Chem. Proc., 2021, 5(1), 88 Search PubMed.
- L. G. Pap, An Inexpensive 3D-Printable Do-It-Yourself Visible Spectrophotometer for Online, Hybrid, and Classroom-Based Learning, J. Chem. Educ., 2021, 98(8), 2584–2591 CrossRef CAS.
- N. A. Alhamdi and M. J. Aboudiah, Implementation of LED Based Spectrophotometer Using SoC_FPGA, In 2021 IEEE 1st International Maghreb Meeting of the Conference on Sciences and Techniques of Automatic Control and Computer Engineering, MI-STA 2021 – Proceedings, IEEE, 2021, pp. 166–170 DOI:10.1109/MI-STA52233.2021.9464495.
- L. M. Díaz-Vázquez; B. M. Ortiz-Andrade; M. L. Kovarik and M. L. Morris, In Active Learning Exercises Involving Building and Design, Active Learning in the Analytical Chemistry Curriculum, ACS Publications, 2022, pp. 181–204 Search PubMed.
- N. Emmanuel; R. B. Nair; B. Abraham and K. Yoosaf, Fabricating a Low-Cost Raman Spectrometer to Introduce Students to Spectroscopy Basics and Applied Instrument Design, Journal of Chemical Education, ACS Publications, 2021, pp. 2109–2116. DOI:10.1021/acs.jchemed.0c01028.
- H. J. Han, D. H. Jung, H. J. Kim, T. S. Lee, H. S. Kim, H. Y. Kim and S. H. Park, Application of a Spectroscopic Analysis-Based Portable Sensor for Phosphate Quantitation in Hydroponic Solutions, J. Sensors, 2020, 2020, DOI:10.1155/2020/9251416.
- A. H. Altajer, S. Efendi, A. H. Jabbar, S. Oudah Mezan, L. Thangavelu, M. M Kadhim and A. M. F Alkai, Novel Carbon Quantum Dots: Green and Facile Synthesis, Characterization and Its Application in on-off-on Fluorescent Probes for Ascorbic Acid, J. Nanostructures, 2021, 11(2), 236–242 CAS.
- N. Chaudhary, P. K. Gupta, S. Eremin and P. R. Solanki, One-Step Green Approach to Synthesize Highly Fluorescent Carbon Quantum Dots from Banana Juice for Selective Detection of Copper Ions, J. Environ. Chem. Eng., 2020, 8(3), 103720 CrossRef CAS.
- D. Sun, R. Ban, P.-H. Zhang, G.-H. Wu, J.-R. Zhang and J.-J. Zhu, Hair Fiber as a Precursor for Synthesizing of Sulfur-and Nitrogen-Co-Doped Carbon Dots with Tunable Luminescence Properties, Carbon, 2013, 64, 424–434 CrossRef CAS.
- X. Hu, Y. Li, Y. Xu, Z. Gan, X. Zou, J. Shi, X. Huang, Z. Li and Y. Li, Green One-Step Synthesis of Carbon Quantum Dots from Orange Peel for Fluorescent Detection of Escherichia Coli in Milk, Food Chem., 2021, 339, 127775 CrossRef CAS PubMed.
- B. Nagy, V. Modzeleski and M. T. J. Murphy, Hydrocarbons in the Banana Leaf, Musa Sapientum, Phytochemistry, 1965, 4(6), 945–950 CrossRef CAS.
- Y.-M. Liang, H. Yang, B. Zhou, Y. Chen, M. Yang, K.-S. Wei, X.-F. Yan and C. Kang, Waste Tobacco Leaves Derived Carbon Dots for Tetracycline Detection: Improving Quantitative Accuracy with the Aid of Chemometric Model, Anal. Chim. Acta, 2022, 1191, 339269 CrossRef CAS PubMed.
- H. Ding, S. B. Yu, J. S. Wei and H. M. Xiong, Full-Color Light-Emitting Carbon Dots with a Surface-State-Controlled Luminescence Mechanism, ACS Nano, 2016, 10(1), 484–491, DOI:10.1021/acsnano.5b05406.
- Z. Gan, H. Xu and Y. Hao, Mechanism for Excitation-Dependent Photoluminescence from Graphene Quantum Dots and Other Graphene Oxide Derivates: Consensus, Debates and Challenges, Nanoscale, 2016, 8(15), 7794–7807, 10.1039/c6nr00605a.
- N. Sohal, S. K. Bhatia, S. Basu and B. Maity, Nanomolar Level Detection of Metal Ions by Improving the Monodispersity and Stability of Nitrogen-Doped Graphene Quantum Dots, New J. Chem., 2021, 45(42), 19941–19949 RSC.
- H. A. Benesi and J. H. Hildebrand, A Spectrophotometric Investigation of the Interaction of Iodine with Aromatic Hydrocarbons, J. Am. Chem. Soc., 1949, 71(8), 2703–2707, DOI:10.1021/ja01176a030.
- A. Kundu, B. Maity and S. Basu, Orange Pomace-Derived Fluorescent Carbon Quantum Dots: Detection of Dual Analytes in the Nanomolar Range, ACS Omega, 2023, 8(24), 22178–22189, DOI:10.1021/acsomega.3c02474.
- N.-T. Tran and M. Fukuzawa, A Portable Spectrometric System for Quantitative Prediction of the Soluble Solids Content of Apples with a Pre-Calibrated Multispectral Sensor Chipset, Sensors, 2020, 20(20), 5883 CrossRef PubMed.
- B. M. Nicolai, K. Beullens, E. Bobelyn, A. Peirs, W. Saeys, K. I. Theron and J. Lammertyn, Nondestructive Measurement of Fruit and Vegetable Quality by Means of NIR Spectroscopy: A Review, Postharvest Biol. Technol., 2007, 46(2), 99–118 CrossRef.
- P. N. Schaare and D. G. Fraser, Comparison of Reflectance, Interactance and Transmission Modes of Visible-near Infrared Spectroscopy for Measuring Internal Properties of Kiwifruit (Actinidia Chinensis), Postharvest Biol. Technol., 2000, 20(2), 175–184 CrossRef.
- S. K. Tammina and Y. Yang, Highly Sensitive and Selective Detection of 4-Nitrophenol, and on-off-on Fluorescence Sensor for Cr (VI) and Ascorbic Acid Detection by Glucosamine Derived n-Doped Carbon Dots, J. Photochem. Photobiol., A, 2020, 387, 112134 CrossRef CAS.
- X. Gong, Y. Liu, Z. Yang, S. Shuang, Z. Zhang and C. Dong, An “on-off-on” Fluorescent Nanoprobe for Recognition of Chromium(VI) and Ascorbic Acid Based on Phosphorus/Nitrogen Dual-Doped Carbon Quantum Dot, Anal. Chim. Acta, 2017, 968, 85–96, DOI:10.1016/j.aca.2017.02.038.
- V. K. Singh, V. Singh, P. K. Yadav, S. Chandra, D. Bano, V. Kumar, B. Koch, M. Talat and S. H. Hasan, Bright-Blue-Emission Nitrogen and Phosphorus-Doped Carbon Quantum Dots as a Promising Nanoprobe for Detection of Cr(VI) and Ascorbic Acid in Pure Aqueous Solution and in Living Cells, New J. Chem., 2018, 42(15), 12990–12997, 10.1039/c8nj02126k.
Footnote |
| † Electronic supplementary information (ESI) available: Characterizations; figure showing the UV-visible absorption spectrum of BP-CQDs with the inset image showing BP-CQDs under visible and UV light, (b) PL excitation and emission spectra of BP-CQDs and (c) PL emission spectra of BP-CQDs under various excitation wavelengths; the impact of pH (ranging from 2 to 13) on the PL emission characteristics of BP-CQDs, (b) the influence of irradiation time (in minutes), and (c) the effect of storage duration (in days) on the fluorescence emission properties of BP-CQDs; selectivity studies of BP-CQDs towards different metal ions, (b) Interreference study with and without Cr(VI) with different metal ions; Triad Spectroscopy Sensor – AS7265x; 3D printing design of the device structure on Tinkercad; table of the measured UV detector data at three wavelengths (410 nm, 435 nm, and 460 nm) for the Cr(VI) (60 μL) and water (2000 μL) solution. See DOI: https://doi.org/10.1039/d4ma00925h |
| This journal is © The Royal Society of Chemistry 2025 |